An Analysis of Nigerian Seaborne Trade (Dry Bulk) and the Demand
for Transport.
BUHARI, CHIMA MOMOH
Department of Maritime Management Technology, School of Management Technology, Federal University of Technology, PMB 1526, Owerri, Imo State, Nigeria
+2348033394046 Buharimomoh17@gmail.com
ABSTRACT
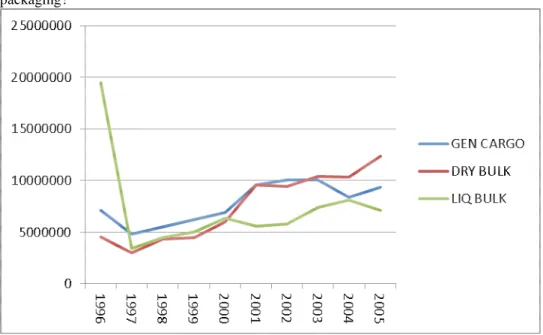
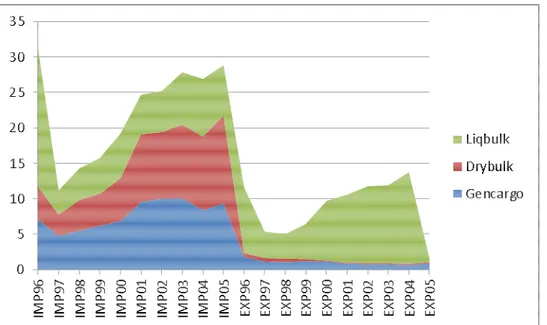
The research project deals with the size, structure and trend of Nigerian International seaborne trade, although with emphasis on dry bulks. Facts and figures about the geographical distribution of the seaborne trade and its cargo type by packaging were presented for a 10 years research period (1996-2005) with comments on the trend of Nigerian’s seaborne trade over these years. The researcher was able to analyze these, with the aid of the expo-facto scientific research design using secondary data for the demand for transport within the various selected regions of the world. The result reveals that there were most frequent shipping routes between Nigeria-USA region, this was followed by the Nigeria-Asia region trading with larger volume. And demand for transport is therefore greatest within these regions!
CHAPTER ONE
1.0 INTRODUCTION
1.1 BACKGROUND TO THE RESEARCH
The phrase, ‘‘he who controls the trade, controls the world economy’’ has remained a truism. It may seem obvious to say that, today, we live in a global world, and it is certainly true the seaborne trade among all the nations and regions of the world are nothing new. From the Phoenicians, the Vikings, the Omanis, the Spaniards, the Portuguese, the Italians, the British, the French, the Dutch, the Polynesians and Celts, the history of the world is a history of exploration, conquest and trade by sea. Eventually, the great seaborne trade became established: Coal from Australia, Southern African, and North America to Europe and the Far East, Grain from North and South America and Australia to Europe and the Far East, Oil from the Middle East, West Africa, South America and Asia, and now adding to this list, Containerized goods from China, Japan and South East Asia to the consumer market of the Western world.
According to Stopford (1988) seaborne trade involves the movements of merchandise by vessels between the port of embarkation (origin), were merchandise is receives from the exporter at the port of destination where the merchandise is claimed by the importer. It is a common knowledge that seaborne trade remains the backbone of international trade with over 80 percent of world merchandise trade by volume being carried by sea. Quantifying the value of volume of World seaborne trade in monetary terms, is difficult as figures for trade estimates are traditionally in terms of tons or tons miles, and are therefore not comparable with monetary based statistics for the value of the world economy. However, the United Nations Conference on Trade and Development (UN), Review of Maritime Transport (2005) estimates that operation of merchant ships contributes about US $380 billon freight rates within the global economy, equivalent to about 5 percent of total world trade. Seaborne trade, estimates are often calculated in tons miles as a way of measuring the demand for transports (Stopford, 1997). As the world became more developed, proximity to raw materials and to markets, demand became the factors that, about all others shaped the world’s economy and, in particular the major trade partners and sea routes.
Today, seaborne trade has evolved to the point where almost no nation can be fully self sufficient only on its domestic resources. According to Hume (1752) in his book discourse on the balance of trade, every country is involved at one or another, in the process of selling what it produces (export) and acquiring what it lack (import): none can be dependent or sufficient only on its domestic resource. Seaborne trade also has effectively permitted an enormous variety of resources to be more widely accessible and has this facilitated the wide-spread distribution of our planet. It is seen, also that seaborne trade has fostered on interdependency and inter-connectivity, today on the principles of free trade are broadly accepted through the General Agreement on Trade and Tariffs (GATT), between people who would previously have considered themselves completely unconnected. The potential benefits are clear: growth can be accelerated and prosperity more widespread; skills and technology can be more evenly dispersed, and both individuals and countries or regions can take advantage of previously unimagined economic opportunities (IMF, Global Economic Outlook, 2004). The research focuses on the demand side of dry bulk cargoes. The demand for transport of dry bulk cargo is a derived demand. The derived demand is dependent upon the nature of goods traffic in seaborne trade. If the demand for a commodity is more, the relative nature of that goods traffic becomes more. Most of the cargoes transported in dry bulk vessels are raw materials or semi-finished products used as input into industrial production (IP). The marine industry is
an essential link in international seaborne trade, with ocean-going vessels representing the most efficient, and often the only method of transporting large volumes of basic commodities and finished products. In 2006, approximately 2.7 billion tons of dry bulk cargo was transported by sea, comprising more than one-third of all international seaborne trade (Genco Shipping Report, 2006). This dry bulk cargo is shipped in large quantities and can be easily stowed in a single hold with little risk of cargo damage.
In relatively terms iron ore and coals are by far the two most important commodity groups when measured in volumes shipped, having a combined share of more than 53 percent of the total seaborne demand in 2004 (Mikkelson and Tronstad,2006).
The three largest commodities drivers of the dry bulk industry, iron ore, steam coal and grains, are all affected by seasonal demand fluctuations. Steam coal is linked to the energy markets and in general encounters upswings towards the end of the year in anticipation of the forthcoming winter period as power supply companies try to increase their stocks, or during hot summer periods when increased electricity demand is required for air conditioning and refrigeration purposes. Grain production is highly seasonal and driven by the harvest cycle of the northern and southern hemispheres. However, with four nations and the European Union representing the largest grain producers (the United States, Canada and the European Union in the northern hemisphere and Argentina and Australia in the southern hemisphere), harvests and crops reach seaborne markets throughout the year(Fearnresearch, 2004).
Demand for bulk carriers is intrinsically depended on the level of seaborne commodity trading, which in turn is linked to the state of the world economy in general and the main importing areas in particular. An abundance of low cost labour in combination with investments in modern production facilities has turned developing Asia and China in particular into the ‘‘factory of the world” similar to Japan and South Korea. China must import a large share of the raw materials needed in the industrial production Clarkson Research Studies (2005). This development in Asia is expected to continue and Asia’s direct impact on seaborne demand will in all probability grow further in the future, with its sea route hectic.
1.1.2 NIGERIA’S BACKGROUND OF SEABORNE TRADE
Nigeria has a long and proud maritime heritage which has played an integral role in the development of Western Africa, by the provision of an efficient and cost effective seaborne into Western and Central Africa and beyond. Nigeria’s location and population make it a country of diverse economic capabilities with large investment opportunities as its seaborne trade. Thus this advantage opposition enables her easy access for other ports of the sub-region are being transshipped from Nigerian major seaports. The country has a coastline of over 750km and eight major ports excluding oil terminals with a cargo handling capacity of 35million tones per annum. These ports, over the past decade, have accounted for around 99 percent by volume and 95 percent by value of the country’s total seaborne trade. The eight major ports are strung along Nigeria’s coastline and the estuaries of the main navigable rivers. These seaports provide some 93 General cargo berths, 5 RoRo berth, 7 Bulk solid berths, 63 Buoy berths, 11 Bulk liquid cargo berths and numerous private jetties. Also available in the ports is a fleet of 54 harbour craft and over 600 different types of cargo handling equipment (source, NPA, Annual Abstract of Ports Statistics). Among others, Apapa port complex is Nigeria’s largest and most vital port, which handling about half of the total seaborne trade of the country and some cargo in transit to and from the Niger, Chad, Burkina Faso and Cameroun.
Nigeria’s seaborne trade remains the focal point of West African traffic. For instance, the cargo throughput to and from Nigeria accounts for more than 70 percent of the total volume of cargo generated by the entire West Africa sub-region of Africa. Without Nigeria as a foremost market, international seaborne trading activities in West Africa region would be much affected, due to her major export commodities such as crude oil, cocoa, palm kernel, rubber and coffee, among others. With their highly developed infrastructures, modern equipments and efficiencies, professional cargo handlings and freight managements, the ports have great potential to exploit their strategic position for serving both the rapidly developing national economy and the wider West and Central African sub-regions. According to figures released by the Nigerian Ports Authority (NPA), the ports handled 45 million tons of cargo in 2005, the highest volume recorded and a 12 percent increase on the previous year. Almost 3,700 vessels, with gross registered tonnage of 60 million tons, entered Nigeria’s harbours. Imported cargo, which made up 29 million tons, or 64 percent of the total, came from 114 different countries – the main sources being the United States, Taiwan and Brazil.
1.2 RESEARCH PROBLEMS
An obvious question is what is the tonnage of the dry bulk cargoes in tons compared to other seaborne commodity types by packaging? Usually, problem of obtaining statistics about the seaborne commodity by type shipped through sea transport and unfortunately, there is another statistical problem in determining how the seaborne commodities are transported (Stopford, 1997). The difficulty of identifying such trade from Nigerian Ports Authority’s Annual Abstract of Ports Statistics, is very inconvenient for analyzing and thereby making decisions, recommendations or futuristic plans for the demand of transport, (say more fleets of vessel to region of
higher demand of trade difficult), since seaborne trade data are collected mainly in this form, and very little comprehensive information is available about the dry bulk cargo type and its average haul.
According to Damachi and Yang Zhaosheng (2005) the demand for shipping in Nigeria has always been there, but Nigeria cannot participate effectively in international trade due to some basic administrative problems that are confronting the country's shipping lines. As a result Nigeria has failed to take advantage of the competitive edge that she has in the trade as a cargo-originating state, thus loosing freight earnings to ships of other nationalities. The meaning of this is that Nigerian corporations importing necessary raw materials for manufacturing processes would have to depend on foreign vessels to carry their cargo. The existence of shipping companies with reasonable number of bulk carriers flying the Nigerian flag would have made some difference. Nigeria and Nigeria's investment in shipping have advanced retrogressively since the end of the eighties. Nigerian government’s ships then which was over twenty six were all sold to settle accumulated debts. Private sector investment in the industry was also very low from the Nigerian side. The intrinsical assumption from this could be that Nigeria lacks the shipping demand output to support investment in shipping activities (Onyemaechi, 2010).
In addition to these problems, which to some extent plague the relevant analysis of demand for any seaborne commodity, the study of transportation demand suffer from a number of handling which affect it to an unusual degree. First, the state of transportation activity greatly affects the state of prosperity of the economy, just as the state of the economy affects, in turns the demand for transportation (Coutinho, 2006). For instance, there was a notable fall of seaborne trade which occurred during the worldwide economic recessions of the early 1980s and recently in 2005. Thus, these sections of the economy cannot be treated separately. Rather, their interdependence must be taken into account in a statistical calculation using simultaneous equations. This raises a host of technical problems and difficult data requirements. Secondly, transportation technology is no mean static. There are in prospect, a number of revolutionary innovations which may change significantly the nature of the seaborne trade. Third is, transportation costs. Transportation cost, may reflect the costs directly involved in shipping (cost of service) or may be determined by the value of the commodity (value of service). Yet little attention has been given to the role of service quality and travel time as determinants of transport costs, due largely to the lack of relevant data and the difficulty of measurement (Coutinho, 2006).
1.3 AIM AND OBJECTIVES OF THE RESEARCH
The aim of this research is to analysis Nigerian dry bulk cargoes, in order to determine the demand for transport in it most trading regions in the world and shipping routes. Specifically, the objectives of this research are to:
I. Determine the traffic flow of dry bulk commodities over a 10 years research period.
II. Determine the tonnage of Nigerian exports and imports of dry bulk cargoes relative to other type of trade by packaging.
III. Determine the average haul by regions. IV. Determine the tonnage of cargoes by regions.
V. Determine the demand for transport by regions.
VI. Make suggestions for recommendation for shippers, ship owners, and the government for efficient and effective seaborne trading in Nigeria.
1.4 RESEARCH QUESTIONS
In order to achieve the slated aim and objectives of this research study, the researcher will attempt to provide answers to the following research questions;
1. What is the volume of Nigerian entire seaborne trade by region?
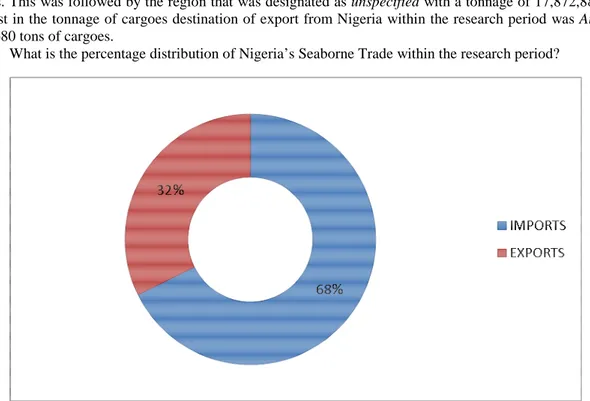
2. What is the percentage distribution of Nigerian Seaborne Trade within the research period? 3. What is the trend of Nigerian seaborne trade?
4. Is there any relative degree of importance attached to the trend of Nigerian seaborne trade by type of packaging?
1.5 STATISTICAL HYPOTHESES
To provide answers to the research questions, the following statistical hypotheses will be tentatively tested by the researcher in this research:
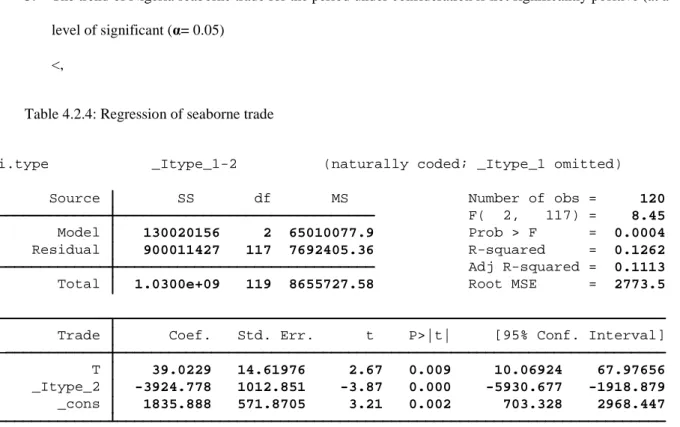
1. HO=μ2 The volume of seaborne trade through major regions is not significantly different from zero (at a level of significant (α) 0.05).
2. HO=μ2 The volumes of Nigeria’s seaborne general cargo and bulk trades (1996 – 2005) are not significantly different from zero at (at a level of significant (α) 0.05).
3. HO=μ3 The trend of Nigeria’s seaborne trade for the period under consideration is not significantly positive (at a level of significant (α) 0.05).
1.6 SIGNIFICANCE OF THE RESEARCH
A research of this kind is anticipated to make hypothetical and realistic contributions to Nigerian seaborne trading, particularly to trade of dry bulks. By this, the researcher provides a basic for closer scrutiny of the formulations and applications of the different relevant aspects of the dry bulk trading in existence and in use. The research is likely to be useful in the various range of decisions to which the demand for transport contribute, for it is extra ordinarily wide, particularly if we take into accounts the decisions made by;
I. Liner companies: planning new services.
II. Ship owner: specializing in industrial shipping or chattering. III. Shipbuilder: planning capacity.
IV. Shipper: chartering vessel for boom of a particular dry bulk trade. V. Bankers: financing fleet expansion.
<All have interest in understanding the demand for transport, due to its change.
To end with, this research is anticipated to arouse research benefit in other aspects to seaborne trades, in general and liquid bulk trading, in particular.
1.7 SCOPE AND LIMITATIONS OF THE RESEARCH
The basic premise, on which this research is based, is scrutiny of Nigerian seaborne trade and the demand for transport. This research will focus on dry bulk, confined within a manageable research period of 10 years, from 1996-2005.
This research is a prelude and indeed a pioneering work in seaborne trade, particularly in dry bulk trade in a developing country like ours. It is meant, among others, to be underpinning for other similar research. The exploratory nature of this research should be noted so that its limitations can be understood. The limitation of the researcher includes;
1. Lack of funds for research and data analyses.
2. Lack of sufficient literatures and relevant materials to the research. 3. Attitudes to research by Nigerian Ports Authority officials. 4. Lack of encouraging government policy on research. 5. Past data from NPA.
1.8 DEFINITION OF RESEARCH TERMS
I. AVERAGE HAULS: Average distance over which each ton of cargo is transported.
II. BALANCE OF TRADE: This is the relationship between the total volume of export and import of a country for a certain period of time.
III. BULK CARGO: Any individual cargo consignment sufficiently large to fill a whole ship.
IV. BULK CARRIER: Vessels in which the cargo is carried in bulk, rather than any individual cargo consignment.
V. CAPESIZE VESSEL: Vessel over 80,000 dwt.
VI. DEMAND FOR TRANSPORT: Is defined as the tonnage of cargo to be moved and the average distance over each ton of cargo is transported. It measured in tons-miles.
VII. FREIGHT RATE: Means the remuneration payable to the ship owner for the carriage of goods or hire of a ship.
VIII. FIVE MAJOR BULKS: Bulks that covers the five homogeneous bulk cargoes, i.e. Iron ore, grain, coal, phosphates and bauxites which can be transported satisfactorily in a concentrated dry bulk carrier or tweendecker stowing at 45-55 cubic feet per-ton.
IX. MINOR BULKS: They cover the many other commodities that travel in shiploads.
X. GENERAL CARGO: Is consists of any individual cargo consignment too small to fill a whole ship or hold.
XI. GDP: The gross domestic product (GDP) refers to the total value of goods and services produced in the country during one year.
XII. HANDYMAX VESSEL: Vessel over between 30,000 and 60,000dwt.
XIII. HANDYSIZE VESSEL: Vessel up to 30,000 which carry exclusively minor bulk cargo.
XIV. SEA ROUTE: Is a logistical network identified as a series of pathways and stoppages used for the commercial transport of cargo.
XV. TERM OF TRADE (TOT): Is defined to as the quantity of domestic goods that must be given up to get a unit of imported goods.
XVI. TRADE DEFICIT OR GAP: This is as a result of an increase of import trade over export trade.
XVII. TRANSPORT COST: In this research, transport costs are defined as the costs incurred in moving freight.
XVIII. UNFAVOURABLE BALANCE OF TRADE: The difference between the value of a country’s exports and the value of its imports such that imports exceed export.
1.9 RESEARCH DISPOSITION
In chapter one, the researcher reveals the introductory part of the research, illustrating the research problems, aim and objectives of the research, research questions, statistical hypotheses, etc.
Chapter 2, he further researches on review of literatures, facts and figures regarding dry bulk trading.
Chapter 3, the researcher covers the model and research method of analysis, which is the theory behind the process of handling and analyzing the data, with the use of SPSS analytical tools. The actual process is described in chapter 4, where the researcher analysis the findings for instant, he would analysis each regions using the ANOVA pair wise comparism of Nigerian’s entire seaborne trade separately.
Finally, the researcher will make the summary of the research work together with the recommendations, conclusive remarks and areas for further research in chapter 5.
CHAPTER TWO
2.0 LITERATURE REVIEW 2.1 HISTORICAL BACKGROUND
In this research the researcher focuses on the demand side of dry bulk commodities. Most of the cargoes transported in dry bulk vessels are raw materials or semi-finished products used as input into industrial production (IP). Over the last 10-15years, Asia relative share of dry bulk cargoes imports has increased substantially. In the Far East, Japan and South Korea have been significant importance of a variety of commodities for a long time. More recently China has developed in to the most significant importer of dry bulk commodities. Dry bulk commodity demand is relatively complex to analyze with over 40 different commodities or commodity groups included, each having a range of different factors influencing their overall demand for transport (Mikkelson and Tronstad, 2006).
Traditionally, however, dry bulk cargo demand has been divided into the five “Major” bulks (iron ore, coal, grain, bauxite/aluminum and phosphate) in addition to the “Minor” bulks. As inputs to steel production, fluctuations in both the iron ore and coking coal markets are strongly correlated to the steel industry, whist the remaining major bulk are related to other specific factors. Wergeland and Wijnolst, (1982) and Stopford, (1996), identify the main seaborne dry bulk commodities as iron ore and coal. They further said that the seaborne trade in these two major bulks covers roughly 65 percent of the total dry bulk demand today. The “minor” bulks are individually small in volume but collectively they make up a significant share of world commodity trades, primary as input to industrial production. Fourteen minor dry bulks cover a wide variety of commodities, such as forest products, ferrous ore, minerals and pet coke, cement, other construction materials and salt.
In general there are five major factors that influence the demand for transportation (ship). The development in the world economy is probably the most important factor. There seems to be a clear relationship between seaborne dry bulk demand and the global business cycle. One can say that without significant growth in the global economy, we are not likely to see strong growth in demand for dry bulk transportation. Generally, growth in gross domestic product and industrial production correlates with peaks in demand for seaborne transportation. Both logic and several studies suggested that there is such a link (Klovaland, 1991 and Stopford, 1997). Empirical analysis shows that business cycles have been a major determinant of the short run behaviuor of seaborne freight rate. Klovaland (2003) found that peaks in the business cycle have coincided with peaks in commodity prices and seaborne rates, as seen in table 2.1. Adding together the GDP for Japan, China and other Asia, their total contribution to world GDP was no more than 33 percent, but their share of total dry bulk imports was approximately 62 percent, in 2004 and their share of the total growth in dry bulk imports between 1990 and 2004 was 86 percent.
Table 2.1: GDP based on PPP in USD billion and as share of the World GDP.
1999 2004 E 2004-1990
USD % USD % USD % Share of Growth %
JAPAN 2451 9% 3612 7% 1160 -2.5% 4% CHINA 1497 6% 6913 13% 5416 7.3% 20% OTH ASIA 2743 10% 7130 13% 4387 3% 16% W. EUROPE 4843 18% 8614 16% 3771 -2.2% 14% USA 5760 22% 11175 21% 5415 -0.8% 20% FSU/E.EUR 2974 11% 3733 7% 759 -4.3% 3% L.AMERICA 2126 8% 4034 8% 1908 -0.5% 7% AFRICA 915 3% 1845 3% 931 0% 3% Others 3035 12% 6015 11% 2979 -0.2% 11% Total 26344 100% 53070 100% 26726 100%
Source: Clarkson Research Studies (2004).
This underlines what was mentioned above about the correlated relationship between GDP and seaborne activity. In fact, even though there is and has been a clear relationship between global economic growth and dry bulk trades it is important to remember that national economic size does not necessarily say very much about a countries direct importance for dry bulk demand (IMF, Global Economic outlook, 2004 and Clarkson Research Studies). Indirectly, however, through the consumption of finished goods there will be an effect.
Together with the overall effects from global growth, structural development in various areas of the world has a direct influence on the flow of commodities and has seaborne commodity trades. It is, for example positive for dry bulk trades that economy, such as China and Japan, with none or at least insufficient natural resources build up steel and manufacturing industrials.
This initiates seaborne trade in two ways. First, through imports of raw materials to the manufacturing areas and further more it usually also generates trades for finished products to the consuming areas (Mikkelson and Tronstad 2006). The sailing distance or average hauls (AH), influence the time at sea which is positively correlated with the demand for seaborne transport. The development of iron is exploration in Brazil in combination with increased steel production in China has had a very positive influence on the average haul for capsize vessels (120-200,000 dwt). For instance, the average haul with iron ore from Brazil to China is more than twice as long (about 22 days) compared with the average haul from the iron ore parts in the Northern part of Australia (about 10days). This means that the demand for dry bulk transportation will be twice as high for the former compared with the latter for each additional ton of iron are shipped (Stopford, 1988; 1997).
<
Political events have always been an importance factor for dry bulk demands. The closing of the Suez Canal during the Yom Kippur war in the early 1970s is perhaps the event that has had the largest effect on the seaborne trading market. Due to the closure of the canal vessels that normally sailed through the canal were forced to sail around Africa, which in effect multiplied the average haul/or sailing distance (Eriksen, 1982). The political evolution of the world impacts the transportation sector as well. The emergence of free trade zones together with the opening of new markets due to political changes and the resulting globalization of the economy have tremendous consequences for the evolution of transportation systems, not all of which are yet apparent or well understood. For example, open borders generally mean that firms are no longer under obligation to maintain a major distribution center in each country. In consequence, distribution systems are reorganized around fewer but bigger warehouses and transportation services are operated over longer distances (Crainic and Laporte, 1997).
The last major factor is the transport cost. In this research, transport costs are defined as the costs incurred in moving freight, that is, in a broader sense, transport costs could also include any number of costs that impede trade such as policy-induced trade barriers, for example, cultural or sociological barriers (Brakman, Garretsen and Marrewijk, 2001). These freight costs consist of direct and indirect elements. Direct elements include freight charges and insurance on the freight, whereas indirect elements include all costs incurred by the transport operator. Indirect elements vary with the shipment’s characteristics. For example, holding costs for the products in transit, inventory costs (in the case of late deliveries) and costs incurred during preparation for transit (which depends on the shipment size) (Anderson and Wincoop, 2003). A number of authors have recently investigated the determinants of transport costs from an empirical point of view (Limao and Venables, 2001; Mico and Pérez,
2002; Clark, Dollar and Mico, 2004; Egger, 2004; Combes and Lafourcade, 2005; Martinez-Zarzoso and Suárez- Burguet, 2005). All these studies show that geographic conditions, the type of product transported, economies of scale, energy prices, trade imbalances, infrastructures, transport mode, competition and regulations are among the most important factors explaining the variation in transport costs across countries. An important finding of these studies is that a 10 percent reduction in transport costs increases trade volumes by more than 20 percent. However, the difficulties involved in measuring and inferring the value of transport costs, together with their high variability across goods, countries, and regions, calls for further investigation.
For most seaborne trade commodities, transport cost have been relatively marginal compared with the value of the cargo that is shipped but in period of high freight rates, such as during the very high market seen in 2004 and 2005, it is sometimes less costly to purchase relatively more expensive seaborne commodities, from nearby suppliers. High transport costs elevate the cost of producing manufactures by increasing the price of imported intermediate and capital goods. These elevated production costs, together with high transport costs, impede the price competitiveness of manufactured exports (Radelet and Sachs, 1998; Hoffmann, 2002). Limão and Venables (2001) find that landlocked developing countries tend to have higher transport costs (approximately 50 percent) and lower trade volumes (around 60 percent) than coastal countries. Clark et al. (2004) find that transport costs are a significant determinant of bilateral trade between Latin America and the USA, and that port efficiency is an important determinant of international shipping costs (improving port efficiency from the 25th to the 75th percentile can reduce shipping costs by up to 12 percent).
Transport cost contributes significantly to shaping the volume, structure and patterns of seaborne trade as well as countries comparative advantages and trade competitiveness. Therefore, during times of very high or low freight rates it is not unusual to see some changes in “normal” trading patterns, which again could influence average hauls (Stopford, 1988; Mikkelson et al, 2006). Transport costs have in recent years been recognized to have important and significant impacts on seaborne trade patterns and globalised production (Hoffmann, 2002). Limăo and Venables (2001) state that transport and other costs of conducting business on an international level are key determinants of a country’s ability to participate fully in the world economy, and especially to grow exports. For countries located far from markets, the effect of transport costs on seaborne trade is more severe. Distance is an important part of international seaborne trade relations and the impact of distance on transport costs has been widely documented. As distance increases, seaborne trade volumes decrease (Venables, 2001). Countries tend to trade with proximate partners (Grossman, cited in Anon., 2004) even if transport costs over distance have fallen (Hummels, 1999a). Approximately half of the world’s seaborne trade takes place between countries located within 3,000 km of each other (Anon., 2004). The distance of seaborne trade for the average countries in the world has decreased, implying that distance matters (Carrere and Schiff, 2004). Limão and Venables (2002) demonstrate that exports and imports of both final and intermediate goods carry transport costs that increase with distance. If a country is situated far from its trading partners, its Cost, Insurance and Freight / Free On Board ratiois higher than a country located close to its foreign markets. For example, Australia’s Cost, Insurance and Freight / Free On Board ratio is 10.3, whereas Switzerland in Europe has a ratio of only 1.7 (Radelet and Sachs, 1998). Busse (2003) illustrates this point through another example. The cost to ship a 40-foot container from Baltimore to China is around $13 000, whereas the cost to Rotterdam is only $2 000 (he follows the same method as Limão and Venables (2001) only with 2002 data). Venables (2005) argues that remoteness from economic activity increases transport costs and accounts for the poor export performance of many developing countries situated far from the major markets. Porto (2005) finds that for low-income countries, transport costs are amongst the most important of trade barriers. Higher transport costs are of more relevance for bulk cargo. To minimize the incidence of transport cost on low value/ high volume goods, importers of bulk cargo are mere likely to source from nearby providers (Farlex Free Library, 2008).
The demand for dry bulk carrier capacity is determined by the underlying demand for commodities transported in dry bulk carriers, which in turn is influenced by trends in the global economy. Seaborne dry bulk trades increased by slightly more than 2 percent on an average annual basis during the 1980s and 1990s. However, this rate of growth has increased dramatically in recent years, as seen in table 2.2, between 1999 and 2006, trade in all dry bulk commodities increased from 2.0 billion tons to 2.5 billion tons, an increase of 35 percent overall (Klovland and Prescott, 1996). <
Table 2.2: Seaborne Dry Bulk Imports, (% and million tons) 1999 2004 E 2004-1990 MT % MT % MT % Share of Growth % JAPAN 510 32% 559 24% 49 -8% 7% CHINA 64 4% 396 17% 332 13% 45% OTH ASIA 239 15% 489 21% 250 6% 34% W. EUROPE 542 34% 583 25% 40 -9% 5% USA 64 4% 163 7% 99 3% 14% FSU/E.EUR 144 9% 70 3% (74) -6% -10% L.AMERICA 16 1% 47 2% 31 1% 4% AFRICA 16 1% 23 1% 7 0% 1% Total 1595 100% 2330 100% 735 100%
Source: Clarkson Research Studies (2004).
Generally, growth in gross domestic product and industrial production correlates with peaks in demand for seaborne transportation. Certain economies will act from time to time as the "primary driver" of the dry bulk carrier market. In the 1990s, Japan acted as the primary driver due to increased demand for seaborne trade and growth in Japanese industrial production. China has been the main driving force behind the recent increase in seaborne dry bulk trades and the demand for dry bulk carriers. Between 1999 and 2004, ton-mile demand in the dry bulk sector increased by a total of 25 percent to 11.5 billion ton-miles. Dry bulk carriers can be the most versatile element of the global shipping fleets in terms of employment alternatives. However, dry bulk carriers seldom operate on round-trip voyages. Rather, the norm is port-to-port liner service and triangular or multi-leg voyages. This means that every voyage has a ballast leg that must be paid for by the laden or revenue earning leg (Genco shipping reports, 2006).
According to the Fearnresearch (2004) the worldwide dry bulk carrier fleet subdivides into four vessel size categories, which are based on cargo carrying capacity, they include;
1. Capesize-vessels over 80,000 dwt. While this is the traditional definition of a Cape size bulk carrier, in terms of deadweight, the sector is changing. As per the order book detailed below, there have been a number of new super-Panamaxes ordered, which are 82,000 dwt to 85,000 dwt, but which are able to transit the Panama Canal with a full cargo. Thus, a more modern definition of Capesize would be based on vessels over 100,000 dwt. The Capesize sector is focused on long haul iron ore and coal trade routes. Due to the size of the vessels there are only a comparatively small number of ports around the world with the infrastructure to accommodate them.
2. Panamax-vessels between 60,000 dwt and 80,000 dwt. Panamax vessels, defined as those with the maximum beam (width) of 32.2 metres permitted to transit the Panama Canal, carry coal, grain and, to a lesser extent, minor bulks, including steel products, forest products and fertilizers.
3. Handymax-vessels between 30,000 dwt and 60,000 dwt. The Handymax sector operates in a large number of geographically dispersed global trades, mainly carrying grains and minor bulks including steel products, forest products and fertilizers. Vessels less than 60,000 dwt are built with on-board cranes that enable them to load and discharge cargo in countries and ports with limited infrastructure.
4. Handysize vessels up to 30,000 dwt, which carry exclusively minor bulk cargoes. Historically, the Handysize dry bulk carrier sector was seen as the most versatile. Increasingly, however, this has become more of a regional trading, niche sector. The vessels are well suited for small ports with length and draft restrictions and also lacking infrastructure.
Key elements influencing the supply of dry bulk carriers are vessel deliveries and the loss of existing vessels through scrapping or other circumstances requiring removal. A comparison of vessels in each category reveals that Capesize vessels have the largest percentage of current fleet on order when compared to the Panamax, Handymax and Handysize categories (Genco Shipping Report, 2006).
<
The chattering of vessels for the specified period of time or to carry a specific cargo is an integral part of the market for seaborne transportation of dry bulks. The charter market is highly competitive. Competition is based primarily on the
offered charter rate, the location, sea route, technical speciation and quality of the vessel and the reputation of the vessels manager. Typically, the charter party agreements are based standard industry terms, which are used to streamline the negotiation and documentation processes (UNCTAD (UN), Review of Maritime Transport, 2005). Winter (1952) in his book ‘Marine Insurance; Its principles and practice gave two purposes for which vessel are chartered at demand; first, the charter may be engaged in a specific line of trade shore vessel. Space in large quantity is needed, as in the shipment of bulk cargoes such as grain or coal of bale or bagged goods, such as cotton, coffee, or sugar. For these cargoes the merchant could not rely on obtaining sufficient space on liners, and so, through vessels brokers who space on liners, and so, through vessel broker who are in touch with the freight market of the world, he will engage one more entire ship on a basis of payment of much a day (time charter), so much a voyage (voyage charter) or so much a unit of cargo carried (commodity/voyage charter). The second, general reason for chartering a vessel is the necessity of additional tonnage for a line operating vessels over definite sea route.
Shipping route reflect world trade flow. According to Wikipedia Report on trade route; trade route is a logistical network identified as a series of pathways and stoppages used for the commercial transport of cargo. Sailing is most numerous and most frequent on routes where trade volumes are larges and demand is therefore greatest. In liner trades to and from the UK, the besides routes are to the Far East (especially China and Japan), Passing through the Mediterranean, the Suez Canal and the Malacca straits. The North Atlantic route, linking Western Europe and the USA and Canada, is also busy and there are well-established routes to the Middle East, India, Australia and New Zealand, Central and South America, as well as East, south and West Africa. In dry bulk trades route reflect the places of origin and consumption of the commodities carried. For example, many of the main iron ore route being from Tubarao (Brazil) and West Australia and end in developed countries were demand for iron ore is greatest.
2.1.1 NIGERIA’S REVIEW OF SEABORNE TRADE.
Both Ndikom, (2006) and Oladakun,(2009) viewed seaborne as a mode of transport, that has continued to represent the cheapest and most efficient means of moving very large volume of import and export trade goods in the Nigerian international trade. In Nigeria, the seaborne sector has been responsible for facilitating over 90 percent of trading prospects. Nigeria accounts for over 60 percent of total seaborne traffic in volume and value in the West African sub-region with a GDP accounting for over 60 percent of total GDP of 16 countries that make up the Economic Community of West African States (ECOWAS). The success or otherwise of the Nigeria seaborne trading sector therefore has a reverberating impact on the sub-region (Airahuobhor, 2010).
Although, the Nigerian seaborne trade relations were built among the traditional agricultural and mining products of cocoa, palm produce, groundnuts, rubber, cotton, hides and skins, tin, coal and columbite among others. But with the discovery of oil our recipients were given a greater boost and very rapidly oil receipt dominated foreign exchange earnings by accounting for over 98 percent by 1996. That for several years after independence, the emergence of oil prosperity, in the country denied any serious attention to be paid to the prospects of non-oil exports trade, until the Structural Adjustment Programme (SAP) by the government in 1968.
Okoh (2004) in his report on Global integration and the growth of Nigerians Non-oil export describe exporting as the process of earning profits by selling products or services in foreign markets. He further gave the concepts of exportation; he said “Exportation must be based on the principles of local sufficiency”. This connotes that a country that will engage in any export trade mission, should therefore as the case must be, has such a product in large quantities and it must be easily available in reasonable sufficiency. As a resource-rich country, Nigeria’s economic performance has been unfortunately driven by only the oil and gas sector to the extent that even progress recorded towards geniue economic development prior to the discovering of oil in commercial quantity has been virtually eroded.
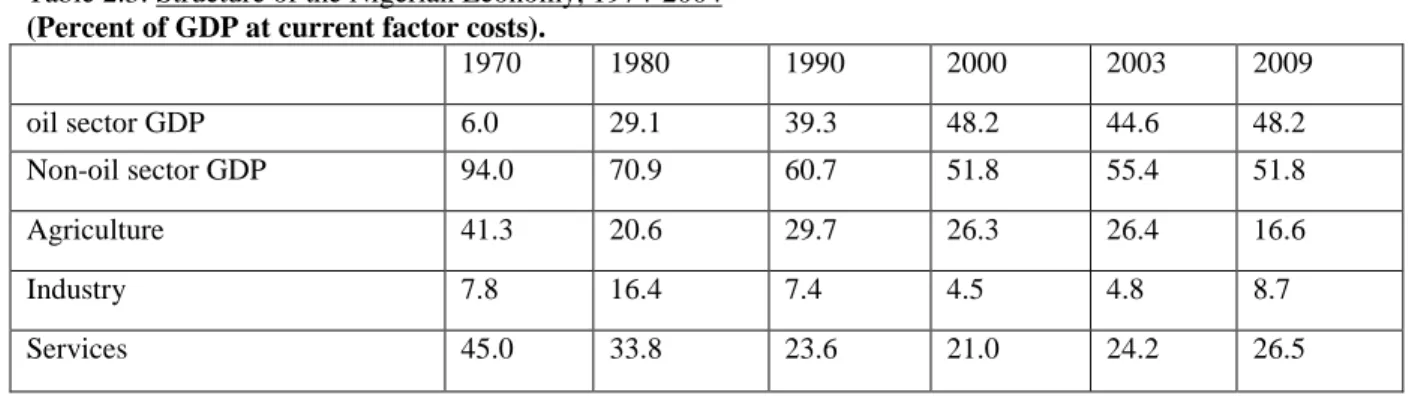
In recent time between 2000 and 2005, the GDP growth was about 5.7 percent and the growth in the non-oil sector which contributed about 5.9 percent of the GDP. The declined in the agricultural sector performance has been dramatic since the discovering of oil. The manufacturing sector has not performed even better; a few statistics illustrate the poor performance of the non-oil sector. The share of non-oil sector decreased from about 94 percent in 1970 to about 52 percent in 2004. The decrease affected all the sectors (Agriculture, Industry and Services) but in different magnitude. Agriculture GDP declined from about 41 percent to about 17 percent over the same period, as seen in table 2.3.
Table 2.3: Structure of the Nigerian Economy, 1974-2004
(Percent of GDP at current factor costs).
1970 1980 1990 2000 2003 2009 oil sector GDP 6.0 29.1 39.3 48.2 44.6 48.2 Non-oil sector GDP 94.0 70.9 60.7 51.8 55.4 51.8 Agriculture 41.3 20.6 29.7 26.3 26.4 16.6 Industry 7.8 16.4 7.4 4.5 4.8 8.7 Services 45.0 33.8 23.6 21.0 24.2 26.5
Source, World Bank (2007)
From the table 2.3 above Nigeria’s non-oil sector is inefficiently serving the domestic market as non-oil export is negligible.
According to the Direction of Trade Statistics IMF year book (2007), Nigerian’s seaborne trade with G-15 countries was 11.2 percent of its global trade. Its biggest trading partner was Brazil with an import of 45.7 percent, and with 65.8 percent of export. Merchandise exports to Brazil have risen impressively while exports to India have slumped since 2004. Between 2000-2006 Nigeria’s exports to G-15 countries as a percentage of its global exports halved from 22.4 percent to 11.1 percent, while between the same periods, Nigeria’s imports global imports increased from 8.6 percent to 11.3 percent.
Also, based on data from Nigerian Investment Promotion Commission (2006), available information points to a general upward trend in the inflow of Foreign Direct Investment (FDI) from China to Nigeria presents a global picture of FDI inflow to Nigeria from different region and China from 1999 to 2006. All the regions showed significant increase in FDI inflow from the 1999 level. Thus, the upward increase in the aggregate FDI inflows to Nigeria from about $190.61 million in 1999 to about $4169.14 million in 2006 is a joint increase in the levels of FDI by all the regions.
2.2 MODELS, PARADIGMS OR THEORIES RELEVANT TO THE RESEARCH PROBLEMS.
A great number of mathematical, heuristics, fuzzy logic, and econometric models have appeared in recent years. A great number of these models have gained usefulness in modeling demand in the shipping sector.
The demand for transport is a derived demand, which is dependent upon the nature of goods traffic in seaborne trade. If the demand for a commodity is more, the relative nature of that goods traffic becomes more (Stopford, 1997; 2009). The extent to which increase in dry bulk trade have affected demand for dry bulk carriers is reflected in estimates of ton-mile demand. Ton-mile demand is calculated by multiplying the volume of cargo moved on each route by the distance of the voyage. Hence, trade distances assume greater importance in the demand equation (Genco Shipping Report, 2006).
The demand for sea transport can be defined by the equation below. DDt = F(CTt., AHt)--- Equ. 2.2.1 DDtk = CttK AHt ---Equ. 2.2.2 DDtk = ∑ (Atkm DDtk) ---Equ. 2.2.3 Atkm = D Dtkm ---Equ. 2.2.4 DDtk
Where DD = Demand for seaborne transport (ton- miles). CT = Tons of cargo transported in time period (in tons). AH = Average haul of cargo (in miles).
T = Year subscripts.
A = market share of ship type (m). K= commodity (e.g. Iron ore, etc). M =ship types (say, dry bulk carries).
Demand measure in ton miles of transport requires is determined by the tonnage of cargo to be moved and the average haul over which each ton of cargo is transported as seen in equation 2.2.1.
Moving on to equation 2.2.2, the volume of ship demand generated by each commodity, k, and measured in ton miles is the product of the tonnage cargo of each commodity and its average haul. At this stage, demand is expressed in terms of the total ton miles of demand by ship type, m. This is done in equation 2.2.3, which shows that the demand for ship type m is defined as the market share of that ship type in each commodity trade, summed over all commodities. This is a simple relationship to write in algebraic terms, but is much more difficult to define in practice. In reality trade will be carried in whatever ships are available, which depend on what ship owners order, so analyzing investment trends may be the answer (Stopford, 1997; 2009).
Each ship operator develops his own rates usually without consultation with the shipper. The operator’s charges reflect the cost of providing the carriage, the value of this service of the owner of the goods, the ability of the merchandise to support the expense of transportation demand and economic conditions in general. To a noticeable extent, seaborne trade freight rates are the result of the working of the law of demand and supply of transport which may be influenced by port charges by ship owners, cargo allocation by reputable government body must be regulated equally by principles of justice, due process and fair play so that meaningful control could be applied and maintained.
Makkar(2007) defines the market as the interaction of supply and demand, and both together determine the equilibrium freight rate and quantities sold at that rate. Figure 2.1, below shows different possible short run market equilibrium, each determined by different demand conditions. The key factors that make demand conditions alter relate to the volume of world trade, which is driven by overall economic activity, and changing degrees of openness towards trade by individual nations. Demand curves further to the right represent larger trade volumes.
,,,
Figure 2.1 Short Run Market Interactions.
Source: Institute of Chartered Shipbrokers Column (2008)
Demand volumes increase from D1 to D4. Between D1 to D3 there is a relatively small rise in the market freight rate and a large rise in ton miles produced. But between D3 and D4, the increase in demand is translated into large increases in rates, because supply becomes very inelastic, and the scope for increases in supply becomes increasingly limited. The above model can be used to examine short run fluctuations in market conditions, but not long run ones. This is because the supply schedule represented in Figure 2.1 is drawn for a given stock of ships. However it is a useful framework to explore fluctuations in freight rates in the short term.
Still considering the shift in demand from D3 to D4. It will be observe that rates will move up very sharply, and supply not increasing much. This creates large profits for existing ship owners, who will be encouraged to demand for new vessels. The value of existing vessels will also rise, reflecting the markets’ expectation that profits are going to be healthy in the future. The increased number of demands will translate into a rightward shift in the supply curve in the long term, and this will lead, to a fall in rates if demand remains at D4. On the other hand, a fall in demand from D2 to D1 means a fall in supply and a rise in vessel lay-ups. Remember that in the short run, some vessels will be trading at rates which do not cover their full costs. While this is acceptable in the short term, it is not the case in the longer term. Some vessels will be laid up, or scrapped. The scrapping of vessels leads to a leftwards shift of the supply curve. This process will help raise rates if the supply shifts far enough. As with most other markets, the price (freight rate in dry bulk shipping) is determined by supply and demand. The supply side is a function of the fleet (new deliveries, scrapping, lay-ups, productive life), the fleet productivity (efficiently in ports congestion), efficiently at sea (vessel
Ton Miles/Year
Freight Rate
$/ton mile
F1
F2
F3
Maximum OutputF4
D1
D2
D3
D4
Q1
Q2 Q3
speed, ballasting, canal closures etc), and the freight rates. The sum of these elements makes up the hockey stick shaped supply curve shown in figure 2.2 below. The demand side for ship transportation is as mentioned a function of the global economic business cycle; the average haul, political events and transportation costs (Makkar, 2008).
Demand & Supply Model
Scrapping Supply - Tonnage Freight Rate $/tonne F1 F2 F3 F4 D1 D2 D3 D4 Q1 Q2 Q3 Increase in Freight rates for same demand levelsFigure 2.2 Demands and Supply versus Freight Rates Source: Institute of Chartered Shipbrokers Column (2008).
In figure 2.2, above illustrates a very simplified supply and demand model for seaborne transportation. It is a short term model; it gives a fair reflection of the dynamics in the seaborne market for transportation. In the model the maximum capacity of the fleet (the supply side) is fixed, as shown by the vertical dotted line. When freight rates fall below a certain level due to lower demand, the productivity of the fleets starts declining. First of all this takes effect through slow steaming. Later if the market falls below running costs of a ship some vessels are placed in lay-up with increased demand, freight rate eventually rise. It is a long term, new vessels are delivered, the infrastructure in the ports is improved relaxing possible congestion new trades are developed and the supply curve shifts to the right. Eventually the market finds a new equilibrium, which is to the left of full capacity in the simplified model (Mikkelson and Tronstad 2006).
<
In figure 2.3 below, shows that an increase in tonnage entering the market increases the elasticity of supply, as shown by the dotted curved line on the diagram. This means that more ships are available for a given demand and come into service to cater for this demand. The supply curve shifts to the right.
The effect is a fall in the freight rates for the same demand. Unless the demand level increases (either in absolute terms or by virtue of change in trading patterns i.e. increase in ton-miles), the induction of new ships will depress the market. (Makkar, 2008).
Demand & Supply Model
Increased Supply Freight Rate $/tonne mile F1 F2 F3 F4 D1 D2 D3 D4 Q1 Q2 Q3 Fall in Freight rates for same demand levelsSupply - Tonnage
Source: Institute of Chartered Shipbrokers Column (2008)
Figure 2.4 further views an increased supply condition, a rush for ordering new ships in a good market results in heavy new deliveries in the near future and an inevitable crash unless of course demand keeps up with this increased supply. Recall early 80’s, late 90’s and 2001!
When the freight market is good, a perception (an illusion in most cases) that it is going to last forever injects optimism in the minds of bankers and investors (recently the IPOs with tons of retail investor funds).
Demand & Supply Model
Further Increased SupplyFreight Rate $/tonne mile F1 F2 F3 F4 D1 D2 D3 D4 Q1 Q2 Q3 Supply - Tonnage
Almost Free Fall of Freight rates for same demand levels
Figure 2.4 Deliveries versus Freight Rate.
Source: Institute of Chartered Shipbrokers Column (2008)
The researcher further compares with an adjacent table taken from “Shipping Economics” by Stopford (2001) to explain the trends. It was observed that interaction of the supply and demand produces the resultant called the “market tone”. It was also observed that during the period when the demand tendency was fast, the market tone was either competitive or weak because of expanding or over capacity in the supply, as seen in fig. 2.5.
Period Demand Tendency Supply Tendency Market Tone
1869-1914 Fast Expanding Competitive 1920-1930 Fast Over-capacity Weak 1930-1939 Falling Over-capacity Depressed 1945-1956 Very Fast Shortage Prosperous 1956-1973 Very Fast Expanding Competitive 1973-1989 Falling Over-capacity Depressed 1988-2000 Slow Expanding Competitive Source, Stopford (2001).
Figure 2.5 Shipping fundamental trends
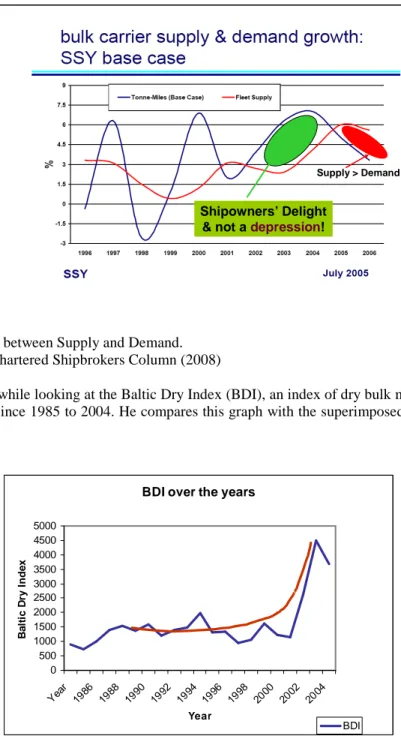
To summarize the ‘Shipping Markets’ the researcher, gave a further looked at the graph adapted from Clarkson Research Studies (2002). As foreseen then, the market experienced a boom most of the times when the new deliveries fell below 3 percent of the total fleet. For bulkers, this percentage was 2 percent for the year 2003. Also 2003 to early 2005, coupled with a surge of demand from China and resulting multiplying impact of port congestion.
The adjacent graph in figure 2.6 further shows the interaction between Supply and Demand. The graph shows some offset (out of phase) between the changeover (intersects) and the actual boom points. The future projection, showing that vessel supply will be greater than demand is only an opinion and not a statement of fact!
Shipowners’ Delight & not a depression!
Supply > Demand
Figure 2.6 Interactions between Supply and Demand. , Source: Institute of Chartered Shipbrokers Column (2008)
Finally, the researcher while looking at the Baltic Dry Index (BDI), an index of dry bulk market, he observed how it has moved over the years since 1985 to 2004. He compares this graph with the superimposed curved line, as shown below in fig.2.7.
Figure 2.8 Index of Baltic Dry Bulk Market.
Source: Institute of Chartered Shipbrokers Column (2008)
The effect is a fall in the freight rates for the same demand. Unless the demand level increases (either in absolute terms or by virtue of change in trading patterns i.e. increase in ton-miles), the induction of new ships will depress the market. Transportation demand modeling is complicated by a number of characteristics that are central to the logistics and transport industry. Small and Winston (1998) highlight some of these characteristics. These include;
I. The interrelated decision of transportation.
II. The large number of distinct services differentiated by location or time (spatial and temporal aspect), and III. The shipper’s sensitivity to service quality (quality indicators include frequency, route coverage, reliability
and comfort.
Empirical evaluation of these characteristics motivates many transportation demand research. In particular, demand researches have based work on the mixed continuous discrete decision of shippers (mode, route, location, and quantity)
BDI over the years
0 500 1000 1500 2000 2500 3000 3500 4000 4500 5000 Yea r 1986 1988 1990 1992 1994 1996 1998 2000 2002 2004 Year B a lt ic D ry I n d e x BDI
to evaluate relative import of factors important to choosing transportation model. Often there is a focus on role of reliability and travel time in shipper’s decisions and / or output price changes on the firm’s decision (McCarty, 2001). Despite the skepticism regarding the practical importance of the optimal tariff argument, it continues to feature prominently in the leading theoretical trade policy models. Grossman and Helpman (1995) extend their endogenous trade policy model to the case where a country is “large”, i.e. it faces finite export supply elasticities. Although not stressed in their paper, there would be no motive for trade talks in their model in the absence of a terms-of-trade use of the tariff. This is a key point made by Bagwell and Staiger (1999) who provide an economic theory of the General Agreement on Trade and Tariffs (GATT). In this and in subsequent work, Bagwell and Staiger have strongly argued that the use of tariffs to explore the terms-of-trade effect can explain many of the key features of the current multilateral trading system. Their work has been quite influential despite the fact that there is no direct evidence that countries use, or indeed possess, market power in trade prior to entering into reciprocal liberalization in the GATT or its successor, the WTO.
The theory that a country might gain from protection has a long history (Irwin, 1996). The intuition for why countries might gain from tariffs through an improvement in their terms-of-trade stems from two key insights. The first, from Torrens (1833) and Mill (1844) is that there are many possible prices at which countries would be willing to trade. The imposition of a tariff creates a welfare loss due to consumption and production distortions, but it can also produce a gain if foreign suppliers reduce their prices in order to maintain market access. If the losses due to the domestic distortion are less than the gains from the price or terms-of-trade effect, a country can gain from a tariff. Edgeworth (1894) provided the key insight regarding when a country should impose a tariff. He showed that as long as a foreign country’s offer curve was not perfectly elastic, a country could gain from a tariff. In this case, the reduction in import demand caused by a tariff leads to a reduction in the price of all units imported and this first order gain offsets the distortion losses from lower imports.
<
Bickerdike (1907) extended Edgeworth’s framework and developed the formula relating the welfare maximizing tariff and the inverse of the export supply elasticity. Although Bickerdike framed his derivation with one import good and a welfare maximizing government, the basic insight that a country’s “optimal” tariff is increasing in its market power applies to more general settings and does not require governments to maximize welfare. (Broda; Limão; Weinstein (2006)).
Finally, the researcher deems it obligatory to examine the relationship between the theory of “balance of trade” and “term of trade”. Balance of trade is the relationship between the total volume of export and import of a country for a certain period of time. When the balance of trade is surplus by the export, then its favorable otherwise deficit (Branch, 2000).
Balance of Trade = Total Export – Total Import
Term of Trade (TOT) is defined to as the quality of domestic goods that must be given up to get a unit of imported goods. They refer to the opportunity cost of obtaining goods through seaborne trade than producing them directly.
The measurement of terms of trade is given as;
TOT index = Index of export trade x 100% Index of import trade
In regard to the relationship between the both theories, terms of trade and balance of trade, an improvement in the former will lead to favorable result of the latter only if the demand for import and export is relatively inclusive. If the demand is elastic, then the balance of the trade will be less favorable or even worse. A device in the term of trade does not imply an unfavorable balance of trade. If the demand for more import and export is relatively elastic, then a device in the term of trade will cause demand to rise.
2.3 CURRENT LITERATURE BASED ON EACH OF THE RELEVANT VARIABLES OF THE MODELS
AND THEORIES.
There is more seaborne trade in dry bulk commodity along the sea route of Asian region, than in anywhere else. This is true, since Japan and South Korea, China must import large share of the raw materials needed in the industrial production (IP) (Clarkson Research Studies, 2004). This development in Asia is expected to continue and Asia’s direct impact on seaborne demand will probably grow further. Whether one measures trade by how much of a goods is moved (volume), by it value or by the carrying capacity needed to move it. All measures are important and for different reason. Stopford (2009) in his recent edition of Maritime Economics, he divided the world seaborne trade by the Parcel Size
Distribution function. Bulk cargo (big parcels) of over 2-3000 tons and general cargo (small parcels) of under 2-3000 tons.
Volumes of dry bulk trade provide insights about whether the infrastructure is adequate to accommodate the required flow. Value allows governments and economists to access patterns of international trade and balance of trade and balance of payments carrying capacity allows the shipping industry to access how many dry bulk vessels are required and on what route. Hence, dry bulk commodity must be moved from regions where supply is greater than demand exporting regions to regions where demand is greater than supply importing regions. They ‘‘have/ have not’’ balance results in dry bulk flows from one international region to another, from one country to another, and from one region within a country to another. This flows dictated by economics logistics (fleets of ship) and temporary in balance in supply and demand are central to the efficient operation of the dry bulk market (Fearnresearch, 2004).
The Baltic Dry Index, the main measure of seaborne costs for commodities, will extend a 46 percent rally over the past month driven by Chinese demand for iron ore and grains, China Ocean Shipping (Group) Co. said.
“The rebound may be bumpy, but in the final quarter the index should be much higher,” said Kong Fanhua, a Beijing-based senior researcher at the owner of the world’s largest operator of dry-bulk ships. Kong, who declined to give a forecast in figures, correctly called a rebound in the index last September, 2009. The Baltic Dry’s rally has come even as signs mount that the global recovery may be sputtering, including economic growth data from Japan. The index may surge to more than 4,000 points by the end of the 2010, a gain of at least 61 percent, according to Hanjin Shipping Co., South Korea’s largest shipping company.
China is “not collapsing but growing at a healthier pace,” said Chi Myunghwa, head of the bulk-planning team’s research division at Hanjin Shipping. “China is restocking iron ores and coal again as it braces for the winter season, while droughts and floods across the globe are aggravating a shortage of grains, resulting in greater trade.” Hanjin Shipping’s Chi said it may average 3,500 points this year compared with 2,617 points in 2009. “The outlook for bulk- shipping demand is very promising,” (Kyoungwha, 2010).
The international dry bulk shipping industry is highly fragmented and is divided among state controlled and independent dry bulk vessel owners. As a general principle, the smaller the cargo-carrying capacity of a dry bulk vessel, the more fragmented is its market, both with regard to charterers and vessel owners/operators.
There remains significant potential for industry consolidation within each vessel type, especially in the Handysize, Handymax and Panamax sectors in which we currently operate. Charter market dry bulk carriers are employed in the market via a number of different chartering options. The general terms typically found in these types of contracts are described brief below.
A "bareboat charter" involves the use of a vessel usually over longer periods of time ranging over several years. In this case all voyage related costs, including vessel fuel and port dues as well as all vessel-operating expenses such as day-to-day operations, maintenance, crewing and insurance, transfer to the charterer's account. The owner of the vessel receives monthly charter hire payments on a per-day basis and is responsible only for the payment of capital costs related to the vessel.
A "time charter" involves the use of the vessel, either for a number of months or years or for a trip between specific delivery and redelivery positions, known as a trip charter. The charterer pays all voyage-related costs. The owner of the vessel receives semi-monthly charter hire payments on a per-day basis and is responsible for the payment of all vessel operating expenses and capital costs of the vessel.
<<
A "voyage charter" or "spot charter" involves the carriage of a specific amount and type of cargo on a load-port to discharge-port basis, subject to various cargoes handling terms. Most of these charters are of a single voyage nature, as trading patterns do not encourage round voyage trading. The owner of the vessel receives one payment derived by multiplying the tons of cargo loaded on board times the agreed upon freight rate expressed on a per-ton basis. The owner