DigitalCommons@University of Nebraska - Lincoln
DigitalCommons@University of Nebraska - Lincoln
Journal of the National Collegiate HonorsCouncil --Online Archive National Collegiate Honors Council
Spring 2019
Creating a Profile of an Honors Student: A Comparison of Honors
Creating a Profile of an Honors Student: A Comparison of Honors
and Non-Honors Students at Public Research Universities in the
and Non-Honors Students at Public Research Universities in the
United States
United States
Andrew J. Cognard-Black
St. Mary’s College of Maryland, ajcognardblack@smcm.edu
Art L. Spisak
University of Iowa, art-spisak@uiowa.edu
Follow this and additional works at: https://digitalcommons.unl.edu/nchcjournal
Part of the Curriculum and Instruction Commons, Educational Methods Commons, Higher Education Commons, Higher Education Administration Commons, and the Liberal Studies Commons
Cognard-Black, Andrew J. and Spisak, Art L., "Creating a Profile of an Honors Student: A Comparison of Honors and Non-Honors Students at Public Research Universities in the United States" (2019). Journal of the National Collegiate Honors Council --Online Archive. 623.
https://digitalcommons.unl.edu/nchcjournal/623
This Article is brought to you for free and open access by the National Collegiate Honors Council at
DigitalCommons@University of Nebraska - Lincoln. It has been accepted for inclusion in Journal of the National Collegiate Honors Council --Online Archive by an authorized administrator of DigitalCommons@University of Nebraska - Lincoln.
Creating a Profile of an Honors Student:
A Comparison of Honors and Non-Honors Students
at Public Research Universities in the United States
Andrew J . Cognard-Black
St . Mary’s College of Maryland
Art L . Spisak
University of Iowa
Abstract: This study uses data from the 2018 Student Experience in the Research University (SERU) Survey of undergraduate degree-seeking students to develop
a profile of an honors student . Nineteen research universities participated in the 2018 SERU Survey, with a resulting sample size of almost 119,000 undergraduate students, of whom 15,280 reported participation in or completion of an honors program . No other study has surveyed honors students on such a scale and across so many institutions . This study could be useful for recruiting since it would give recruiters a better idea of what to look for that would make prospects successful in an honors program/college . Knowing what high-ability students expect from their education could also be useful in structuring an honors curriculum and experience accordingly . Finally, knowing better the wants and needs of high-ability students could be useful for advising, mentoring, and counseling honors students .
Keywords: characteristics of honors students, honors student profile, identifying
honors students, diversity in honors students
background
Student Experience in the Research University Survey
Initiated by sociologist Richard Flacks, Student Experience in the Research
research universities around the country . In 2018, SERU surveyed students at 19 universities and collected data on roughly 119,000 undergraduates, including about 15,200 students reporting participation in or completion of an honors program . The survey data include measures of standardized college admissions test scores, both high school GPA and cumulative undergraduate GPA, undergraduate major, and an extensive variety of experiences such as frequency of engaging in class discussions and participation in undergraduate research . The survey also includes an indicator of honors program participa-tion, but, to date, little has been done to exploit the potential of SERU data for comparison of honors and non-honors students .
The SERU Survey began in the early 2000s at the University of Cali-fornia-Berkeley’s Center for Studies in Higher Education (CSHE) under the aegis of the University of California Undergraduate Experience Survey (UCUES) . The survey was originally limited to nine University of California undergraduate campuses . In 2008, however, the project expanded to include a consortium of other research-intensive universities (R1s: Research Univer-sities/Very High Research Activity Carnegie classification) and designated international campuses . While still known within the University of California system as UCUES, the survey project is now better known as SERU . The proj-ect uses an online census survey methodology of undergraduate students at top-tier research intensive universities to gather student-level data . A survey of graduate students was later added . The Consortium’s goal is for institutions to be able to use these data for better management and improvement . More specifically, it seeks to provide member institutions guidance on:
1 . understanding who their students are—their familial, academic, cul-tural, ethnic background as well as their self-identity, and career and other goals;
2 . disaggregating the student experience—providing sufficient data that allows for analysis at the academic discipline and program level and among various sub-populations; and
3 . translating what is learned into policy—using the data to identify strengths and weaknesses of academic programs and other components of the student experience that are then integrated into policymaking . (Berkeley Center for Studies in Higher Education, 2019)
As of 2018, in addition to the nine University of California members, six-teen other North American universities were listed as Consortium members, and there were twelve international SERU-I university members (Berkeley
Center for Studies in Higher Education, 2019) . The SERU Survey generally is administered annually although not all members of the consortium par-ticipate each year . In 2018, nineteen consortium universities took part in the survey: the nine campuses of the University of California system and ten large public universities, all with the R1 Carnegie Commission classification . The total sample size was 118,852 undergraduate students, with 15,280 stu-dents reporting current participation in or completion of an honors program . Detail regarding sample sizes, distribution of respondents across participat-ing schools, and response rates can be found in the Appendix . While response rates vary considerably from school to school, and response is generally higher at University of California campuses, the overall 2018 SERU response rate was 24 .8 percent . This rate of response is reasonably good for an online sur-vey, and it is also consistent with rates reported for similar surveys such as the National Survey of Student Engagement (Center for Postsecondary Research, 2016) . More information on the SERU Survey is given below .
Honors Education and Honors Students
Honors education has existed in elemental form in the United States since the late nineteenth century and in about the last hundred years through distinct honors programs and colleges (Rinn, 2006) . In 1957, the Inter-Uni-versity Committee on the Superior Student (ICSS), which was formed by Joseph Cohen that year, held a conference in Boulder, Colorado . Participants at the conference began the draft of what eventually became the “Sixteen Major Features for a Full Honors Program” (Cohen, 1966) . These sixteen features gave broad definition to honors programs and in the process some definition to honors education itself and, tangentially, to honors students . More than 35 years passed before honors programs and colleges, the con-duits for honors education, were given a more formal and definitive structure through the listing of the National Collegiate Honors Council’s (NCHC) “Basic Characteristics of a Fully Developed Honors Program” (Cummings, 1994) . These Basic Characteristics also gave more definition to honors education and, tangentially, to honors students . Surprisingly, however, not until 2013 did honors education itself get a formal and detailed definition (National Collegiate Honors Council, 2013) . Definitions for honors educa-tion up to that time had been generated from personal experience and were largely institution-specific or so focused on one aspect that they were not generally applicable (e .g ., Cohen, 1966) . Very likely, honors programs and honors education have eluded formal definition for so long because of the
wide variation in honors programs and what they deliver (Slavin) . Also, stan-dardization of honors education has over the years met at times with strong resistance (e .g ., Snyder and Carnicom, 2011) . The variation in honors pro-grams, however, has today lessened to the point where honors programs across institutions have many features in common (Cognard-Black & Savage, 2016) . More uniform conditions in honors programs/colleges across institu-tions have resulted in research, such as our study, that attempts to measure and define characteristics of honors students .
Because of the variations in earlier honors programs/colleges and the experimental or innovative nature of honors education itself, identifying and then tracking honors students—who are defined as academically talented undergraduate students participating in an honors program or college—has happened rarely . As Achterberg states in her 2005 article on the characteris-tics of honors students, no definition exists for honors students such as there is for honors programs . Even today, when honors programs and honors edu-cation have been better defined, not many data-driven studies that focus on defining the characteristics of an honors student exist (see the review of the literature below) . Most empirical studies on the topic are limited in their sam-ple size and specific to one institution . No study exists today that approaches both the number of participating institutions and the sample size of our study .
surveyof relatedresearch
Many explications of the characteristics of honors students are based solely on personal experience (e .g ., Harte, 1994; also see the Forum on
Honors Students in JNCHC 6 .1, 2005) . Although these descriptions can be
informative, they are mostly limited to a single individual and often a single institution . The personal and anecdotal accounts taken in sum over the years have created a characterization of honors students that is largely accepted as accurate even though it is not based on empirical evidence . The result has been what Achterberg (2005) terms an “ideology” or “belief system” or “par-adigm” of what an honors student is, which may or may not be accurate (p . 75) . As for studies on honors students that are empirical and quantitative, nearly all tend to focus on specific features, such as personality characteristics and specific behaviors (e .g ., Cross et al ., 2018, who focus on perfectionism and suicidal ideation), rather than development of a comprehensive profile . Moreover, most data-driven studies are confined to one institution and/or are limited in sample size (e .g ., Carnicom and Clump, 2004, who surveyed 45 students, 17 of whom were honors students, at Marymount University) .
The most informative survey of the research previous to 2005 on charac-teristics of honors students is Achterberg’s (2005), which provides a useful summation of past studies (see also Clark, 2000; Rinn and Plucker, 2004; Cuevas et al ., 2017) . Achterberg (2005), as well as several others who have surveyed the literature, note the lack of reliable, data-driven studies on the characteristics of honors students and call for more to be done . Moreover, sev-eral authors include studies of the gifted as part of their survey and research in order to supplement the little that has been done on college honors students (Rinn and Plucker, 2004; Cross et al ., 2018; Scager et al ., 2012) . Achterberg (2005), from her survey of the research, is able to formulate these general characteristics of honors students: compared to non-honors students, honors students demonstrate academic superiority (they are more able, accelerated, and advanced); have more contact with faculty; are more likely to enroll in graduate school; are more motivated, ambitious, conscientious, and self-directed; are more involved in co-curricular activities; are more open to new experiences; and tend to be introverted . In her conclusion, however, con-founded by the variation in honors programs and the differing criteria used for selection of honors students, she concludes that honors students “are not a homogeneous group with a set of absolute or fixed characteristics” and that any “firm conclusions about them should be held as suspect because empiri-cal data about honors students are in extremely short supply” (p . 79) .
The last two decades have produced more data-driven studies that attempt to define the characteristics of honors students in a more systematic and rigorous fashion . A few have larger sample sizes, and some span multiple institutions . We survey such studies below that relate either directly or in part to the goal of this study (formulating a comprehensive profile of hon-ors students) in order to provide either a contrast to, or corroboration of, the findings of our study . Most of these studies, however, are limited either by rel-atively small sample sizes and/or location at single institutions . Several have more specific additional limitations, which we have indicated in our summa-ries below . While the data presented in these studies cumulatively begin to paint a picture of a typical honors student, their lack of a shared methodology and focus limits evaluation of the generalizability of the varied characteristics under consideration .
The first study, which Deborah A . Gerrity et al . published in 1993, shows the results of a survey of a group of 940 incoming college students—231 hon-ors students and 709 non-honhon-ors—at the University of Maryland at College Park . The goal of the study was to help academic advisors be better informed
on what would be most beneficial for both honors and non-honors students . Because the authors administered their survey during the summer orienta-tion before the students’ first semester of attendance, their results reflect more what type of secondary school student becomes an honors student rather than the characteristics of an honors student already on campus . With their survey they collected information on demographics and the attitudes, inter-ests, and behaviors of honors as compared to non-honors entering freshmen . They found that although honors and non-honors students were similar in their co-curricular interests and their educational objectives, they differed in most other areas . The most significant differences were that honors students tended to be introverted; they valued intellectual and aesthetic pursuits more than practical activities; they showed more self-determination and thought-independence; they had more interests and engaged in more co-curricular activities; they had an intrinsic interest in learning rather than just a focus on grades; and they tended to be perfectionists . More non-honors students were first-generation students; honors students had better HS-GPAs; more honors students lived in residence halls; and more honors students came to college primarily to prepare for graduate school and learn more while non-honors students came primarily to get a better job and gain a general education . Both groups were the same in worrying about social relationships, health, and appearance . Also, race and gender were similar for both groups (note that the honors program at Maryland emphasized minority recruitment) . The limita-tion of this study in regard to the purpose of our own study is that the students surveyed had not yet had on-campus experience as honors students . Hence, they were more representative of academically talented secondary students than honors students .
The second study, published in 2002 by Edgar C . J . Long and Stacey Lange, was based on a survey of 360 undergraduate students (142 honors, 218 non-honors) from a large regional university in the Midwest . The authors had no specific hypothesis to develop and test; rather, the study was a simple com-parison of honors and non-honors students and in that respect was closest to our study’s purpose . Questions were designed to assess social involvement, behavior (how much students read, studied, and worked each week), and student satisfaction with their education . They also collected demographic information and included two personality measurements: conscientiousness (dependability or conformity and will to achieve) and openness to experience (curiosity, imagination, artistic sensitivity, and originality) . Additionally, the authors assessed student interaction . Their findings on honors students were
that they were more conscientious and more open to experiences; they exhib-ited more anxiety over grades; they were high-maintenance in the sense that they gave and required more attention in their academic pursuits; they were more academically focused (less likely to attend social parties, watch televi-sion, and drink and spend money on alcohol); they were more engaged in co-curricular activities; they were more involved with faculty; and finally, they were no more or less satisfied with their university than non-honors students . The third study, by Frank Shushok and published in 2006 as a follow-up to his 2002 study, was designed to assess how students were affected by participation in the honors college at an R1 Carnegie-classification university in one of the Mid-Atlantic states . Shushok (2006) surveyed two groups of similarly credentialed students, half of whom (86) applied and were selected to participate in the honors college . The other half (86) were equally quali-fied students who were not participants in the honors college . All students were beginning their first experience with postsecondary education and had achieved a high school grade point average of at least 3 .5 and a minimum com-bined SAT score of 1250 . In addition to SAT scores and high school grade point averages, each group was controlled to achieve a balance in race, gender, and place of residency (on- or off-campus housing) . Although Shushok’s pri-mary emphasis was on academic performance, he found in both his 2002 and 2006 studies that honors students differed from non-honors students only in the type of activities in which they participated: (1) honors students were 2 .5 times more likely than non-honors students to meet with a faculty member during office hours and 3 .1 times more likely than non-honors students to discuss career plans and vocational aspirations with a faculty member; (2) honors students were 2 .5 times more likely than non-honors students to discuss a social concern, political issue, or world event with another student outside of class; (3) male honors students were 3 .6 times more likely than male non-honors students to be involved outside of class in activities with an academic interest . As for academic performance between the two groups, the grade point average and retention differences between honors and non-honors students were statistically significant in the 2002 study but not in the 2004 study . This study is unique in how closely the control group matches the test group .
The fourth study, published in 2007 by Donald P . Kaczvinsky, used empirical data to characterize honors students at his own institution, Louisiana Tech University (a selective-admissions comprehensive public university) . Kaczvinsky used the College Student Inventory (CSI), which
is part of the Noel-Levitz Retention Management System and was designed to help students find the learning path that best matches their personality . The CSI scores are organized into five main sections: Academic Motivation; Social Motivation; General Coping Skills; Receptivity to Support Services; and Two Supplementary Scales . This study compared the averages of 58 hon-ors students with students in the entire freshman class, the 1,496 students who took the survey in September 2004 . Kaczvinsky (2007) found that when compared to the rest of the student body, honors students were more academically confident; had greater intellectual interests; and were more will-ing to challenge their accepted values, beliefs, and ideas . He also found that they were more financially secure than the average student, and, finally, that the honors students were far less socially inclined—that is, less likely to join groups or social organizations . The limitation of this study was that it was restricted to first-year, first-semester students at a single institution, which meant that it was not fully representative of honors students across all levels .
The fifth study, done in the Netherlands by Karin Scager et al . and pub-lished in 2012, investigated whether honors students differ from non-honors students in regard to Joseph Renzulli’s three-ring conception of giftedness, which posits that student characteristics relating to above-average general ability, high level of task commitment, and high level of creativity are the most important predictors of achievement in professional life . The authors asked more than 1,100 honors and non-honors students at Utrecht Univer-sity, a large research univerUniver-sity, to assess themselves on six characteristics: intelligence, creative thinking, openness to experience, the desire to learn, persistence, and the drive to excel . Their results showed that honors students were significantly different from non-honors students in all the six variables except persistence . The most significant differences were in the desire to learn, the drive to excel, and creativity . Intelligence was the weakest factor other than persistence . The limitation of this study was that the model for honors education in the Netherlands differs significantly from that used in the United States . Specifically, honors programs in the Netherlands are an overlay on the existing curricular requirements and hence require honors students to take more classes and do work in addition to what would normally be required for a degree . Honors programs/colleges in the United States typically integrate the honors experience into the curricular requirements for degrees so that honors students do not have to take additional classes and spend more time at the university in order to fulfill their requirements for graduation . This major structural difference could skew the comparison between honors students from the two different countries .
The sixth study, by Ted M . Brimeyer et al . and published in 2014, used quantitative data from two online surveys of a total of 743 students to com-pare the background characteristics, behaviors, and attitudes of honors and non-honors students at a medium-sized public university in the Southeast . The authors were testing the question of whether their honors program was reproducing socioeconomic and racial privileges, which is a common charge against honors programs . Their findings indicated significant racial and gen-der differences in the honors students, which suggested that the program was reproducing racial stratification . In contrast, the similarities in economic backgrounds of the test and control groups indicated that the honors pro-gram was not reproducing economic stratification . The authors also found that honors students differed significantly in attitude and behaviors: honors students were less concerned about grades and showed more concern with what they learned in class than non-honors students; also, honors students reported that they investigated their professors (i .e ., learned more about them before taking their classes) more than non-honors students did .
Amanda Cuevas et al ., whose study was published in 2017, surveyed 945 undergraduate honors students from eleven honors programs across the United States, some public, some private, and with differing Carnegie classi-fications . The purpose of the study was to measure how well honors students were “thriving,” defined as academic, psychological, and social well-being and engagement, which is a recently developed concept that expands the tradi-tional approach to measuring college student success beyond such cognitive measures as GPA . To measure thriving this study looked at honors students’ behavior in five areas: 1) academic determination, as measured by the differ-ent strategies studdiffer-ents used to enable their learning; 2) how engaged they were in learning; 3) how positive their perspective was; 4) diverse citizenship, i .e ., how open students were to diversity and how committed they were to social change; 5) and their social connectedness, as measured by their desire to develop and maintain meaningful relationships . The authors then com-pared the results of the test group to samples of traditional students (termed as the national baseline model) . Results indicated that the overall thriving lev-els of honors students were not significantly different from the control group of traditional students, i .e ., non-honors students . Honors students’ scores for social connectedness, however, were significantly lower than their other scale scores and lower as well than the traditional students’ scores . Also, honors students differed most significantly from traditional students in their higher scores for academic determination . Honors students’ characteristics were also significantly less spiritual than the national sample . The limitation of this
study was that the student sample comprised predominantly first-year stu-dents (33%) and white females (76%), which likely biased the results since a more common gender mix for honors students would be 63 percent female (NCHC 2016 Census) .
The next study, by Tracy L . Cross et al ., published in 2018, used an online survey to collect data on personality, perfectionism, and suicidal ideation of 410 honors students at a large Midwestern university . The authors’ intent was to identify patterns of personality traits from their sample of honors students; to determine if there was an association between patterns of personality traits and perfectionism; and to determine if there was an association between pat-terns of personality traits and suicidal ideation . The authors used the five-factor model of personality (aka the Big Five), which posits five basic dimensions of personality: agreeableness, conscientiousness, neuroticism (vs . emotional stability), extraversion, and openness to experience . Their findings were that the honors students in the sample on average, across all five factors tested, were more similar to a norm group of young adults their age than expected, but there were significant differences within the five factors: the sample of honors students was higher in conscientiousness and openness to experience, and they also exhibited greater emotional instability (nearly two thirds of the sample) and were higher in introversion than the norm group . As with the previous study, a limitation of this study was that 73 percent of the sample were females, which poses a bias .
The last study, by Angie L . Miller and Amber D . Dumford and published
in 2018, used data from the 2015 National Survey of Student Engagement
(NSSE) to compare aspects of student engagement for honors students and non-honors students . Their sample was 1,339 honors students and 7,191 non-honors students from fifteen different universities of various types although all with an honors program or college . The NSSE is administered only to first-year students and seniors, i .e ., not to sophomores and juniors . The authors’ hypothesis was that honors programs/colleges have a positive impact for honors students in regard to student engagement . They also exam-ined how the honors experience differed for first-year students and seniors . To determine the level of student engagement they used ten indicators for how students could be involved: higher order learning à la Bloom’s taxon-omy (Anderson et al ., 2001); reflective and integrative learning; quantitative reasoning (using and interpreting data); learning strategies; collaborative learning; discussions with diverse others; student-faculty interaction; effec-tive teaching practices; quality of interactions; and supporeffec-tive environment .
After controlling for various student characteristics (e .g ., gender, race/ethnic-ity, etc .) and other factors, they found that honors first-year students were significantly more engaged than non-honors students in the following areas: reflective and integrative learning; use of learning strategies; collaborative learning; diverse discussions; student-faculty interaction; and quality of interactions . For senior students, honors students’ student-faculty interaction was significantly greater than for non-honors students . A limitation particular to this study was that its primary purpose was to determine whether and how honors programs/colleges were affecting student engagement as opposed to the purpose of our study, which is to determine what characteristics and behaviors honors students exhibit . This study nonetheless gives some indi-cation of how honors students choose to engage in contrast to non-honors students .
thecurrentstudy
Methods
Analytic Approach
Data for our current study come from the 2018 administration of the Student Experience in the Research University Survey . The general analytic approach we employ to develop a profile of honors students as distinct from non-honors students is to present side-by-side comparisons of honors and non-honors students on selected indicators in the SERU data set, many of which are reflective of Astin’s (1993) Inputs-Environment-Outcomes model of student success . In general, the tables presented below provide descrip-tive text as well as details about measurement that we believe will be clear to most readers . Those wishing additional detail about survey question wording and response options for close-ended questions can find a PDF facsimile of the online survey at the SERU website located at the University of
Minne-sota cited in our references (see Student Experience in the Research University,
2018) .
For each comparison, we have also provided information about
corre-sponding tests of significance using either t-tests or chi-square tests . In all but
two of the comparisons presented herein, differences between honors and
non-honors were significant at the p ≤ .01 level . However, statistically
signifi-cant differences are easier to find when sample sizes are very large, as is the case for all of our analyses, and this can be true even when the magnitude
of the difference may be small . For instance, the percentages for honors and non-honors students reporting that “intellectual curiosity” was “very
impor-tant” as a reason for choosing their major were 94 .99 and 93 .59 (p ≤ .001, df
= 83,853) . While this difference is statistically significant and while there may be some small underlying effect resulting in the difference of 1 .4 percentage points, this particular difference is hardly exciting as descriptive of a profile that helps to describe the typical honors student . Thus, while some small dif-ferences may be statistically significant, they may not necessarily be especially meaningful . As always, analysts and readers alike must use their own careful judgment about whether such differences deserve attention . In the discus-sions of results, our goal will be to highlight and discuss differences that, in our judgement, appear to provide some separation between honors and non-honors students, and so we would be more likely to highlight, for instance, that honors students were 4 .1 percentage points higher in terms of reporting that “prestige” was a “very important” reason for choosing a major (cf . 47 .88% vs . 43 .78) .
Measures Honors Student
While the meaning behind most indicators presented herein will be fairly transparent, several measures deserve special mention . In particular, the key distinction between honors and non-honors students is facilitated by a single question asked of students as part of a set of possible undergraduate experi-ences . The common question stem for the set reads, “Have you completed or are you now participating in the following activities at [University Name]?” with response options allowing for “No” or “Yes, doing now or have done .” Our measure of honors participation is based on the response for “honors program” within that question set . Unfortunately, the question wording does not allow us to distinguish between those who currently are in an honors pro-gram and those who may have started in honors but subsequently left due to attrition or dismissal: this represents a source of error that likely will have the effect of understating differences between honors and non-honors stu-dents, especially among more senior respondents . For example, a student who started as an honors student and fell out of the program due to low GPA can nonetheless answer in the affirmative about having done honors, but this hypothetical student’s experience is likely to be different from that of other students who persist and are active honors students at the time of the survey .
Future research will be needed to better assess the extent of this source of error . In the meantime, the SERU Survey nonetheless represents one of the best sources of data allowing for direct comparison of honors with non-hon-ors students .
Race-Ethnicity
Our measure of race-ethnicity was derived from a set of Yes/No measures asking respondents to indicate whether they were “International Students,” “Hispanic or Latino,” “American Indian or Alaskan Native,” “Asian,” “Black or African American,” “Native Hawaiian or Pacific Islander,” “White,” or “Race/ Ethnicity Unknown .” Multiple responses were allowed so that respondents could indicate identification with any combination of racial or ethnic catego-ries . We used responses to these discrete questions in constructing a single nominal-level measure of race-ethnicity consistent with that used widely throughout higher education . The result is a nine-category operationalization of race-ethnicity that, for instance, distinguishes those with Hispanic back-ground from others in conventional racial categories . This approach should allow for more direct comparison of SERU data with other reports of race-ethnicity distributions presented by the U .S . Department of Education—e .g ., National Center for Education Statistics (NCES) (2017)—and other data sources using similar conventions .
Gender
The SERU Survey is unique among large surveys of any stripe in includ-ing separate measures of gender identity and biological sex . The question tapping into gender identity asked, “What is your current gender identity?” with response options including “Man,” “Woman,” “Trans Man,” “Trans Woman,” “Genderqueer/Gender Non-Conforming,” and “Not listed above .” Those who responded with the last of these options also had the option to provide an open-ended response . Inspection of the open-ended responses revealed wide variability in chosen gender identity, the exploration of which is beyond the scope of this study, and it also revealed considerable hostility to the question itself . For these reasons, we have chosen to omit the small percentage of those who responded to this undefined category . The ques-tion tapping into biological sex asked, “What sex were you assigned at birth, such as on an original birth certificate?” and had response options “Male,” “Female,” and “Intersex/Non-binary .” We used these two items to construct
a measure distinguishing cisgender men and women from a smaller group including trans, intersex, genderqueer, and gender-nonconforming students . In this operationalization, men are those who reported both male biologi-cal sex and a gender identity as a man; women are those who reported both female biological sex and a gender identity as a woman; and the third cat-egory of gender includes all other respondents except those who indicated that their gender identity was ‘Not listed above .’”
Combining trans individuals with intersex likely ignores important differ-ences within this aggregated category, but fewer than 2 percent of individuals fell into these categories, and the small numbers argued for aggregation . Pre-Matriculation Academic Profile
Some measures reported are derived not from student responses but instead from data available in university data systems and matched to student survey data as part of the survey administration protocol . Such measures of first-year student admission profile as high school GPA and SAT or ACT scores come not from student responses but from student databases main-tained at participating SERU universities .
Patterns of Response
Finally, while 118,852 students responded in some form to the 2018 SERU Survey, those 118,852 students did not necessarily respond to all questions, nor were campus data necessarily universally available for all stu-dent participants . Readers will note that sample sizes (denoted by “n” in the column headers for summary tables) vary considerably though all would be considered quite large by most standards (the smallest is 14,625, for the SAT critical reading test scores, of which 2,697 were identified as honors) .
The extent to which data omissions are a result of underlying bias is dif-ficult to assess, but we should be cautious—as we should be in all evaluations of survey research—and recognize that some response bias is possible, i .e ., some groups of respondents may be less likely to respond to certain ques-tions, and some may be less likely to respond at all . For example, many contemporary readers will be aware of the current national debate about inclusion of a citizenship question in the upcoming 2020 U .S . Census, the risk of which may be an undercount of noncitizens residing in the United States . In the case of the SERU data, serious and high-performing students may be more likely to respond than weaker students so that honors students might
respond in greater numbers than non-honors students . In the case of small segments of populations like honors program participants, such an effect has the benefit of generating larger sample sizes, which are generally preferable for conducting tests of statistical significance, but an inherent risk may be that such response bias could be associated with other variables in the analysis in ways that would lead to errors in estimation . One consequence may be that weaker non-honors students are less likely to respond than stronger non-hon-ors students, and, as with the wording of the question for the honnon-hon-ors item, this response bias could have the effect of understating differences between honors and non-honors students . With the data available at this time, we are unable to evaluate such sources of bias, but the cumulative impact of these two sources of error are likely to mean that our comparisons represent con-servative estimates of what may be larger honors differences than we are able to detect in the SERU data . In any case, levels of response among the 118,852 students in the sample are quite high for most measures and indicate data worthy of serious consideration .
results
Diversity Enrollment
The question of whether higher education reduces or reinforces social class and racial inequality has for many years driven large areas of social sci-ence and educational research (Armstrong and Hamilton 2013; Brooks 2000; Hout 2009; Khan 2012; Torche 2011), and the National Collegiate Honors Council has recently undertaken a new strategic priority to address issues of diversity and inclusion specifically as they pertain to honors programs, the students who end up in and persist in those programs, and, importantly, the students who may not be selected to participate or who may become discour-aged and leave such programs (Yavneh Klos, 2017) . A question of interest for some time is how diverse honors students are and how closely they represent the student populations from which they come . To date, however, few data have been available to address these questions, so we begin our profile of an honors student by exploring the important issue of diversity .
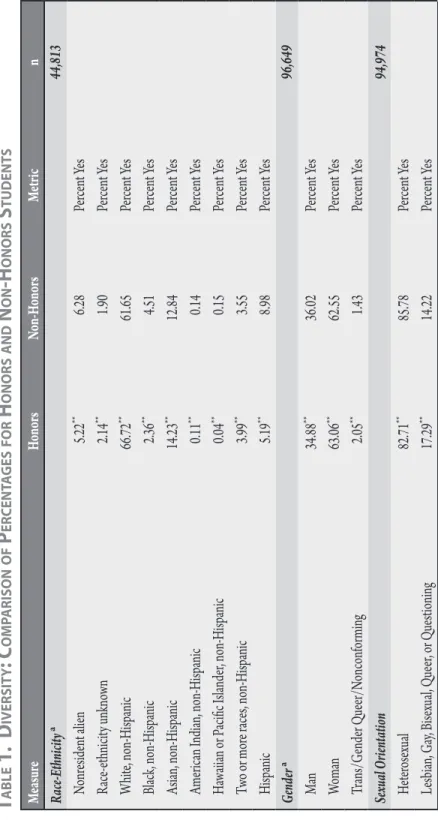
Table 1 focuses on measures of diversity enrollment and includes indi-cators of race-ethnicity, gender, sexual orientation, and socio-economic diversity as well as a category of well-being and ability measures . All numbers in Table 1 can be read as percentages, and in the case of items under the race-ethnicity, gender, and sexual orientation headings, numbers sum to 100 .
For the analysis of race-ethnicity, we have restricted the sample to include only those schools outside of the state of California because the unique race-ethnic composition of California, combined with the dispropor-tionate number of California schools and California students participating in SERU—57 .1% of respondents were at the nine University of California schools—had an undue influence on the estimates of racial composition . In particular, the percentage of Asian residents in California is about three times higher than in the U .S . population, and the percentage of Hispanic resi-dents is about twice as high (U .S . Census Bureau, 2019: Tables 19 and 20) . The university student population in California in many ways reflects these differences, and when California schools are left in the analysis, the overall percentages of Asians and Hispanics are considerably higher; concomitantly, the overall percentages of whites and African Americans are smaller than they would be in a national sample (see Table 1 notes for details) . Thus, leaving out the California schools results in a sample race-ethnicity distribution that is closer to the national distribution at research universities (NCES, 2017) .
As a point of comparison, Figure 1 presents the average race-ethnic dis-tribution for the 52 institutions that provided relevant data to the 2014–2015 NCHC Admissions, Retention, and Completion Survey (ARC) . The sample size of those with valid data in the ARC survey was fairly small . Nevertheless, to date ARC has been one of the few sources of national data on race-ethnic composition specifically in honors (NCHC, 2015) . Despite sizable differ-ences in some of the minority groupings across the SERU and ARC, most notably for black and Asian students (both differences of about 8 percent-age points, though in opposite directions), both data sources point to almost identical proportions of non-Hispanic white students in honors (66 .96% vs . 66 .72%) . Whether the differences across the two surveys are the result of actual differences between research universities and the broader range of NCHC institutions or response biases in one or both surveys, we note that the relatively strong correspondence between the two different data sources lends some credibility to both sets of data . Further, the ARC percentages also provide some support for having limited the SERU sample to those schools outside of California . (Race-ethnicity is the only variable for which we have excluded California schools; all other analyses include data for students from the University of California campuses and thus have much larger sample sizes .)
On first glance, honors and non-honors students seem to be strikingly similar in race-ethnic distribution . While somewhat more honors students
appear to be white than the non-honors students, by about 5 percentage points, most of the differences for race-ethnic categories are within 2 or 3 percentage points of each other . This finding might seem to point toward diverse representation, but the differences are for numbers that are already quite small, and in some cases the magnitude of the differences is quite large, especially for black and Hispanic students . In other words, the 2 .2 percent-age point difference for African American students is actually quite large in a university environment where only 4 .5 percent of students are African Amer-ican, so African Americans are only half as likely to be in the honors group as they are in the larger SERU university sample (2 .36 ÷ 4 .51 = .52, or half) . Some students with African American heritage may be captured in the per-centage of those with two or more races, but such students are in roughly the same proportions in the honors and non-honors groups, so that is unlikely to explain much of the discrepancy in African Americans between the two groups . Similarly, Hispanic students are only 58 percent as likely to be in hon-ors as in the non-honhon-ors SERU group (5 .19 ÷ 8 .98 = .578, or 58%) .
These race-ethnic disparities are in the context of a larger educational environment that is already fairly racially homogenous . The overall African
f
igure1. a
verager
ace-e
thnicityd
istributionofh
onorsP
rogramsSource: 2014–2015 NCHC Admissions, Retention, and Completion Survey (n = 52) .
White
African American Hispanic/Latinx (of any race) Asian American Hawaiian/ Pacific Islander American Indian/ Alaska Native Two or more races Nonresident alien Unknown Race-ethnicity 67 .0% 11 .2% 9 .0% 0 .3% 1 .7% 2 .1% 2 .2% 5 .9% 0 .6%
American percentage of 4 .51 seems quite low . The black population of the United States in 2017 was 13 .4 percent according to the U .S . Census Bureau (2019), and 4 .51 is so low by comparison that one might wonder whether it is a result of some non-response bias or other undercount . However, accord-ing to the National Center for Education Statistics (2017), only 6 .7 percent of students at Research 1 universities were African American in 2016 . While that estimate includes graduate as well as undergraduate students, it is an indication of the extent to which the larger undergraduate populations lack diversity . The low 4 .51 percent number for African Americans could also be a reflection of the fact that participating SERU schools are located in states that are somewhat more white than the nation as a whole, but most of the discrepancy can be attributed to the fact that Research 1 universities do not, in general, have enrollments that are especially representative of ethnic and racial minorities . This problem goes beyond honors, affecting the larger insti-tutional environments in which honors programs and colleges are located, and it is a problem of which we should be aware .
By contrast, honors programs and colleges in the SERU sample appear to be fairly representative of the larger undergraduate populations in terms of gender and sexual orientation: in fact, transgender, gender queer, gen-der-nonconforming, LGBQ, and gender-questioning students appear to be slightly overrepresented among honors students . Differently-abled students are also fairly well represented within honors, with those reporting learning and physical disabilities being 30 to 45 percent more likely to be in the hon-ors group (4 .77 ÷ 3 .29 = 1 .45, or 45% greater) . Mental and emotional health concerns do not distinguish the honors group from the non-honors group, but the numbers for both groups are high: almost one-third of all students responding reported some mental or emotional health concern .
Some of the most striking differences in Table 1 concern the two mea-sures under the heading of socioeconomic diversity . Results reveal that first-generation students and low-income students (as indicated by having ever received a Federal Pell grant) are significantly and substantially under-represented in the honors group . While this finding will not surprise most readers, it is one of the first revelations of the scope of this problem across multiple institutions . Pell grant recipients are about 30 percent less likely to be in the honors group than in the non-honors group, and first-generation students are about 40 percent less likely to be in the honors group .
First-Year Student Profile and Measures of Student Experience
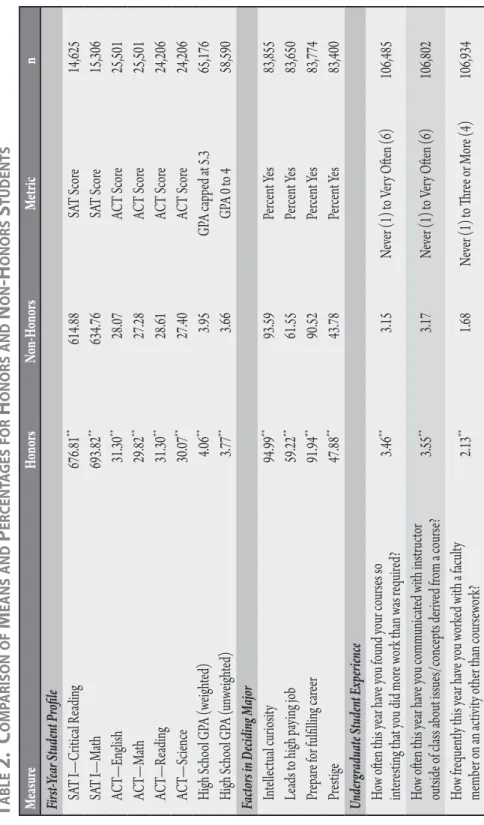
We turn now to comparisons of student admission profiles, indicators of student values regarding choice of major, and a variety of measures of student experience . Table 2 presents the results of these analyses . Unlike Table 1, most analyses are comparisons of means for ordinal-level measures of underlying interval concepts . In the case of test scores and GPAs, numbers are presented on standard SAT, ACT, and GPA scales although the weighted GPA is trun-cated in analyses to exclude a small number of implausibly high scores (some approaching 90); we capped the unweighted GPA at 5 .3 and excluded those with higher scores . For the four measures tapping into factors used in decid-ing a major, numbers are the percentage of students who indicated that the factor was “very important” in deciding their major .
Not surprisingly, those in the honors group had substantially higher test scores and high school grade point averages . Regardless of which test score is used, the honors group had scores that were about 10 percent higher, on average . These differences represent about one-half of a standard deviation on the standard college entrance exams (in the vicinity of 2 .5–3 .0 ACT points and about 50–60 SAT points) . Higher test scores among honors students will not be especially surprising to most readers: 65 percent of institutions responding to the NCHC 2014–2015 Admissions, Retention, and Comple-tion Survey reported having a minimum ACT or SAT score as a criterion for honors admission (NCHC 2019), and many more probably use test scores as part of the admission process . Similarly, those in the honors group had somewhat better high school GPAs than those in the non-honors group—a difference of about .11 grade points .
In the reasons for choosing a major, honors and non-honors students displayed little difference . Almost equally high proportions in both groups reported that “intellectual curiosity” and interest in a “fulfilling career” were “very important” reasons for choosing their major, and roughly equal num-bers reported that desire for a “high paying job” was a “very important” reason . Some meaningful difference in motivation may exist in the proportion of the honors group who reported that “prestige” was a “very important” reason behind the choice of major, but the difference is also not so overwhelming that it would lead us to conclude that honors students are in it just for the boost they get in status . Attendance at Research 1 and other flagship universi-ties already confers substantial status in today’s educational marketplace, and this reality may have an effect of shrinking a difference that we might see in
t
able1.
d
iversit y: c
om Parison ofP
er cent ages forh
onors andn
on-h
onorss
tudent s Me asu re Honor s Non -H onor s Me tric n Ra ce-Eth nic ity a 44,813 Nonr eside nt al ien 5 .22 ** 6 .28 Per cent Ye s Ra ce-ethnic ity unkno wn 2 .14 ** 1 .90 Per cent Ye s W hit e, non-Hi spa nic 66 .72 ** 61 .65 Per cent Ye s Bla ck , non-Hi spa nic 2 .36 ** 4 .51 Per cent Ye s Asi an, non-Hi spa nic 14 .23 ** 12 .84 Per cent Ye s Ame rica n I nd ian, non-Hi spa nic 0 .11 ** 0 .14 Per cent Ye s Ha wai ian or P aci fic I sla nde r, non-Hi spa nic 0 .04 ** 0 .15 Per cent Ye s Tw o or mor e r ace s, non-Hi spa nic 3 .99 ** 3 .55 Per cent Ye s Hi spa nic 5 .19 ** 8 .98 Per cent Ye s Gen der a 96,649 Ma n 34 .88 ** 36 .02 Per cent Ye s Wo ma n 63 .06 ** 62 .55 Per cent Ye s Tr an s/Ge nde r Que er/N onc onfor min g 2 .05 ** 1 .43 Per cent Ye s Se xua l Or ien tat ion 94,974 He ter os exual 82 .71 ** 85 .78 Per cent Ye s Le sb ian, G ay, B isex ual , Que er, or Que stionin g 17 .29 ** 14 .22 Per cent Ye sSoc io-e conom ic Di ver sit y Fir st-ge ne rat ion s tude nt 12 .50 ** 20 .80 Per cent Ye s 97,434 Ev er r eceiv ed a P ell gr an t 27 .50 ** 40 .46 Per cent Ye s 96,582 We ll-Be ing Ph ysical d isa bil ity/c ond ition 4 .77 ** 3 .29 Per cent Ye s 96,682 Le arnin g d isa bil ity/c ond ition 4 .20 ** 3 .28 Per cent Ye s 96,205 Ne urode velopme ntal/c ognit ive d isa bil ity/c ond ition 5 .74 ** 5 .17 Per cent Ye s 96,449 Emot ion al/me ntal he alth c onc ern/c ond ition 31 .05 ** 31 .64 Per cent Ye s 96,440 *p < .05 ** p < .01 So ur ce: 2018 St uden t Ex per ien ce i n t he R ese ar ch U niv ersit y Su rve y. a Si gni fica nc e for the g ende r a nd r ac e-e thnic ity me as ur es w as t es ted usin g chi -squa re (g ende r χ 2 = 34 .2, d f = 2; r ac e-e thnic ity χ2 = 245 .6, d f = 8) . No tes : The r ac e-e thnic ity a nalysi s i s r es trict ed t o S ER U s choo ls outside of C ali for ni a be ca us e the unique r ac ial c omposit ion of C ali for ni a, c omb ine d w ith the d ispr opor -tion ate n umbe r of C ali for ni a s choo ls p ar tic ipa tin g in S ER U, h ad a n undue influe nc e on the r ac ial c omposit ion e stim ate s . I n p ar tic ula r, the pe rce nt ag e of A sia n r eside nts in Cal ifor ni a i s a bout thr ee time s hi ghe r th an in the U .S . popul ation, and the pe rce nt ag e of H isp anic r eside nts i s a bout tw ice as hi gh . W he n C ali for ni a s choo ls are left in, the ov eral l pe rce nt ag e of A sia ns in the s amp le i s 24 .0 in ste ad of 12 .8 pe rce nt , a nd the pe rce nt ag e of H isp anic s in the s amp le i s 18 .8 in ste ad of 8 .1 pe rce nt . The o ve ral l pe rce nt ag e of w hit es in the s amp le i s only 41 .5 in ste ad of 62 .4 pe rce nt ; the pe rce nt ag e of A frica n A me rica ns i s 3 .3 in ste ad of 4 .5 pe rce nt . Th us, le av
ing out the C
ali for ni a s choo ls r es ults in a s amp le r ac e-e thnic ity d istr ibut ion th at i s clos er t o the n ation al d istr ibut ion a t r es ea rch univ er sit ies .
t
able2.
c
om Parison ofm
eans andP
er cent ages forh
onors andn
on-h
onorss
tudent s Me asu re Honor s Non -H onor s Me tric n Fir st-Ye ar S tuden t P rofi le SA T I — Cr itical R ead ing 676 .81 ** 614 .88 SA T S cor e 14,625 SA T I — M ath 693 .82 ** 634 .76 SA T S cor e 15,306 ACT —E ng lish 31 .30 ** 28 .07 AC T S cor e 25,501 AC T— M ath 29 .82 ** 27 .28 AC T S cor e 25,501 ACT —R ead ing 31 .30 ** 28 .61 AC T S cor e 24,206 AC T— Sc ienc e 30 .07 ** 27 .40 AC T S cor e 24,206 Hi gh S choo l GP A (w eigh ted ) 4 .06 ** 3 .95 GP A ca ppe d a t 5 .3 65,176 Hi gh S choo l GP A ( un wei gh ted ) 3 .77 ** 3 .66 GP A 0 t o 4 58,590 Fac tor s in De cid ing M ajor Int elle ctual c uriosit y 94 .99 ** 93 .59 Per cent Ye s 83,855 Le ad s to hi gh p ay ing j ob 59 .22 ** 61 .55 Per cent Ye s 83,650 Pr ep are for f ulfi llin g ca ree r 91 .94 ** 90 .52 Per cent Ye s 83,774 Pr est ige 47 .88 ** 43 .78 Per cent Ye s 83,400 Un derg rad ua te S tuden t Exp erienc e Ho w oft en thi s y ear h ave y ou found y our c our ses s o int ere stin g th at y ou d id mor e w ork th an w as r equir ed ? 3 .46 ** 3 .15 Ne ver (1) t o V ery O fte n (6) 106,485 Ho w oft en thi s y ear h ave y ou c omm unica ted w ith in str uct or outside of cl ass a bout i ssue s/c onc epts de riv ed f rom a c our se? 3 .55 ** 3 .17 Ne ver (1) t o V ery O fte n (6) 106,802 Ho w f reque ntly thi s y ear h ave y ou w ork ed w ith a fa cult y me mbe r on a n a ctiv ity othe r th an c our sew ork? 2 .13 ** 1 .68 Ne ver (1) t o Thr ee or M ore (4) 106,934Ho w f reque ntly thi s y ear h ave y ou g one t o cl ass unpr ep are d? 2 .54 ** 2 .53 Ne ver (1) t o V ery O fte n (6) 106,756 Ho w f reque ntly thi s y ear h ave y ou incr eas ed y our a cade mic effor t due t o the hi gh s tand ard s of a fa cult y me mbe r? 3 .83 ** 3 .72 Ne ver (1) t o V ery O fte n (6) 106,561 Ho w f reque ntly thi s y ear h ave y ou s ubs tan tial ly r ev ise d a pa pe r befor e s ubmitt ing it t o be gr ade d? 3 .91 ** 3 .87 Ne ver (1) t o V ery O fte n (6) 106,815 On a ver age , ho w m uch of y our as signe d c our se r ead ing h ave you c omp let ed thi s a cade mic y ear? 7 .07 ** 6 .78 0–10% (1) t o 91–100% (10) 107,024 Hour s in a t yp ical w eek thi s y ear s tudy ing a nd othe r a cade mic act ivit ies outside of cl ass 4 .54 ** 4 .23 0 (1) t o M ore th an 30 (8) 106,571 Hour s in a t yp ical w eek thi s y ear pe rfor min g c omm unit y ser vic e or v olun tee r a ctiv itie s 2 .12 ** 1 .80 0 (1) t o M ore th an 30 (8) 106,781 Hour s in a t yp ical w eek thi s y ear p art icip atin g in p hysical exe rci se, r ecr eat ion al spor ts, or p hysical ly a ctiv e ho bb ies 2 .61 ** 2 .48 0 (1) t o M ore th an 30 (8) 106,868 Hour s in a t yp ical w eek thi s y ear p art icip atin g in sp iritual or rel igious a ctiv itie s 1 .73 ** 1 .49 0 (1) t o M ore th an 30 (8) 106,813 Hour s in a t yp ical w eek thi s y ear p art icip atin g in s tude nt clubs or or gani zat ion s 2 .49 ** 2 .15 0 (1) t o M ore th an 30 (8) 106,642 Hour s of p aid e mp loy me nt ( includ ing in ter nships ) in a typ ical w eek thi s y ear — on ca mpus 5 .19 ** 4 .16 Numbe r of H our s 102,648 Hour s of p aid e mp loy me nt ( includ ing in ter nships ) in a typ ical w eek thi s y ear — off ca mpus 3 .91 ** 4 .69 Numbe r of H our s 100,607 Av era ge n umbe r of hour s sle pt pe r w eekni gh t thi s y ear 3 .64 ** 3 .54 4 or le ss (1) t o 9 or mor e (6) 107,022 *p < .05 ** p < .01 So ur ce: 2018 St uden t Ex per ien ce i n t he R ese ar ch U niv ersit y Su rve y .
other types of campus settings such as lesser-known regional universities or community colleges .
In their undergraduate experience, students in the honors group reported a more positive experience, on average, than those in the non-honors group . While there was no significant difference between the two groups in the fre-quency of going to class unprepared (one of the few non-significant differences reported in this study), honors students tended to report greater frequency in the following areas: finding coursework so interesting that they do more work than required; communicating with instructors about coursework outside of class; working with faculty on activities other than coursework; increasing effort as a result of high faculty standards; and completing assigned reading . Students in the honors group also reported spending more time in a typi-cal week at academic, enriching, and self-care activities that we might expect are associated with well-rounded success and well-being . The honors group reported spending more time, on average, on study or other academic work; performing community service and volunteer work; participating in religious activities; and participating in student organizations . They also reported getting more exercise and sleep . Finally, while students in the honors and non-honors groups reported similar overall amounts of time spent in paid employment, honors students appeared to be more likely to do that work on campus rather than off campus .
The use of ordinal-level data with discrete rather than continuous scales of measurement made it difficult to gauge how much more the students in the honors group were being exposed to various experiences . For instance, the averages for doing more work than required and communication with an instructor outside of class indicate that students both in the honors group and in the non-honors group were somewhere between “occasionally” (coded 3) and “somewhat often” (coded 4), and the averages for the number of hours studying in a typical week indicate that students in both groups were some-where between “11–15 hours” (coded 4) and “16–20 hours” (coded 5) . While the meaning of average differences in the neighborhood of 0 .3 for many of these indicators are hard to pin down with any precision, the pattern of higher relative scores for students in the honors group seem to point consistently to a conclusion that honors students have a different and qualitatively better experience with faculty; that they spend their time somewhat differently in college; and that they spend more of their time on activities that most educa-tors would regard as enriching and developmentally advantageous .
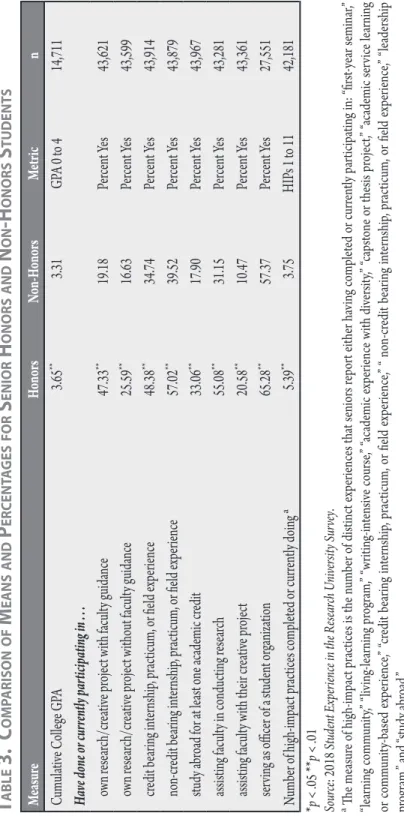
Student Success and High-Impact Practices among Seniors We conclude with an analysis of student success and student experiences, many of which are widely referred to as high-impact practices . Because many such experiences are normatively restricted to students with upper-class standing (i .e ., senior theses, capstone experiences, study abroad), we have restricted the sample for this analysis to only those identified as “seniors” or “graduating seniors” in the data set . The restriction to seniors allows us to focus on differences in accumulated experience over the course of an under-graduate career .
Table 3 presents the results of this analysis . Those in the honors student segment of the senior sample had markedly higher cumulative college grade point averages . The average college GPA for seniors in the honors group at the beginning of the semester of survey administration was 3 .65 compared to just 3 .31 for the non-honors group . This 0 .34 grade point difference is not only statistically significant but substantively large . A grade point average of 3 .31 is located at the 38th percentile in the overall distribution within the study sample, and a grade point average of 3 .65 is at the 69th percentile . Thus, the difference in average GPAs for the two groups is a difference of about 31 points in percentile rank in the overall GPA distribution for those students who persisted to senior standing . This difference seems particularly impres-sive given the comparatively smaller average difference in high school GPA between the honors and non-honors groups .
Other impressive differences between the honors and non-honors groups are apparent when examining exposure to high-impact practices and other meaningful undergraduate experiences . The honors group had higher averages for every measure of such positive student experiences . Specifically, students in the honors group reported having experience with an average of 5 .39 high-impact practices compared to just 3 .75 for students in the non-hon-ors group . When we look at exposure to a sampling of specific experiences, the differences between students in the honors and non-honors groups becomes even more obvious . Seniors in the honors group were 77 percent more likely than those in the non-honors group to report having assisted faculty in conducting research (55 .08 ÷ 31 .15 = 1 .77, or 77% greater); they were 85 percent more likely to report having studied abroad; they were twice as likely to report having assisted faculty with their creative project; and they were 2 .5 times more likely to report having conducted their own research or creative project under faculty guidance . In the case of that last indicator, almost half of senior students in the honors group had conducted their own research under
t
able3.
c
om Parison ofm
eans andP
er cent ages fors
eniorh
onors andn
on-h
onorss
tudent s Me asu re Honor s Non -H onor s Me tric n Cum ula tiv e C olle ge GP A 3 .65 ** 3 .31 GP A 0 t o 4 14,711 Ha ve done or c ur ren tly p ar tic ipa tin g i n . . . ow n r ese arch/cr eat ive pr oje ct w ith fa cult y g uid anc e 47 .33 ** 19 .18 Per cent Ye s 43,621 ow n r ese arch/cr eat ive pr oje ct w ithout fa cult y g uid anc e 25 .59 ** 16 .63 Per cent Ye s 43,599 cre dit be arin g in ter nship , pr act icum, or fie ld ex pe rie nc e 48 .38 ** 34 .74 Per cent Ye s 43,914 non-cre dit be arin g in ter nship , pr act icum, or fie ld ex pe rie nc e 57 .02 ** 39 .52 Per cent Ye s 43,879 study a bro ad for a t le ast one a cade mic cr ed it 33 .06 ** 17 .90 Per cent Ye s 43,967 assi stin g fa cult y in c onduct ing r ese arch 55 .08 ** 31 .15 Per cent Ye s 43,281 assi stin g fa cult y w ith their cr eat ive pr oje ct 20 .58 ** 10 .47 Per cent Ye s 43,361 ser vin g as offic er of a s tude nt or gani zat ion 65 .28 ** 57 .37 Per cent Ye s 27,551 Numbe r of hi gh-imp act pr act ice s c omp let ed or c urr en tly do ing a 5 .39 ** 3 .75 HI Ps 1 t o 11 42,181 *p < .05 ** p < .01 So ur ce: 2018 St uden t Ex per ien ce i n t he R ese ar ch U niv ersit y Su rve y . a The me as ur e of hi gh-imp act pr act ice s i s the n umbe r of d ist inct ex pe rie nc es th at s enior s r epor t eithe r h av ing c omp let ed or c ur ren tly p ar tic ipa tin g in : “ fir st-ye ar s emin ar, ” “le arnin g c omm unit y,” “ liv ing -le arnin g pr ogr am, ” “ wr itin g-in ten siv e c our se ,” “ aca de mic ex pe rie nc e w ith d ive rsit y,” “ ca ps tone or the sis pr oje ct, ” “ aca de mic s er vic e le arnin g or c omm unit y-b as ed ex pe rie nc e,” “ cre dit be ar ing in ter nship , pr act icum, or fie ld ex pe rie nc e,” “ non-cre dit be ar ing in ter nship , pr act icum, or fie ld ex pe rie nc e,” “ lea de rship pr ogr am, ” a nd “ study a br oa d .”faculty supervision whereas only about one-fifth of non-honors students had had that experience . Differences between honors and non-honors students for the other experiences in the table were smaller but still notable, and even the smallest of these differences was fairly impressive: students in the honors group were 14 percent more likely to have served as a club officer .
discussion
The data presented here reveal a profile of a college honors student with a strong academic background in high school, drawn disproportionately from Asian, white, and higher socioeconomic family backgrounds, and motivated in some greater measure by the desire for status and prestige . While in college, such students appear somewhat more likely to find coursework interesting, communicate and work with faculty outside of class, and increase effort in response to high standards . They also appear to complete more of their course readings and spend more time studying or participating in enriching activities such as community service and student clubs . In addition to study and academic pursuits, honors students reported spending somewhat more time participating in spiritual or religious activities as well as self-care such as exercise and sleep . Over the course of their college career, honors students are much more likely to participate in high-impact practices such as study abroad, internships, and working with faculty on research and creative projects . These students do considerably better academically while in college, and by the time they reach senior class standing, their cumulative grade point average is, on average, much stronger .
While this profile provides a coherent picture largely consistent with what previous studies have indicated and with the paradigm that honors edu-cators have developed for honors students from their personal experience, the results also show that honors students are not entirely different creatures than non-honors students . The knowledge of demonstrable differences, however, can be of value in several ways . For example, knowing that honors students are more likely to find coursework interesting, that they will communicate and work with faculty outside of class, and that they will increase efforts in response to high standards, i .e ., they like a challenge, would be more useful in identifying prospective honors students through a holistic review than the simple use of standardized tests and high school GPAs (Smith & Zagurski, 2013) . Also, knowing that honors students are much more likely to partici-pate in high-impact practices such as study abroad, internships, and working with faculty on research and creative projects will guide the structuring of
honors curricula and the ways that scholarships and awards are used to sup-port the honors experience .
limitations
As is often the case when using survey data collected for broad use, we are limited by such factors as the kinds of questions asked, the ways in which those questions were phrased, and the level of detail allowed in the responses . We might like in addition to know about the quality of the experience stu-dents have while working with faculty or the levels of frustration, fear, and gratification while studying abroad or working on research . Also, previous studies indicate that honors students as compared to non-honors students show tendencies to introversion (Gerrity et al ., 1993; Cuevas et al ., 2017; Cross et al ., 2018) and perfectionism (Gerrity et al ., 1993), but the SERU Survey questions did not allow us to explore these areas . Thus, opportunities remain for research to provide more nuance to our growing understanding of who honors students are, what motivates them, how they react to the experi-ences we provide for them in college, and how much they learn and grow as a result .
One important weakness in our study concerns the wording of the survey question at the heart of our analysis . As we pointed out earlier, the question tapping into honors student experience is much broader than we might have hoped for, and some unknown number of students who fell into our honors group are ones who once were but are no longer in the honors program . In light of the large size of the honors student population in college today—an estimated 300,000–400,000 at NCHC member institutions alone (Scott, Smith, & Cognard-Black, 2017; see also Smith & Scott, 2016)—large-scale undergraduate student surveys such as SERU would do well to refine such questions to allow for greater precision in identifying students who are actively participating in honors . In still other surveys of the undergraduate experience, no questions whatever allow researchers to distinguish honors from non-honors students; this omission is striking and should be addressed . The widely-used National Survey of Student Engagement is one such research project .
The SERU Survey data have allowed us to make great strides in compar-ing honors and non-honors students, but the SERU samplcompar-ing frame focuscompar-ing exclusively on R1 universities omits large numbers of undergraduates study-ing at other kinds of institutions . Significant deviations may and probably do occur from the honors student profile revealed by SERU Survey data .