GIS AND TESTING SIGNIFICANCE OF PEDESTRIAN VARIABLES ON WALKING TO TRANSIT
A Dissertation by
PRAVEEN KUMAR MAGHELAL
Submitted to the Office of Graduate Studies of Texas A&M University
in partial fulfillment of the requirements for the degree of DOCTOR OF PHILOSOPHY
August 2007
GIS AND TESTING SIGNIFICANCE OF PEDESTRIAN VARIABLES ON WALKING TO TRANSIT
A Dissertation by
PRAVEEN KUMAR MAGHELAL
Submitted to the Office of Graduate Studies of Texas A&M University
in partial fulfillment of the requirements for the degree of DOCTOR OF PHILOSOPHY
Approved by:
Co-Chairs of Committee, Christopher Ellis Byoung-Suk Kweon Committee Members, Jody Rosenblatt Naderi Bruce Thompson Raghavan Srinivasan Head of Department, Forster Ndubisi
August 2007
ABSTRACT
Healthy Transportation – Healthy Communities: Developing Objective Measures of Built-Environment Using GIS and Testing Significance of Pedestrian Variables on
Walking to Transit. (August 2007)
Praveen Kumar Maghelal, Dip. Civil Engineering, Valliammai Polytechnic; B.Arch., SRM Engineering College; M.S., New Jersey Institute of Technology
Co-Chairs of Advisory Committee: Dr. Christopher Ellis Dr. Byoung-Suk Kweon
Walking to transit stations is proposed as one of the strategies to increase the use of transit. Urban planners, transportation planners, environmentalists, and health professionals encourage and support environmental interventions that can reduce the use of cars for all kinds of trips and use alternative modes of travel such as walking, biking, and mass-transit.
This study investigates the influence of the built-environment on walking to transit stations. Transit-oriented communities at quarter and half-mile distances from the Dallas Area Rapid Transit (DART) station in Dallas, Texas, were analyzed to identify the relation of various constructs of built-environment on walking to the DART stations. Twenty-one pedestrian indices were reviewed to develop a comprehensive list of 73 built-environment variables used to measure the suitability to walk. This study aims to objectively measure built-environment using spatial data. Based on this criterion the total number of variables was narrowed to 32. Walking to transit, calculated as a percentage of transit users who walk to the DART LRT stations, was used as the
dependent variable. The number of stations in operation and used for analysis in this study is 20(n). Therefore, bootstrapping was used to perform the statistical analysis for this study.
The final pattern of variable grouping for the quarter-mile and the half-mile analysis revealed four principal components: Vehicle-Oriented Design, Density, Diversity, and Walking-Oriented Design. Bootstrap regression revealed that density (β = -0.767) was the only principal component that significantly (p<0.05) explained walking to transit station at quarter-mile distance from the station. At half-mile distance built-environment variables did not report any significant relation to walking to transit.
The present study revealed that mere increase of density should not be taken as a proxy of increase in walking. Environmental interventions that can promote walking should be identified even at locations with high density. Further studies should use advanced statistical techniques such as Hierarchical Linear Modeling or Structural Equation Modeling to test the relationship of both the principal components and the individual variables that define the principal component to clearly understand the relationship of built-environment with walking to transit station.
DEDICATION
ACKNOWLEDGEMENTS
First and foremost, I would like to thank the people who made it possible for me to be here against all odds, my parents. Even after all the expected and unexpected challenges that our family experienced in the last six years you have been a source of emotional support to me. I cannot thank you enough for this opportunity. I would like to thank Rekha, my sister, who has been a source of much needed strength for me. Most important, I would like to thank my better half, Prathiba Natesan, for tolerating me through this process of education and life. Without her, I would not have achieved this important milestone in my life.
I would like to thank my committee chairs, Dr. Christopher Ellis and Dr. Byoung-Suk Kweon for being a source of inspiration and advice. Thank you for encouraging me through both my academic and personal progress at Texas A&M. Thank you Chris, for accommodating my never ending demand for recommendation letters that won me my first research grant, and various other university awards. Thank you Byoung-Suk, for detangling the research method of all the research projects on which we worked together.
I thank my committee members, Prof. Jody Naderi, Prof. Bruce Thompson, and Prof. Srinivasan Raghavan. Thank you Jody for being a kind ear to the personal and professional happenings of my life and being a source of encouragement throughout my education at Texas A&M. Thank you Dr. Thompson for agreeing to be a part of my committee at the eleventh-hour and guiding me through my analysis. Last but not the
least, I would like to thank Dr. Srini, with whom I have shared and discussed the importance of personal and professional achievements. I am sure those discussions will be immensely useful in my career ahead.
This list would not be complete without thanking Dr. Walter Peacock and Dr. Samuel Brody. I have learnt so much from you both. You were always easily approachable and helped me have a wonderful experience working at HRRC. I will cherish the ‘Friday discussions’ for life. My heartfelt gratitude to Dr. Forster Ndubisi, Dr. Douglas Wunneburger, my friend and guide Dr. Chanam Lee, the staff, and my colleagues in the College of Architecture.
My time in College Station would have been like a travel through a dry desert, had it not been for my friends and their families. Hereon, it will not be the same without you guys-Miriam, Sudha, Wes and Linda, ‘the only’ Kim, Paula, Meghan, Himanshu, Sarah, Kang, Sandy, David, and my ex-roommates Vivek, and Krishna. Thank you Miriam, for introducing me to weekend parties and taking me as your friend. Also, I would like to thank my friends from India – Rajpal, Prashanth, KB, Sidd, Bharath, Rakesh, Bhoo, Vinodh, and Prad for supporting and inspiring me throughout my stay in the US.
Finally and most importantly, this dissertation is supported by the Robert Wood Johnson Foundation through their Active Living Research Dissertation Award. I would like to thank the program director Dr. James Sallis and his staff, and the reviewers of my proposal for sharing their views on my dissertation.
NOMENCLATURE
BART – Bay Area Rapid Transit CBD – Central Business District
CDC – Center for Disease Control and Prevention COOP – Cooperative Rain gage Station
DART – Dallas Area Rapid Transit GIS – Geographic Information System
LUTRAQ – Land-Use Transportation Air Quality LRT – Light Rail Transit
NCTCOG – North Central Texas Council Of Governments PSI – Pedestrian Suitability Index
PWI – Pedestrian Walkability Index TOC – Transit Oriented Communities
USDHHS – United States Department of Health and Human Services USDOT – United States Department of Transportation
TABLE OF CONTENTS Page ABSTRACT……… iii DEDICATION……… v ACKNOWLEDGEMENTS………... vi NOMENCLATURE……….. viii TABLE OF CONTENTS………... ix
LIST OF FIGURES……… xii
LIST OF TABLES………. xiii
CHAPTER I INTRODUCTION………. 1
Background of the Study……… 1
Problem Statement………. 2
Research Purpose………... 5
Research Premise………... 6
Organization of the Dissertation……… 7
II REVIEW OF LITERATURE……… 9
Section - I Introduction……… 9
Built-Environment for New-Urbanist Communities…………. 9
Built-Environment and Auto-Travel………. 10
Built-Environment and Walking………... 12
Built-Environment and Walking to Transit……….. 13
Section – II Review of Pedestrian Indices……….. 16
Identifying the Indices………. 16
Unit of Analysis……….. 19
Sources……… 19
Type of Data……… 20
CHAPTER Page Section – III
Objective Measures of Built-Environment……… 23
Evaluation of Distance in GIS………... 25
Evaluation of Neighborhood in GIS……….. 26
Evaluation of Physical Environment in GIS…………. 27
Walkability Index in GIS……….. 28
Grouping Destination in GIS……… 29
Lessons Learnt………... 29
III METHODOLOGY……… 31
Introduction……….. 31
Conceptual Framework and Hypothesis……….. 31
Research Design……….. 34
Study Area……… 34
Unit of Analysis……… 35
Study Design and Variables……… 37
Data Analysis……… 37
Variable Measurement………. 38
Statistical Method……… 48
IV DATA ANALYSIS AND RESULTS……….. 53
Introduction………. 53
Descriptive Analysis………... 54
Test for Skewness and Kurtosis……….. 56
Test for Correlation………. 57
Hypothesis I……… 58
Principal Component Analysis……….. 59
Bootstrap Principal Component Analysis……….. 64
Hypothesis II……….. 68
Bootstrap Regression……….. 68
Comparing Models………. 76
V DISCUSSION AND CONCLUSIONS……… 80
Discussion……… 80
Implications of this Study……… 85
Recommendations for Future Research……….. 89
Conclusion……….. 90
Page
APPENDIX A……….. 104
APPENDIX B……….. 112
APPENDIX C……….. 115
LIST OF FIGURES
FIGURE Page
1. Census report of mode of travel in 1990
and 2000………. 3 2. Theoretical framework to identify
appropriate intervention………. 7 3. Conceptual framework of walking using
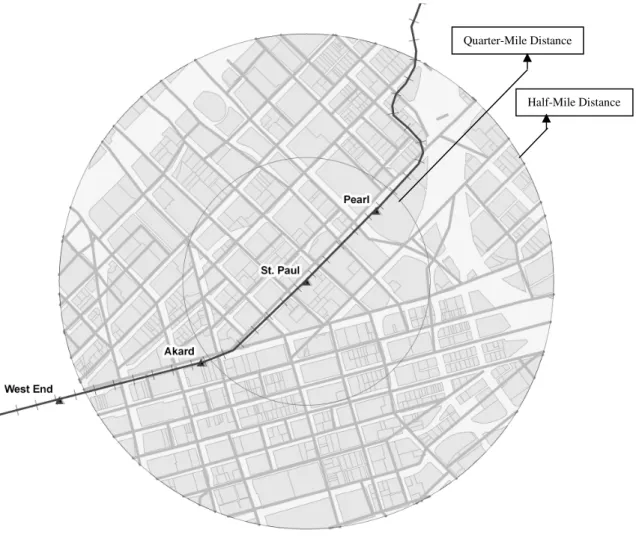
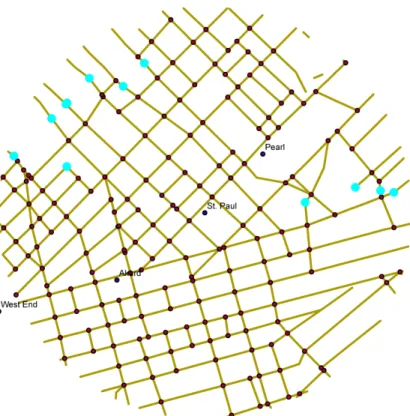
GIS measures………. 33 4. Unit of analysis: Quarter-mile and half-mile
airline distance buffer from transit station………. 36 5. Three and four-way intersection created
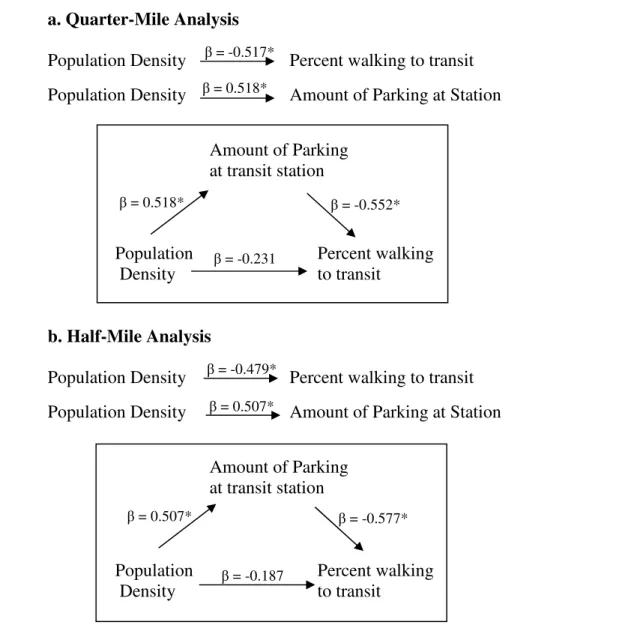
using ET Geo-wizard………. 42 6. Road network classification and scoring……….. 43 7. Measure of residential compactness………. 46 8. Mediating effect of amount of parking on walking
LIST OF TABLES
TABLE Page
1. Review of existing pedestrian indices……….. 17
2. Factors used to develop the pedestrian indices………..……….. 18
3. Classification of variables as objective and non-objective variables……… 21
4. Characteristics of DART LRT station……… 39
5. Data layers used for the study………. 40
6. Factors identified based on the variable grouping and measure of each variable……….. 47
7. Descriptive statistics of measured variables……… 55
8. Abbreviation of measured variables for quarter and half-mile distance……… 57
9. Quarter-mile principal component analysis………. 60
10.Half-mile principal component analysis……….. 62
11.Quarter-mile bootstrap principal component analysis………. 66
12.Half-Mile bootstrap principal component analysis……….. 67
13.Quarter-mile bootstrap regression………. 71
CHAPTER I INTRODUCTION Background of the Study
Walking to transit stations is proposed as one of the strategies to increase the use of transit. The increase in use of transit and walking is expected to alleviate the amount of trips made in private cars. Urban planners, transportation planners, environmentalists, and health professional encourage and support environmental interventions that can reduce the use of cars for all kinds of trips and use alternative mode of travel such as walking, biking, and mass-transit. Walking and biking short distances to destinations such as community stores, parks, school, or transit station is encouraged. This can increase the activity level of the community and improve the overall health of the community. Therefore walking in general, and walking for transportation is especially encouraged in communities across the United States.
Studies in the last decade have investigated the effect of built-environment on walking in the community (Ball et al., 2001; Booth et al., 2000; CDC, 1999; Troped et al, 2001; Handy, 2002; and Greenwald, Boarnet, 2002). Various environmental correlates have been identified that influence walking in general (Sallis et al., 1999; Sallis et al., 1997; Giles-Corti and Donovan, 2002a; CDC, 2001; Brownson et al., 2001; Giles-Corti and Donovan, 2002b; Saelens et al., 2003a; and Pikora et al., 2003). Walking, especially to transit, is influenced by other demographics and socio-economic variables
including the built-environment. It is therefore important to take a holistic view to investigate the effect of built-environment on walking to transit.
This study investigates the influence of built-environment which includes the density, urban-form and other walking related variables identified from the literature on walking to transit stations. Transit Oriented Communities (TOC) at quarter and half-mile distance from the Dallas Area Rapid Transit (DART) station in Dallas, Texas will be analyzed to identify the relation of various constructs of built-environment on walking to the DART stations.
Problem Statement
Neighborhood communities are being redesigned and revitalized into attractive, safe, and more livable places. Currently, new communities are designed based on the principles of New Urbanism which includes medium to high density, mixed land-use, and sidewalk facilities. The central premise of these design principles is to reduce automobile usage and to encourage and accommodate transit-use and other non-motorized mode of transportation such as walking and biking. Therefore, transportation planning and planning for alternative modes of travel play a critical role in designing communities today.
Also, transportation plays a critical and effective role in improving the livability of communities, since it is tied to our daily activities. People travel in their auto, by transit, by walk or on bike to their destinations. Availability of alternative modes of travel, its location, design of streets and sidewalks affect how these daily activities of
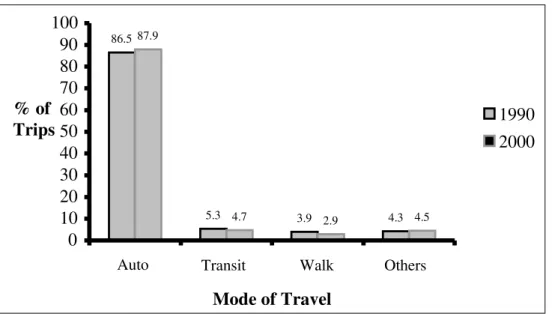
transportation are performed in the community. Of all the modes of travel, transit as an alternative mode of travel is particularly encouraged by federal and local transportation, planning, and health related agencies such as Federal Transit Administration, Federal Highway Authority, and Center of Disease Control and Prevention. This is because transit-use improves community health by reducing negative environmental impact such as air, water, and land pollution, and reducing the congestion resulting from extensive use of private automobile for work or non-work related trips for both long and short distance trips. The core reason to reduce the trips made by cars is because the US census1 reports high and increasing use of cars for all kinds of trips in comparison to other alternative modes of travel. The percentage of total trips in cars has increased from 86.5% in 1990 to 87.9% in 2000 of all the trips (Figure 1). Walking and the use of transit have been low and have actually reduced even more in the last decade. Only 4.7% and 2.9% of the trips in 2000 were made by public transit and walking respectively.
86.5 5.3 3.9 4.3 87.9 4.7 2.9 4.5 0 10 20 30 40 50 60 70 80 90 100
Auto Transit Walk Others
Mode of Travel % of
Trips 1990
2000
One way to reduce the number of car trips is to reduce the use of private cars for short distance trips. A study by Cervero and Radisch (1996) reported that over 65% trips of less than one-mile in distance were done in cars. Choosing alternate modes such as walking and biking for the short distance trips can help reduce the total number of trips and Vehicles Miles Traveled (VMT) in car. Travel demand studies have revealed that travel by personal vehicles is lower in neighborhoods with higher rates of walking. Walkable neighborhood also helps increase use of transit for all trips as reported by Cervero and Radisch. Therefore, walking with inter-connected facilities to transit in communities needs to be encouraged.
Also, linking of transit facilities with well connected road network, sidewalk, and other physical attributed of built-environment is seen as one of the important strategies to increase transit-use. Since all transit trips involving some amount of walking, improving built-environment around transit facilities that support walking, will help increase walking and eventually the activity-level of the community.
Recent studies report that walking trips are heavily influenced by the characteristics of the neighborhood. Greenwald and Boarnet (2002) reported that characteristics of built-environment such as high density, land use mix, and street network connectivity are positively associated to walking. Thus pedestrian neighborhoods are generally defined to have relatively high densities of development, mixed land uses, and high connectivity of street network (Ewing, Haliyur, and Page, 1994). These characteristics of built-environment are similar to the built-environment characteristics of the traditional neighborhoods, planned well before early modern times.
Though recent studies have investigated certain built-environment variable’s influence on walking to transit, comprehensive built-environment constructs still remains to be investigated.
Research Purpose
The specific objective of this research is to measure the impact of built-environment on walking to transit stations. The central hypothesis of the proposed research is that improving pedestrian built-environments in communities around transit stations will encourage people living in them to use transit as a mode of travel to work, recreation, or shopping. The rationale that underlies this investigation is to identify the built-environment variables that affect walking to transit which will help propose appropriate design interventions to encourage activity-friendly environments. The central hypothesis will be tested and the objectives of this study achieved by pursuing the following specific research objectives, which are:
1) To identify what built-environment characteristics in communities around transit stations function together as constructs of the physical environment?
2) To examine if the constructs of the physical environment in communities around transit stations affect walking to transit?
3) To investigate if the effects of these constructs vary based on the distance from the transit station?
4) To recommend design interventions in transit communities that can increase walking to transit stations
The proposed research is innovative because it uses objective measures of the built-environment around transit stations for its suitability to walk to the stations. These measures will be investigated for its influence on walking to transit stations, which is the central hypothesis of this research. Identification of these built-environment variables will help in identifying design interventions that promote walking and use of transit.
Research Premise
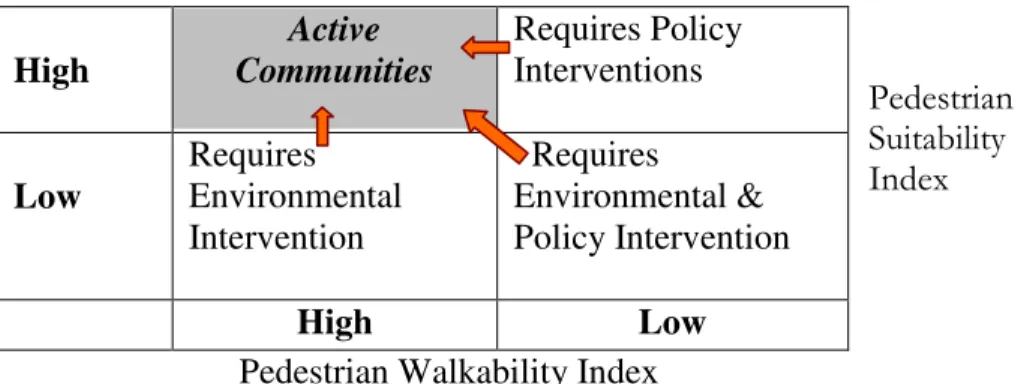
This study is foreseen as a part of larger study to develop two indices: (i) Pedestrian Suitability Index and (ii) Pedestrian Walkability Index, to measure the activity-level of communities. The Pedestrian Suitability Index (PSI) will the objectively evaluate the pedestrian environments of the community while the Pedestrian Walkability Index (PWI) will use subjective measures of the environment such as willingness to walk and preferred sidewalk width in communities. Disparity in the outcome of these indices, as shown in Figure 2, in the communities under investigation will help identify the specific type of intervention (Physical or Policy) that can increase activity-level of the communities. Lack of walking in communities (Low PWI) with built-environment that support walking (High PSI) suggests policy intervention will be required to educate people about the benefits of walking. Conversely, physical interventions need to be introduced in locations with low PSI and High PWI. To do so, it is important to understand the relationship of specific built-environment variables on walking. Therefore, this dissertation currently develops objective measures of the
built-environment using spatial data and investigates its impact on walking to transit. These measures will be used in later studies to develop the PSI (future scope).
High Active Communities Requires Policy Interventions Low Requires Environmental Intervention Requires Environmental & Policy Intervention High Low
Pedestrian Walkability Index
Organization of the Dissertation
This dissertation is organized in five chapters. Chapter I discusses the background of this study and identifies the specific objectives of this study. Chapter II reviews the literature related to objective of this study. This chapter is divided into three sections. The first section reviews the role of built-environment in supporting new-urbanist principles of reducing auto-travel, and using alternative modes of travel. The second section develops an inventory of built-environment variables used to measure suitability to walk by reviewing the existing pedestrian indices and the third section looks at objective measures of the built-environment variables used by studies that have used Geographic Information Systems. Chapter III discusses the data measures and research method used in this study. This chapter introduces and discusses bootstrap principal component analysis and bootstrap regression, statistical method used to analyze the objectives of
Pedestrian Suitability Index
this study. Chapter IV presents the results of analysis by presenting the descriptive analysis, constructs of built-environment identified by bootstrap principal component analysis and role of these constructs with walking to transit stations using bootstrap regression. Finally, discussion of the results and summary of this study is presented in Chapter V.
CHAPTER II
REVIEW OF LITERATURE
Section – I Introduction
The literature study for this research was conducted in three parts. The first section of the literature reviewed the effect of built environment on(i) reduced use of private-auto; (ii) increased non-motorized mode of travel such as walking; and (iii) walking to transit station. The second section reviewed the literature on existing pedestrian indices to develop a comprehensive list of built-environment variables used to measure the suitability to walk and the third section synthesizes the literature that have objectively measured a few or all of these variables objectively using GIS. For ease of reporting, the following literature will identify traditional neighborhoods as pedestrian neighborhood since both have been reported to have similar characteristics.
Built-Environment for New-Urbanist Communities
Studies in the last two decades have investigated the effect of built-environment on motorized (Cervero and Radisch, 1996; Cervero and Gorham, 1995; 1000 Friends of Oregon, 1997; Holtzclaw, 1994) and non-motorized mode of travel such as walking (Cervero, 2002; Handy, 1996). However, fewer studies have looked at walking to transportation destinations at the community-level (Example: Loutzenheiser, 1997; Cervero, 1996; Besser and Dannenberg, 2005; Scholssberg and Brown, 2004). Since
walking to transportation destinations such as transit station is seen as one of the strategies to increase transit-use and physical activity of the community, it is important to analyze communities with transit destinations within walkable distance. Studies indicate that neighborhoods with transit destinations within walking distance of the households report higher average walking trips (Handy 1996). Increased walking to destinations like transit stations and using transit for both work and non-work related trips has other benefits with the obvious health benefit (CDC 1996, Francis 1997, and USDHHS 2000) through regular physical activity.
Built-Environment and Auto-Travel
Pedestrian neighborhoods report higher rates of travel by walking and transit (Fehr and Peers, 1992), and reduced travel by personal vehicles (Cervero and Gorham, 1995). Also, pedestrian neighborhoods with transit destination within walking distance of the households report higher average walking trips (Handy, 1996).
In a study conducted by Cevero and Radisch (1996) two communities: (i) suburban community oriented to mass transit and (ii) an automobile-oriented community in the metropolitan areas of San Francisco Bay Area and Los Angeles – Orange County were analyzed. Their study investigated the travel choices in pedestrian versus automobile communities in San Francisco Bay Area. The core reason for this investigation was to determine the role of the design principles of New Urbanism such as grid-like street patterns, mixed land uses, and pedestrian amenities on travel choices. They analyzed two communities: Rockridge, a neo-traditional neighborhood and Lafayette, a conventional suburban community. Rockridge reported higher percentage of
trips by walk and transit compared to the conventional suburban community. For trips less than one-mile in distance, Rockridge reported 28% of trips by walk compared to Lafayette, which reported 8% of non-work related trips by walk. So, 20% higher share of trips by walking to BART stations was reported in Rockridge. Therefore, neo-traditional neighborhoods such as Rockridge with characteristics of pedestrian communities, with compact and mixed-use developments, report at least three times more trips by walk to various destinations compared to a suburban community. The Bay Area's transit-oriented neighborhoods, on average, generated around 70% more transit and 120% more pedestrian/bicycle trips than the auto-oriented neighborhoods. Their study concluded that neighborhood design affect the degree to which people walk or bicycle.
While the study by Cervero looked at the relation of type of neighborhood with trip mode, the Land Use-Transportation-Air Quality (LUTRAQ) study for Portland, Oregon (1000 Friends of Oregon, 1997) looked at the impact of specific built-environment variables on travel. The built-built-environment variables such as ease of street crossings, sidewalk continuity, local street characteristics, and topography were reported to be highly correlated with transit trips but did not show a significant impact on Vehicle Miles Traveled (VMT) in the neighborhood. On the contrary, a study by Holtzclaw (1994) reported reduction in VMT by 25% when the densities doubled and reduction in VMT by 8% when the transit service doubled. Henceforth, studies have investigated the correlates of built-environment that reduces use of private-auto for all kinds of trips. Last decade, studies have investigated the effect of built-environment on walking in general.
Built-Environment and Walking
Cervero (2002) analyzed the built-environment variables in 3-Dimensions (3D’s) of design, density, and diversity to develop the mode-choice models for the Montgomery County, Maryland using the 1994 Household Travel Survey. Using the binomial logit model, he estimated the choice of driving-alone and the use of transit versus other modes of travel for all trip purposes. They looked particularly at the relative importance of land-use variables using two models: one was a basic binomial logit model without land-land-use variables and another expanded model with the land-use variables. Land-use diversity, density, and ratio of sidewalk miles to road miles worked against driving. Only ratio of sidewalk was statistically significant built-environment variable. In predicting the choice of transit, density and land-use diversity were significant. Density, land-use diversity, and ratio of sidewalk miles were positively associated with choosing transit as mode of travel. Point elasticity revealed that the probability of choosing transit increases with increase in density, land-use, and sidewalk ratio.
Similarly, Handy (1996) analyzed the urban-form of three types of communities: Traditional communities, Early-modern communities, and Late-modern communities in Austin, Texas for its influence on walking for strolling trips and for walking to destination. New urbanism concepts to encourage walking and interaction and discourage automobile usage were tested in these communities. Average walking trips to destinations such as retail stores was reported to be higher in the traditional versus the other two types of communities. Traditional communities reported 2 to 6 times more walking to store when compared to the late-modern communities. Handy, therefore,
suggested that more walking was reported in traditional communities partially because of supporting urban-form such as higher household densities and better commercial areas with rectilinear grid street-patterns. Urban-form thus plays a greater role when it comes to walking to destination.
Built-Environment and Walking to Transit
Walking to destinations such as transit stations has been reviewed and reported in this section. A study by Loutzenheiser (1997) investigated the pedestrian access to Bay Area Rapid Transit (BART) stations. They used the data obtained from the BART survey conducted in 1992 to investigate the choice of trips by walk versus other modes of travel using binomial logit model. Distance was one of the most significant principal components to walk. Income was less important when walking was compared to transit users whereas mean income had similar relation with choosing to walk or choosing to use transit for any trip. He also reported that for every additional distance of 0.3 mile from the station, the probability to walk decreased by 50 percent. Car ownership and availability of parking at transit stations were inversely and significantly related to walking to the stations.
Another study by Cervero (1996) looked at the impact of land-use mix and commuting using the 1985 American Housing Survey. Binomial Discreet Choice Model was used to measure the probability of commuting by walking (or bicycling). Presence of retail stores such as grocery and drug stores between 300ft and 1mile and availability of private automobiles were negatively and significantly related to walking whereas availability of adequate transit services and commercial buildings are positively
significant with walking to transit. Mixed land-use was a better predictor than residential densities of commute by transit, foot or bicycle. Both density and land-use reduce vehicle ownership rates and are associated with shorter commutes.
While these studies investigated walking in communities with destinations such as transit stations and compared the communities with respect to the mode of travel, two particular studies have analyzed the communities around transit stations, otherwise termed as Transit-Oriented Community (TOC) for its walkability. A study by Besser and Dannenberg (2005)investigated the 2001 National Household Travel Survey for transit-associated walking. They concluded that minorities, people with low-income, and people in high density urban areas were likely to walk to and from transit daily. Their study recommends increased access to public transit to maintain active lifestyles. The main limitation of their study was they did not include the built-environment aspect in their analysis which has shown to have significant effect on walking to transit.
Another study by Schlossberg and Brown (2004) compared the TOCs for walking. The effectiveness of TOC, commonly identified as Transit-Oriented Development TOD, depends on high density, land use mix, and roadway connectivity. Access to transit stop is an important component of TOCs. Their study analyzes the built-environment in communities at 0.25 and 0.5 mile distance equivalent of 10 min. and 20 min. of walking, around the station. Their paper focuses on connectivity of walking environment to transit stations. One major limitation of their study was they did not include dimensions of walkable environment related to density and land use mix. It is important to include these neighborhood variables because they significantly adds to
the regression models of walking beyond socio-demographic variables (as done by Besser and Dannerburg) (Eg. Kockelman 1997; Frank and Pivo 1994; Kitamura, Mokhtarian, and Laidet 1997).
Therefore, few variables of built-environment have been empirically analyzed for its impact on walking in transit-oriented communities. Investigation of large number of built-environment variables that can influence walking to transit station still needs to be conducted and reported because based on the impact of the determinants of built-environment on walking, various interventions can be recommended. Therefore, this study reviewed twenty-one pedestrian indices (Allan, 2001; Bandara et al., 1994; Bradshaw, 1993; Dixon 1996; USDOT; Landis et al., 2001; City of Ft. Collins, 2002; Khisty, 1994; Moudon, 2001; Moudon et al., 2002; City of Portland, 1998; Wellar; Gallin, 2001; Portland Pedestrian Master Plan, 1998; Saelens at al., 2003b; Carreno, Willis, Stradling, 2002; Milazzo, 1999; and Dannenberg, 2004) that were developed during the last two decade to develop a comprehensive list of built-environment variables and identify those that could be measured using GIS.
Section - II
Review of Pedestrian Indices
One particular study that is germane to this review is the evaluation of environmental audit by Moudon and Lee (2003). Their study reviewed audit instruments and indices1 for both walking and biking and guides the review of indices for this study.
Identifying the Indices
This study reviews the ‘pedestrian indices’ that evaluate walking in communities. The primary need for this review was to identify built-environment variables associated with walking (only) that can be objectively measured using GIS. Therefore, indices developed in the last two decades to quantify the pedestrian environment were selected from the existing literature. The indices were reviewed for the scale of measurement, type of data, source(s) of the data, and the list of specific variables used to develop the index (Table 1). The identified variables were classified into 11 constructs such as sidewalk, road, intersection, vehicle, pleasantness, and safety (Table 2). Doing so helped to identify the specific constructs of built-environment that were used to develop these indexes over the span of two decade.
1
Audits refer to measuring the environment for the quantity of a specific determinant of built-environment through either GIS, Site Survey or individual survey. Indices on the other hand uses the audited measured and aggregates them to evolve a number that could be used to compared walking or biking-oriented communities across the nation.
17
Author Index Unit of Analysis Data Source Data Measured
Allan Walking Permeability Indices Area GIS Objective
Bandara Grade-Seperated Pedestrian Systems Area Unclear Objective (?)
Bradshaw Walkability Index Area Survey Both
Dixon Pedestrian Performance Measures Segment Audit Objective
DOT Walkability Checklist Area Survey Subjective
FDOT Florida Pedestrian Level of Service Segment Audit Objective
Fort Collins Pedestrian Level-of-service Area Audit Both
Khisty Qualitative level of service Segment Survey Subjective
Moudon Pedestrian Infrastructure Prioritization Decision System Area GIS Objective
Moudon Pedestrian Location Identifier 1 Area GIS Objective
Moudon Pedestrian Location Identifier 2 Area GIS Objective
Portland Pedestrian Deficiency Index Segment GIS Objective
Portland Pedestrian Environmental Factor Area Unclear Objective Portland Pedestrian Potential Index Segment GIS & Survey Objective Gallin WA-LOS Pedestrian Level of Service Segment Audit Both
Wellar Basic walking security Index Intersection Audit Both
Dannenberg (Virginia) Walkability Audit Tool Segment or Area Audit Both
Highway Manual Level of Service Segment Audit Objective
Carreno et al (2002) Pedestrian Quality of Service Segment Survey Both Saelens et al (2003) Neighborhood Environment Walkability Scale Area Survey Both
Frank et al Walkability Index Area GIS Objective
Table 1.
18
Author Distance Sidewalk Roads Intersection Vehicles Pleasantness Demographics Safety Destinations
Lateral Separation Land-Use Allan-WPI X - - - - Bandara-GSPS X - X - - X - - - - X Bradshaw-WI - X - - X X X X X - - Dixon-PPM - X X X X - - - X X - DOT - X X X X X - - - X - FDOT-LOS - X X - X - - - - X - Fort Collins-LOS X X X X - X - X - - - Khisty-QLOS X X X X X X - - X - - Moudon -PIPDS - - - X - - - X Moudon-PLI1 - - - X - - - X Moudon-PLI2 - - - X - - - X Portland-PDI - X X - X - - - - Portland-PEF - X X X - - - - Portland-PPI X - - - X - X Gallin WA-LOS - X X X X X - X - X X Wellar-BWSI - - - X - - - - Dannenberg-WAT - X - X X X - - - X - Highway Manual-LOS - - - X - - X - - - - Carreno et al-PQS - X - X - X - X X - - Saelens et al-NEWS - - X - - X X X X - X Frank et al- WI X - X - - - - - - - X Total occurrence 6 11 11 10 8 9 6 5 6 5 8 Table 2.
Unit of Analysis
The scale of measurement of each index is identified by the quantification of pedestrian variables for an area, segment or location. For example, the index developed by Wellar quantified the suitability to walk based on the intersection features and thus the scale of measurement was the location (of intersection). Whereas the Khisty’s Qualitative Level of Service quantified the pedestrian suitability for a road segment and thus the scale of measurement is the road segment. From the reviewed indices, eleven indices quantified the suitability for an area, eight quantified a segment, and one measured the suitability to walk at a location (intersection). The walkability audit tool developed by Dannerburg can evaluate the suitability to walk at the scale of both segment and area.
Sources
It was important to identify the sources of the data used to evaluate the suitability to walk because it helped in classifying the variables into objective or subjective variables. It has to be noted that either due to unavailability of diligent methods or technology, some variables used in certain indices were measured subjectively either through survey or site audit. With the current improvements both due to availability of data and the technology, these variables can be measured objectively in GIS. Only six indices used GIS measures to develop their index. Thirteen indices used either survey or site audits to develop the index. It was unclear from the literature if the Grade-Separated Pedestrian Systems by Bandara and the Pedestrian Environmental Principal component for Portland used a survey, GIS, or aerial imagery to evaluate each variable used to develop the
respective index. The Portland Potential Index used both GIS based measures and measures obtained through survey to quantify the suitability to walk.
Type of Data
The pedestrian indices were reviewed to list the specific variables used to quantify a score of suitability to walk. Once these variables were identified, they were evaluated if the variables used for that index could be measured objectively using GIS. For example, Khisty’s Level of Service was assessed using perception of the environment and therefore was subjective to the location and the observer, whereas the Dixon’s Pedestrian Performance Measure uses variables that can be measured using GIS and were thus classified as objective variables. In the currently reviewed indices for this study, 12 indices used variables that can be objectively measures using GIS, two were purely based on perception and were thus subjective, and seven indices used both objective and subjective variables to quantify the suitability to walk.
Measure of Indices
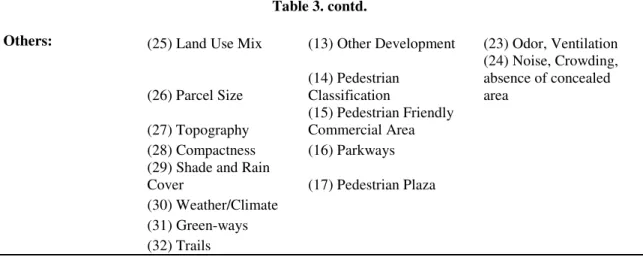
The variables of each index were categorized into twelve different constructs of built-environment. The physical construct of road were the most commonly used constructs across various indices followed by the construct of sidewalk and intersection in eleven indices. Lateral separation was a construct least used across the 21 indices. Only five indexes of 21 used the variables of lateral separation such as sidewalk buffer and shoulder lane. In total, 73 variables were measured to develop the 21 indices (Table 3). Of the 73 variables, 49 were identified as objective variables and 24 were identified as non-objective variables. Variables identified as objective but were either proxy for
OBJECTIVE - Used OBJECTIVE - Not Used NON-OBJECTIVE
Distance: (1) Origin to destination
(2) Actual Dis/ Min Dis
(3) Distance to Schools
Sidewalk: (1) Availability (4) Continuity (1) Visibility (2) Connectivity (5) Width (2) Usage Density
(3) Maintenance
Roads: (3) Connectivity (6) No. of Lanes (a) Driveway
(4) Width (4) Frequency/Volume (5) Median
(6) Network
Intersection: (7) Density (7) Curb-cuts (5) Comfort
(b) signalization (8) Safety (a) Crosswalk (8) Availability (9) Size (6) Visibility
(a) crosswalk (b) Signalization (10) Availability (7) Visibility
(8) Synchronization
Vehicles: (9) Speed (9) Not Cautious (10) Volume
(11) Parking
Pleasantness: (12) Lighting (11) Benches/HH (10) Attractiveness (13) Street Tree (11) Visibility
(12) Local Architecture (13) Building Frontage (14) Supporting Facilities (15) Attractive Delight (16) Interest (17) People (18) Dogs (19) Street Furniture (20) Exploration
Demographics: (14) Population Density (15) Housing Density (16) Employment Density (17) Ethnic Minority Density
(18) Households with cars
Safety: (19) Traffic Security (21) Clear Sight Lines
(20) Personal Security (22) Sense of Security
Destinations: (21) Recreational (22) Essential
(23) Administrative
Lateral Separation: (24) Shoulder Lane (12) Sidewalk Buffer Table 3.
Table 3. contd.
Others: (25) Land Use Mix (13) Other Development (23) Odor, Ventilation
(26) Parcel Size (14) Pedestrian Classification (24) Noise, Crowding, absence of concealed area (27) Topography (15) Pedestrian Friendly Commercial Area (28) Compactness (16) Parkways (29) Shade and Rain
Cover (17) Pedestrian Plaza (30) Weather/Climate
(31) Green-ways
(32) Trails
existing variable, or required spatial data currently not available, were not included in the study. Since this study investigates the communities at a distance of quarter and half-mile around the stations, the distance variables were not included. The non-objective data either required a detailed survey or audit of the communities and its individuals, which is not within the scope of this study. This study only uses the 32 variables that can be objectively measured using GIS that evolved from the review of 21 indices. Since this study analyzes communities around transit stations, availability of parking at stations is assumed to have a significant effect on people’s choice of walking to light-rail stations. Therefore availability of parking spaces at transit stations is used in addition to the 32 variables.
Thus, this study investigates, in a broader sense, the existing gap of influence of built-environment on walking to transit. Specifically, this study looks at the role of density, urban form, safety, residential compactness, and availability of destinations on walking to transit. Therefore this study investigates the built-environment in the communities around transit stations for its impact on walking to transit stations. Identifying the specific built-environment constructs and investigating its impact on walking to transit will help propose design interventions to increase walking to transit stations.
Section - III
Objective Measures of Built-Environment
Until recent, most studies that have objectively measured the built-environment did not use GIS. Most of these studies either used self-measured environmental correlates or conducted audits to objectively measure, store, and analyze the effect of built-environment on walking. Aggregated level of information was used by studies that used GIS for objective measure of built-environment. One of the primary reasons for this was unavailability of physical environment data at disaggregated level. With recent improvements in technology to create and store data at disaggregate level, studies have used GIS for objective measure of built-environment (Aultman-Hall et al 1997, Moudon et al 1997, Rodriguez and Joonwon 2004, Frank et al 2005, Lee and Moudon 2006a). Bauman et al encourage the use of GIS system because GIS-derived measures can help overcome some of the methodological problems of reliance on self-reported
environmental factors. Studies have reported that self-reported measures have shown to have lesser reliability compared to objective measures derived using GIS.
Various theoretical and empirical studies report that environment affects walking within the communities. A huge inventory of variables that can measure the effect of built-environment on walking has been developed (reviewed in the earlier section of this chapter). Though some or large number of these variables are currently being investigated for its influence on walking, standard methods of measuring these (objective) variables has not been developed and used. Forsyth et al. (2006) reported that “measures developed in urban geography, planning, and transportation may not be relevant to research on physical activity, and public health researchers are not always aware of the problems with physical environment data.” So no standard approaches exist to measure the objectively measurable data in GIS. The following section of literature will review some of the existing literature that has used objective measures of built-environment using GIS at community level in their analysis.
Aultman-Hall et al (1997) used GIS to analyze design-based approach to evaluate neighborhood pedestrian accessibility. They evaluate accessibility to various destinations by walk with an assumption that if neighborhood can be designed with destination within walking distances for its residents, a diversion to walking can be achieved. They thus targeted the land-use and connectivity of the environment in their alternate designs for the community. They proposed a redesigned plan as an alternative to the original development layout. The redesigned plan included increased housing density (26.5 to 35 units/ha) and introduced commercial destinations with decreased total area of
development (19.3 to 15.6 ha). Using GIS they evaluated the average walking distances to schools, transit stops, and open spaces.
Evaluation of Distance in GIS
Distances were evaluated using network coverage using the centerline of the roads and pathways and connected to center (node) of lots or properties using a dummy link. GIS macro programs were used to calculate the shortest walking distance to various destinations in the original versus redesigned community. The current available version of network analyst extension in ArcGIS 9.2 can help perform this function readily and is easily transferable for all types of data. Nonetheless, this could be tedious process when the area under study has large number of parcels included in its analysis.
While the study by Aultman et al looked at measuring distances with varying land-use and connectivity communities, the study by Moudon et al (1997) analyzed 12 communities in Puget Sound area in Washington State. Their study analyzed the effects of site design on pedestrian travel by evaluating the pedestrian network connectivity and its effect on pedestrian activity. They conducted evaluation of the 12 neighborhood and compared its land-use mix, population density, Income, Auto-Ownership, and amount of retail services for four groups of urban and suburban setting. Using GIS, characteristics of street and pedestrian facilities, completeness and relative safety of pedestrian facilities and directness of pedestrian routes were analyzed with pedestrian-trip volume. Urban sites with higher population density (34.3 versus 31.5 in suburban) reported higher pedestrians/hour and better sidewalk completeness (42% more).
Evaluation of Neighborhoods in GIS
Socio-demographic data such as income, vehicles per household and population density data were derived from the census at block or block-group (income) level. An aerial photos analysis with field survey was used to evaluate the intensity, distribution, physical shape, form, and type of commercial land-uses (retail uses) in the 12 communities. Independent variables mentioned in the earlier sub-section were also obtained through analysis of aerial photos complemented by field work. Completeness of pedestrian facilities was measured by computing the ratio of total length of sidewalk to the total length of block or street). Route directness was measured by the ratio of actual route distance to a straight-line distance. Their study does not report the exact methodology used to evaluate distances but informs about the process of data gathering for neighborhood based analyses related to walking.
A study conducted by Rodriguez and Joonwon (2004) investigated the role of physical environment not just on walking, but all modes of non-motorized mode of travel within the university campus of University of North Carolina, Chapel Hill. Their study used GIS analysis to determine the density, travel time, presence of walking and biking paths, sidewalk availability, and local topography. Their study compared multimodal travel mode choice using one-level logit, nested logit, and a heteroscedastic extreme value model. Topography reported significant negative coefficient with people’s probability to walk or bike. Existence of sidewalk increased the odds of walking or using transit. Residential density reported a negative coefficient with use of transit.
Evaluation of Physical Environment in GIS
Travel time used in the analysis of mode choice was computed by evaluating the fastest route to the campus. To do so, the vehicles were assumed to travel at the posted speed limits on the streets. Gross population density was calculated at the block group level from the 2000 US Census. Local physical environment such as walking and cycling paths and sidewalk availability were extracted from digital orthophotographic images at 1-m resolution and 1:1200 scale created in 1998. Slope was calculated using the topographic (contour) maps obtained from the images. The presence of sidewalk on only one side was treated the same as the presence of sidewalks on both sides.
A recent study by Frank et al (2005) rightly reported that to date, almost all studies that have analyzed environment have used perceived measure of built-environment. Objective measure on the other hand, can be more reliable and thus needs to investigate in its use for assessment of built-environment. They developed a walkability index that used objective measures in GIS of land-use mix, residential density, and street connectivity. He measured the urban-form of the neighborhoods using the walkability index and reported that neighborhoods with high walkability reported 2.4 times of more activity than those in the low walkability neighborhoods. Therefore, policy interventions that encourage the improvements of neighborhood urban-form can help increase activity such as walking and biking.
Walkability Index in GIS
The three measures used to develop the walkability index were the residential density, street connectivity, and land-use mix. Residential density was measured at the block-group level using the 2000 census data. The net residential area was calculated using the land cover data from the aerial images. Therefore, the residential density was measured as the ratio of number of households for the amount of land in residential use. Street connectivity was measured as the number of intersection per kilometer of road network. The street center-line file was used to evaluate the total kilometers of road network. Land-use mix was measured as “evenness of distribution of square footage of residential, commercial, and office development”. Parcel-level data was used to evaluate the percent footage for each of the land-uses and the land-use mix calculated using the following formula:
Land-use Mix = p- Proportional footage of each land-use
n- Number of land-uses
A recent study by Lee and Moudon (2006a) addressed the challenges faced by earlier studies in quantifying the relationship of non-motorized travel and transit use which is the difficulty to acquire precise data for non-motorized travel and micro-environment. A large number of micro-level attributes of land-use and urban form measured using a custom-made GIS tool were used in their analysis including density, street length, intersection density, volume and speed of vehicles, and groups of destinations. To deal with the multi-collinearity of this huge inventory of
built- −
∑
( )ln( ) /ln( ) 1 n p p i n ienvironment measures, factor analysis was used to identify the clustering of variables. Destination, density, distance and route are reported as simple and effective alternatives to capture land-use mix and street connectivity.
Grouping Destinations in GIS
The purpose to group the destinations together was to examine if the clustered destinations are more attractive than individual destinations. Individual parcel database was used to identify the destinations within the eleven study areas such as Mixed-use, church, sports facilities, museum, grocery store, restaurant, office, and parks. Neighborhood clusters that evolved varied from common usages like just grocery and retail stores to diverse uses such as office, fast food restaurant, and hospital. Their study concluded that the parcel-level data in GIS benefits the investigation on walkability in the environment.
Lessons Learnt
The review of studies that have used GIS to objectively measure the built-environment guides the developed of various measures identified from the review of pedestrian indices. Measures such as land-use mix, density, and urban form variables such as the pedestrian features (sidewalk) reviewed in this section were used to measure the built-environment variables for this study. The GIS data used for this analysis were extracted from aerial images replicating the method similar to the one used by Rodriguez (2004) in his study. Land-use mix formula used by Frank et al was used to measure the land-use mix for this study as well. Density was measured at block-group level, similar to one
used of Aultman-Hall in their study. The destination were grouped as little different from the one used by Lee and Moudon. Their grouping was not based on any specific type of use of that destination. For example, the restaurants and offices were grouped together for one of their study area. These two destinations serve different purpose of walking. Therefore based on the purpose of walking to the destinations, this study groups the destinations into three (1) Recreational destinations, (2) Administrative destinations, and (3) Essential destination. A detailed description of what exact uses are categories under each of these subgroups will be discussed in the next chapter. Therefore to support community based interventions for promoting physical activity such as walking, it is essential to develop systems that are more responsive to data needs at the local level (ie., city, county, or neighborhood) (Brownson et al. 2001). Geographical Information Systems (GIS) can help develop such a system.
As indicated in the study by Lee and Moudon, large number of built-environment variables in a single analysis can result in the problem of multi-collinearity. Therefore, to avoid the problem of collinearity among the measures used this study, principal component analysis was performed to investigate the clustering of these variables. The next chapter describes the methodology used to investigate the objectives of this research.
CHAPTER III METHODOLOGY
Introduction
The analysis for this dissertation is divided in two sections. The first section delineates the development of objective measures of built-environment variables in Geographic Information Systems (GIS) and the second to perform inferential statistical analysis using principal component analysis and regressing the objective measures with walking to transit stations to determine its relation with the built-environment.
GIS has been an effective tool for evaluating walking accessibilities in neighborhood designs (Aultman-Hall, et al., 1997) and lately has been used to evaluate the built-environment in recent studies (Pikora et al, 2002; Troped et al., 2001). This study builds on the existing built-environment measures in GIS and uses the spatial data developed by North Central Texas Council of Governments (NCTCOG). DART mobility analysis report (Regional Mobility Initiatives, 2003) aims to develop or improve walking to transit stations and has therefore created and stored an extensive spatial database, which were used to study the pedestrian built-environment around its light-rail transit stations.
Conceptual Framework and Hypothesis
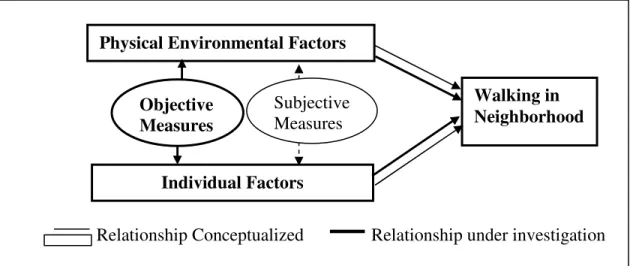
Pikora et al (2003) conceptualized the two main factors that influence walking in neighborhood. Their study identified physical environmental factors and individual
factors as two main determinants of walking. This study adds to the conceptual model by including the objective measures of both physical environment and individual factors such as amount of sidewalk, road network, demographic of the study population and subjective measures of physical environment and individual factors such as perception of environment and preference of individual in the community (Figure 3).
This study investigates the objective measures of built-environment, which includes both the physical environment and individual characteristics. The objective measures that can be quantified in GIS needs to be conceptualized for three reasons: (1) measures developed in GIS can be cost and time effective, (2) GIS based measures can easily be standardized and replicated across studies, and (3) common measures comparable across studies can help make better policy based decisions (Figure 3).
Therefore conceptualizing the objective measures of the physical and individual measures in GIS reveals three distinct characteristics: (1) Locational Characteristics, (2) Segmental Characteristics, and (3) Areal Characteristics.
• Locational characteristics most commonly include point features in GIS such as
intersection, pedestrian-vehicle accidents, street lights, etc.
• Segmental characteristics include sidewalk characteristics such as sidewalk
length and width, greenway and trail, etc
• Areal characteristics include polygon based features such as land-use,
Relationship Conceptualized Relationship under investigation Schema of type of physical environmental factors that may influence walking in neighborhood
Adapted and Modified from Pikora, Corti, et al., 2003. Social Science & Medicine (56).
Objective Measure of the Built-Environment in GIS
Figure 3. Conceptual framework of walking using GIS measures Locational Characteristics Point Features Intersection Features Pedestrian-vehicle accidents Criminal activities Street lightings Segmental Characteristics Line Features Sidewalk Characteristics Road Features Traffic Volume Greenways and Trails Areal Characteristics Area Features Demographics Destinations Weather/Climate Topography Walking Physical Environmental Factors
Individual Factors Walking in Neighborhood Objective Measures Subjective Measures
These characteristic can be quantified to understand their influence on walking in general. This study develops these measures in GIS to investigate its influence on utilitarian trips, specifically, walking to transit. The central hypothesis will be tested and the objectives of this study achieved by pursuing the following specific aims:
• What built-environment characteristics in communities around transit stations
function together as constructs of the physical environment?
Hypothesis 1: The characteristics of built-environment function together to define constructs of physical environment that affect walking.
• Do constructs of the physical environment in communities around transit stations
affect walking to transit?
Hypothesis 2: The built-environment constructs positively affect the percentage of people walking to transit stations for all trips.
Research Design
Study Area
Dallas county is one of the 16 counties in the NCTCOG with a population of about 2.2 million (US Census, 2000) and a median income of around $43,000. Dallas County hosts the majority of 93 miles of light rail system and 35 miles of commuter rail system operated by DART. Currently, DART LRT serves 34 destinations with well connected bus service within the Dallas County and averaged 59,292 riders per weekday in 2005. DART has also encouraged various transit-oriented development around its LRT stations and has attracted extensive private investment to improve communities around stations.
The City of Dallas, NCTCOG, and DART has assessed the built-environment around transit stations to create an inventory of data that could increase accessibility to stations by walk and biking. For this research, spatial data from the NCTCOG were used to study the built-environment around the 20 DART transit stations that were already in operation in 2000.
Unit of Analysis
A study conducted by Lee and Moudon (2006b) determined that the 1km or 0.6 mile distance is walkable distance. Other studies by Moudon, et al (2002), Sullivan and Morrall (2002) identified close to 0.5 miles as a walking distance which is equal to 15-20 minutes of walking. Sullivan and Morrall looked at the walking distances to and from the calgary LRT stations. Transit-users who walked to and from the stations were asked to locate an approximate point of origin or destination. Distances measured from the maps indicated that the average walking distance to suburban stations is 649m and a CBD station is 326m. The walking distance guidelines used or proposed by most American cities with light-rail transit ranged from 457m (by Niagara Frontier Transportation Authority , Buffalo) to 804m (by New Jersey Transit, Newark). This study indicated that people walk farther to reach LRT stations when compared to walking to bus stop stations. Though various studies have identified various distances capable to walk, this study takes a conservative approach and analyzes communities within a distance of 0.5 miles. Also, Healthy People 2010 (USDHHS, 2000) hopes to increase trips by walking, by at least 50%, for trips made by adults that are less than 1
mile. Therefore, the unit of analysis is quarter and half mile around (n = 20) DART light rail stations.
Figure 4. Unit of analysis: Quarter-mile and half-mile airline distance buffer from transit station
However, the built-environment measures observed at the half-mile distance were inclusive of the built-environment within quarter-mile distance. As stated earlier in chapter I, this study was conducted with a premise to develop two indices that identifies appropriate intervention at community level. Since the perception of individuals walking
Quarter-Mile Distance
from half-mile distance to the transit station would be influenced by the built-environment within the quarter-mile distance, this study measured the built-built-environment up to half-mile distance. However, using measures of built-environment at every quarter-mile and analyzing its impact on walking to transit could provide information regarding the role of each built-environment construct specific to each quarter-mile distance from station (Figure 4).
Study Design and Variables
Data Analysis
Existing indices that measure pedestrian environment were reviewed to develop an inventory of comprehensive pedestrian measures. The existing 21 pedestrian indices from the literature were reviewed to identify 73 variables in total (Appendix A). These included both objective and subjective measures obtained through survey, site analysis, spatial data analysis, and other existing database. This study aims to objectively measure built-environment using spatial data. Based on these criteria the total number of variables was narrowed down to 32 variables.
The 32 listed variables (spatial) are used to check the influence of built-environment on walking to transit. Each of these variables was measured for a quarter and half mile around each station. It is important to look at the relation or influence of the above listed variables on walking to transit. It is also important to determine directionality of each variable (positive or negative influence) on walking to transit. To