Boston University
OpenBU http://open.bu.edu
Theses & Dissertations Boston University Theses & Dissertations
2014
A random forest approach to
segmenting and classifying
gestures
https://hdl.handle.net/2144/15405 Boston University
GRADUATE SCHOOL OF ARTS AND SCIENCES
Thesis
A RANDOM FOREST APPROACH TO SEGMENTING AND CLASSIFYING GESTURES
by
AJJEN JOSHI
B.A., Connecticut College, 2012
Submitted in partial fulfillment of the requirements for the degree of
Master of Science 2014
c
2014 by
AJJEN JOSHI All rights reserved
First Reader
Stan Sclaroff, PhD
Professor of Computer Science
Second Reader
Margrit Betke, PhD
Acknowledgments
I gratefully acknowledge the advice and guidance of my co-advisors Prof. Stan Sclaroff and Prof. Margrit Betke, as well as the support of the members of the Image and Video Computing Research Group at Boston University. I am grateful to Camille Monnier of Charles River Analytics for being a good source of practical advice. I also express my gratitude to my parents for their infinite love and support.
This work was supported in part by National Science Foundation grant IIS-0910908 and Taxiing Operations via Gesture Understanding (TOPGUN) grant 50202047, subcontract to Charles River Analytics, Inc.
CLASSIFYING GESTURES AJJEN JOSHI
ABSTRACT
This thesis investigates a gesture segmentation and recognition scheme that employs a random forest classification model. A complete gesture recognition system should localize and classify each gesture from a given gesture vocabulary, within a continuous video stream. Thus, the system must determine the start and end points of each gesture in time, as well as accurately recognize the class label of each gesture. We propose a unified approach that performs the tasks of temporal segmentation and classification simultaneously. Our method trains a random forest classification model to recognize gestures from a given vocabulary, as presented in a training dataset of video plus 3D body joint locations, as well as out-of-vocabulary (non-gesture) instances. Given an input video stream, our trained model is applied to candidate gestures using sliding windows at multiple temporal scales. The class label with the highest classifier confidence is selected, and its corresponding scale is used to determine the segmentation boundaries in time. We evaluated our formulation in segmenting and recognizing gestures from two different benchmark datasets: the NATOPS dataset of 9,600 gesture instances from a vocabulary of 24 aircraft handling signals, and the CHALEARN dataset of 7,754 gesture instances from a vocabulary of 20 Italian communication gestures. The performance of our method compares favorably with state-of-the-art methods that employ Hidden
Markov Models or Hidden Conditional Random Fields on the NATOPS dataset. We conclude with a discussion of the advantages of using our model.
Contents vii List of Tables ix List of Figures x 1 Introduction 1 1.1 Overview of Formulation . . . 7 1.2 Statement of Problem . . . 10 1.3 Contributions . . . 11 1.4 Overview of Thesis . . . 11 2 Related Work 14 2.1 Gesture Spotting . . . 14
2.2 Nearest Neighbor Models . . . 16
2.3 Hidden Markov Models . . . 17
2.4 Hidden Conditional Random Fields . . . 18
2.5 Decision Tree and Forest models . . . 18
2.6 Feature Engineering . . . 19
2.7 Summary . . . 21
3 Decision Trees and Forests 22 3.1 Decision Trees. . . 22 3.1.1 ID3 . . . 23 3.1.2 C4.5 . . . 24 3.1.3 CART . . . 24 3.2 Random Forests . . . 25 4 Formulation 27 4.1 Training . . . 27 4.1.1 Input . . . 27 4.1.2 Feature Extraction . . . 28 4.1.3 Gesture Representation . . . 30
4.1.4 Random Forest Training . . . 31
4.2 Testing . . . 34
4.2.1 Multi-scale sliding window classification . . . 35 5 Datasets 39 5.1 NATOPS . . . 39 5.2 CHALEARN . . . 40 6 Implementation Details 42 7 Experimental Results 45 7.1 NATOPS . . . 45 7.1.1 Results . . . 47 7.2 CHALEARN . . . 51 7.2.1 Results . . . 53
8 Conclusion and Future Work 59 8.1 Discussion . . . 59
8.2 Strengths and Weaknesses . . . 61
8.3 Future Work . . . 62
7.1 Average Classification accuracy on all 24 gestures . . . 47
7.2 Performance comparison with baseline approach. . . 47
7.3 Performance comparison on pairs of similar gestures with other approaches. The HMM, HCRF, and Linked HCRF results were presented by Song et al. [1].. . . 49
7.4 Average classification accuracy on all 20 gestures . . . 54
7.5 Binary classifier vs Multiclass classifier . . . 54
7.6 Effect of increasing the number of trees in the random forest on average classification accuracy . . . 54
7.7 Effect of increasing the number of features used to split a node in the random forest on average classification accuracy. . . 54
7.8 Jaccard Index scores . . . 58
List of Figures
1.1 Deck officer onboard an aircraft carrier performing a NATOPS gesture to
direct a navy aircraft pilot . . . 2
1.2 Pipeline view of gesture spotting framework . . . 3
1.3 Pipeline view of gesture classification framework . . . 3
1.4 Pipeline view of framework where gesture segmentation is followed by classification. . . 4
1.5 Pipeline view of framework where gesture segmentation and classification is performed simultaneously . . . 4
1.6 Overview of Formulation . . . 8
4.1 Random Forest Training . . . 28
4.2 Multi-scale Sliding Window Classification . . . 36
5.1 RGB, Depth, and User-Mask Segmentation of a subject performing ges-ture 1 ’I Have’ in the NATOPS dataset . . . 40
5.2 RGB, Depth, and User-Mask Segmentation of a subject performing ges-ture 1 ’sonostufo’ in the CHALEARN dataset . . . 41
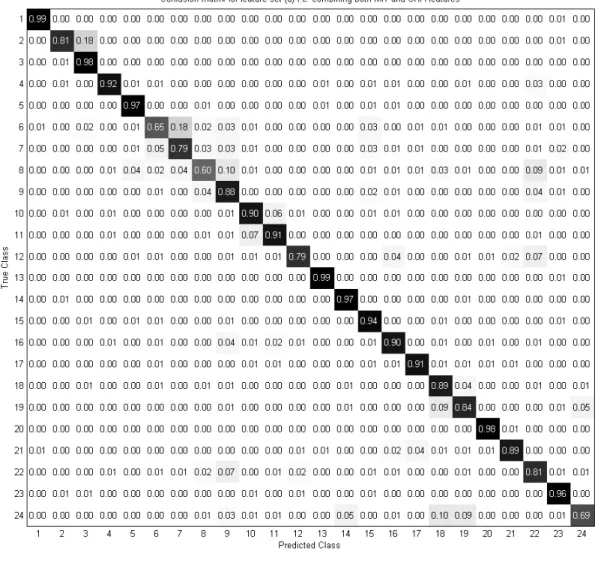
7.1 Confusion Matrix for feature set (d) i.e. combining both MIT and CRA features . . . 48
7.2 Examples of gesture pairs which have similar motional structure but differ in handshapes. . . 50
7.3 Confusion Matrix for pairs of similar gestures in the dataset . . . 51
7.4 Confusion Matrix for feature set (b) . . . 55
7.5 Number of misclassifications in the training set while iterative training of random forest . . . 56
7.6 Average Jaccard index score of classifier while iterative training of random forest . . . 57
Introduction
The problem of spotting and recognizing meaningful gestures has been an important research endeavor in the fields of computer vision and pattern recognition. Research in this domain has a broad scope of applications such as recognizing sign-language symbols, enabling video surveillance, establishing new idioms in gaming and entertainment, and developing new modes of human-computer interaction, among others.
A specific example of a gesture recognition application can be explored in the setting of a flight deck of an aircraft carrier. Deck officers use a vocabulary of gestures to communicate commands such as “All clear,” “Move ahead,” “Turn left/right,” “Slow down” etc. to aircraft pilots (Figure 1.1). However, the advent of unmanned air vehicles (UAV) has engendered the need to create a system capable of communicating the same set of commands to these unmanned aircrafts. Equipping a UAV with a computer vision system capable of accurately and automatically recognizing the existing set of gestures while they are being performed by deck officers would provide the most efficient solution to this problem, as it would permit the continued operation of the current method of communication.
2
Figure 1.1: Deck officer onboard an aircraft carrier performing a NATOPS gesture to direct a navy aircraft pilot
Another example of an application in gesture recognition lies in the domain of under-standing the context provided by communication gestures. Human beings communicate with words as well as gestures. A computer vision system capable of deciphering the gestures used in specific languages, such as Italian, can provide contextual information that aids the task of translating a foreign language.
Accurate segmentation and recognition of temporal events, such as speech and gesture, has long been an active field of research in computer vision and machine learning [2], [3], [4], [5], [6], [7], [8], [9], [10], [11]. Gestures have always been an important part of human-to-human communication and are increasingly becoming an essential mode of interaction between humans and computers. Human gestures typically involve articulated movement of a number of body parts in order to convey a particular message. Technology that facilitates efficient recognition of natural human gestures can bridge the divide that exists between human-human interaction and human-computer interaction. For example, an application that requires communicating with a robot might require
Figure 1.2: Pipeline view of gesture spotting framework
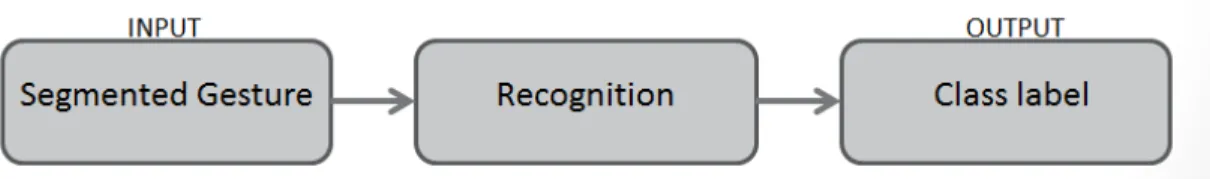
Figure 1.3: Pipeline view of gesture classification framework
gesture recognition. Using gestures makes the task of conveying commands to a robot natural and intuitive, and prevents the need for a user to learn a more esoteric mode of communication. A computer-vision approach to recognizing these gestures would require the robot to first recognize the human, track features associated with the gesture being performed while determining when the gesture starts and ends, and correctly classify the gesture.
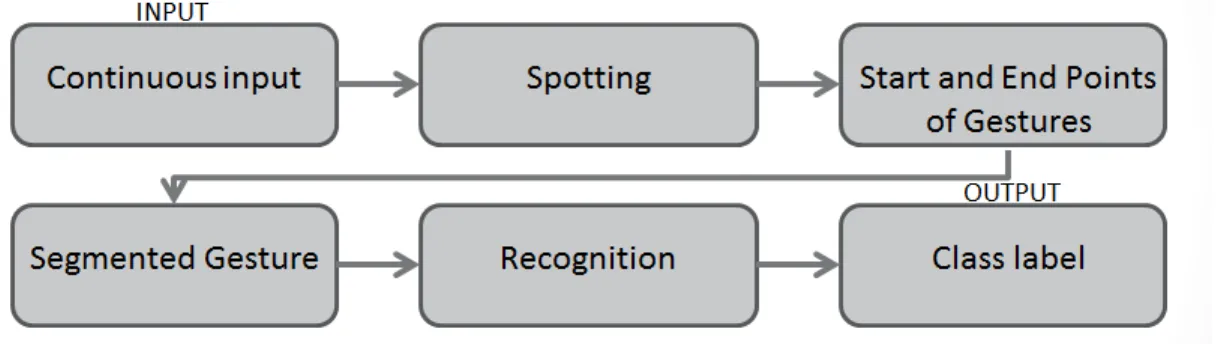
A computer-vision system must first spot the gesture (Figure 1.2) in order for it to classify the gesture (Figure 1.3). In other words, it is important that the start and end points of a gesture be accurately identified in a temporal stream, in order to maximize the probability of correctly estimating the gesture label. A common approach in solving the segmentation and classification problem involves separating them into two-subproblems where the task of segmentation precedes the task of recognition (Figure 1.4). In this method, the focus is on first finding the gesture segmentation boundaries in time. The
4
Figure 1.4: Pipeline view of framework where gesture segmentation is followed by classification
Figure 1.5: Pipeline view of framework where gesture segmentation and classification
is performed simultaneously
candidate gestures produced by the segmentation algorithm is then classified. One of the limitations of this approach is the dependence of classification on segmentation: a good gesture classification algorithm will fail to yield desirable results if the segmenta-tion algorithm is inaccurate. Another disadvantage of this method is the difficulty in distinguishing contiguously occuring gestures. That is, the task of segmentation is easy when gestures are separated by intervals of gestural silence (the absence of movement). However, many real world problems involve continuous gesturing, when a gesture is quickly followed by another, or when a gesture transitions into another. Another issue that makes the task of segmentation difficult is the presence of gestures that are not part of the vocabulary of the system.
Ours is a unified approach that simultaneosly performs the tasks of segmentation and classification (Figure 1.5). In methods such as ours, gesture intervals for which above-threshold scores are given by the classifier are deemed to be the labeled and segmented gesture. Thus, we attempt to design a framework capable of automatically and accu-rately spotting and classifying gestures present in a set of test videos, given a training set of multi-modal videos with multiple examples of all gestures in a gesture vocabulary.
We take a random forest approach to creating a fast and accurate classifier. Random forests are an example of an ensemble method, where multiple classifiers engage in a voting strategy to provide the final prediction. An example of an ensemble is a forest of decision trees, where each tree casts a vote, and the predicted label corresponds to the class with the most number of votes. Decision trees are predictive models that are used for regression as well as classification problems. The structure of decision trees depends on the observations provided while building the tree. A measure is defined in order to generate branches based on some features of the observations. The leaves of a tree store class labels, which correspond to the path of branches from the root to the leaf.
While creating a tree ensemble, the designer of the classifier must formulate a method to choose the samples used to build the tree, as well as select features to create the best split on an internal node. In a random forest, each tree is built from an independently and randomly sampled subset of available observations. That is, a random sample of the training set is chosen with replacement, and used to build a decision tree. At each node of a tree, a fixed-size random subset of features is chosen out of all available features,
6
and the feature on this subset that best separates the data is selected to split the node. Additionally, the trees are not subject to pruning, i.e. each tree grows to the largest extent possible. During classification, a new object is classified by all decision trees of the forest, and the forest outputs the class label that receives the maximum number of votes.
Random forest models perform well in many classification tasks, work efficiently on large datasets, and are very fast. Random forests have been applied to good effect in real-time human pose recognition [12], object segmentation [13], and image classification [14] among others. Decision forests models have also been used variedly in action recognition tasks [10], [15], [16]. Many works dealing with spatiotemporal signals, such as gestures, employ graphical models such as Conditional Random Fields (CRFs) [17], [11], [1] and Hidden Markov Models (HMMs) [18], [19], [5] in order to model relationships and variations in both the temporal and spatial domains. It can be argued that long-range temporal dependencies that gesture signals exhibit, which can be captured in graphical models, are difficult to store in random forest models. However, we show that taking a random forest approach in gesture classification tasks can be beneficial because they are often simpler to implement and easier to train than graphical models, while providing a comparable (and in some cases, better) accuracy in recognition.
1.1 Overview of Formulation
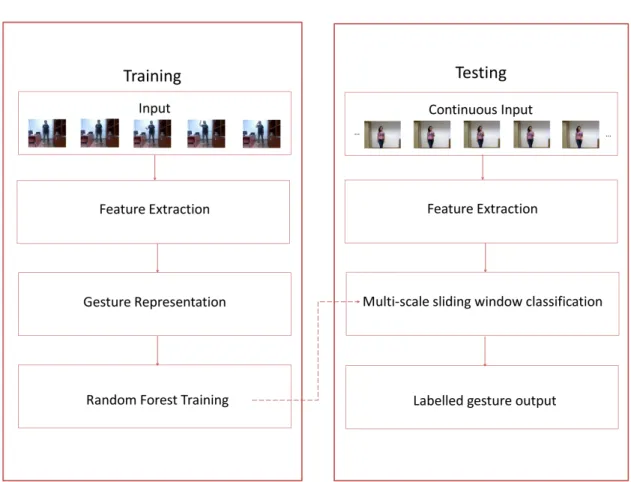
Given a dataset consisting of examples of gestures from a given vocabulary we first train a classification model. Because the datasets which we have worked on have been recorded with 3D sensors such as the Microsoft Kinect, each frame in the dataset videos contain RGB as well as skeletal information. That is, gesture examples are contained in RGB videos, which are accompanied by corresponding depth videos, and user segmented videos. Moreover, skeleton information for the user in each frame of all videos of the dataset is also provided. While testing, the model must accurately discern the start and end points of a gesture from a continuous video stream, and correctly classify the class label. The model must also be able to generalize well to variations in the user (size, gender, distance to camera) and the environment (background, lighting).
While training a random forest model, we need to first collect features that provide a good description of the gestures. We compute both joint-based features (such as positional and angular velocities of important joints) as well as image-based features, such as Histograms of Oriented Gradients (HOG), and Histograms of Optical Flow (HOF). Thus, each frame of every video example in the dataset is numerically described by a vector of joint-based and image-based features.
During training, we use the temporal segmentation information that is available to produce a uniform description for every gesture example. Each gesture is described by the feature vectors corresponding to each frame from its start point to its end point. In order to create a feature descriptor of uniform length for each gesture example, we
8
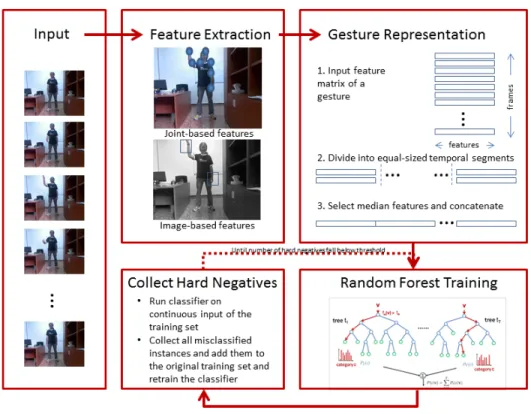
Figure 1.6: Overview of Formulation
compress the feature representation into a single, combined feature vector. We achieve this by first smoothing all features using a moving average filter, dividing the gesture into 10 equi-length temporal segments, and representing each temporal segment with a vector of the median elements of all features. The representative vectors of each temporal segment is then concatenated into a single feature vector. This ensures that all gestures are described by a feature vector of the same dimension, despite the fact that most gestures are of varying length.
that do not contain gestures in the system vocabulary, to train our random forest model. Thus, our classification model is trained to recognize not only the gestures that are part of the vocabulary, but also intervals of gestural silence and gestures that are out-of-vocabulary.
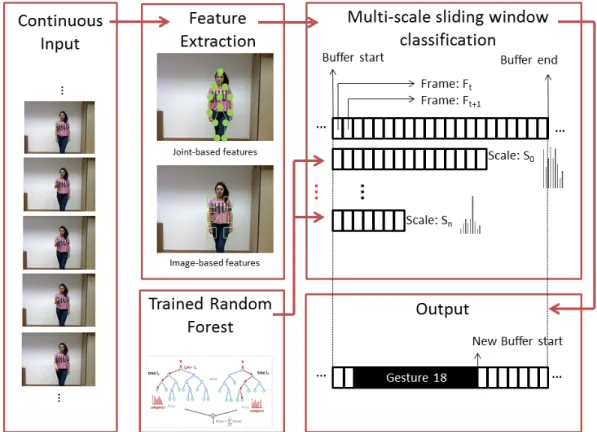
During testing, we use a multi-scale sliding window approach to spot and classify ges-tures. That is, given an input video, we compute features in a similar way as was done during training, at different temporal scales. That is, feature descriptions of candidate gestures are computed for different gesture lengths beginning at the start of the slid-ing window. Each of these gesture candidates are classified by our previously trained random forest model, and the gesture candidate most confidently classified is chosen to be our predicted value. The temporal scale at which the candidate is chosen helps determine the segmentation of the gesture. Thus the sliding window is moved so that its starting position coincides with the end of the classified gesture (or non-gesture) and the process is repeated until we reach the end of the input video.
We choose to use a direct classification method over temporal state-space models such as HMMs and HCRFs. A direct classification approach, such as the random forest classifier used by Nowozin et al. [20] in the online detection and recognition of action points, treats the gesture segmentation and recognition problem as a classification problem on a sequence of frames. We employ a single multi-class random forest classification model in our framework. Using a single classifier capable of effectively recognizing all gestures from the vocabulary as well as distinguishing intervals that do not contain gestures
10
prevents the necessity of separately training and combining multiple classifiers such as support vector machines (SVM) [21]. In order to account for the variability in the length of different gestures in the dataset, our framework divides gestures into a fixed number of equal-sized temporal segments, computes a representative feature vector for each segment and concatenates them to create a uniform feature descriptor. This allows our system to accurately classify gestures of arbitrary length unlike methods which attempt to perform classification by operating on a fixed number of frames [22]. Our system also fuses joint-based features with image-based features computed at every frame. This choice distinguishes our system from methods that use a bag-of-features representation [21] to construct uniform-length feature descriptors for spatio-temporal objects such as actions and gestures.
1.2 Statement of Problem
We assume that the input to our gesture segmentation and classification framework consists of a training set of videos that contain multiple examples of all gestures in the vocabulary along with their corresponding temporal segmentation and class labels. We also assume the availability of multi-modal (RGB, depth, skeleton) data from which features can be extracted and fused.
Given a set of multi-modal videos with multiple examples of all gestures in a gesture vocabulary, the problem we aim to solve is to design a framework that is capable of
automatically and accurately spotting and classifying gestures present in a set of test videos.
1.3 Contributions
The key contributions of this thesis are:
• the design of a simple framework that employs a single multi-class random forest classification model to distinguish gestures from a given vocabulary in a continuous video stream,
• the fusion of joint-based and image-based features to create an accurate feature representation of gestures that is robust to variations in user height, distance of user to sensor and speed of execution of gesture, and
• the creation of a uniform feature descriptor for gestures to account for the variabil-ity in their length by division of gesture into a fixed number of temporal segments followed by the concatenation of the representative feature vectors of each temporal segment.
1.4 Overview of Thesis
In Chapter 1, “Introduction,” we have presented the problem that is being solved and provided examples of real-world applications of gesture recognition. We have provided
12
a summary of the formulation used in our solution, and have given a description of the outline of the thesis.
Chapter 2, “Related Work” presents research work related to the problem of gesture segmentation and recognition, with a focus on those works that are relevant to our formulation. In this chapter, similar approaches to the problem are grouped, and their strengths and weaknesses are analyzed.
Chapter 3, “Decision Trees and Forests” provides a detailed mathematical description of the construction of decision trees and decision forests, and describes some of the problems in which they have been used. It explains the advantages and disadvantages of using a single decision tree, and why ensembles of randomized decision trees perform better in many tasks.
Chapter 4, “Formulation” explains the details of our formulation. It describes the pro-cesses of feature extraction, gesture representation, as well as, the procedures involved in training the random forest classifier. It then provides a description of how the trained classifier simultaneosly segments and classifies gestures from a continuous video stream during test time.
In Chapter 5, “Datasets” we describe the two datasets on which we have tested our methods. The datasets include: (a) the NATOPS dataset of 9,600 gesture instances from a vocabulary of 24 aircraft handling signals, and (b) the CHALEARN dataset of 7754 gesture instances from a vocabulary of 20 Italian communication gestures.
In Chapter 6, “Implementation Details,” specifications of our code in Matlab and Python are provided. Our experimental setups are described. In this chapter, the evaluation methods and metrics used to measure the performance of our system are reported, and the reasons for their choosing are explained.
Chapter 7, “Experimental Results” elucidates the results of our experiments on the various datasets with the help of figures and tables. In this chapter, we provide evidence of the experiments conducted in deciding the optimal parameters of our system, as well as compare our results with the work of others on the same or similar datasets.
Finally, in Chapter 8, “Conclusion and Future Work,” we conclude with a discussion of the strengths and weaknesses of our methodology, and explore various possibilities that might yield an improvement in our system.
Chapter 2
Related Work
Spotting and classifying human gestures is an important research endeavor in the fields of computer vision and pattern recognition, and there is an extensive literature explaining the multitude of approaches taken in solving many variants of this problem. Research in this domain has a broad scope of applications ranging from recognizing sign-language symbols [? ], [23], [24] to developing new modes of human-computer interaction [25], [26], [27]. Here, we list and briefly explain some of the important methods that have been used in practice and are relevant to our work. A more comprehensive survey of gesture recognition techniques can be found elsewhere [28], [7].
2.1 Gesture Spotting
Although our methodology consists of a combined approach to segmenting and classify-ing gestures, there are methods which decouple them into separate problems: first spot the gesture from a continuous stream, and then classify the candidate gesture. Alon et al. [29] used continuous Dynamic Programming with pruning, using Dynamic Time Warping (DTW) distances to find input segments that best match a gesture. Junker
et al. [8] used the sliding window and bottom-up algorithm introduced by Keogh et al. [3] to find candidate gesture segments. Yang et al. [30] used a cascade connection of gesture Hidden Markov Models (HMMs) and a gesture transition HMM, in order to model gestures as well as non-gestural movements that often occur when transitioning from one gesture to another. Zhu et al. [4] used motion differencing between frames of isolated hands, and outputted a sequence of frames in which the measurement of the motion satisfies certain constraints as candidate hand gestures. Kang et al. [31] generated candidate gesture segments using the following set of constraints: abnormal velocity in the temporal domain, or the presence of a static gesture or high curvature values in the spatial domain. Oka et al. [2] enumerated several spotting schemes for continuous data such as speech and gesture. Betke et al. [32] used a system of two buffers to store input spatio-temporal patterns and processed them to create pattern segments in a fixed-size bounding box, which was then classified by a neural network classifier.
Many of the listed gesture spotting methods work by detecting abrupt changes in motion features. One of the disadvantages of such methods is the difficulty in detecting gestures that occur without non-gestural intervals, that is when one gesture immediately suc-ceeds another without the presence of an interval of gestural silence. Another difficulty associated with this model is its propensity to detect a lot of out-of-vocabulary gestures. Methods that simultaneously perform segmentation and classification determine gesture boundaries by finding intervals within a continuous stream which receive high classifi-cation scores from the classifier. In the rest of this section, we briefly summarize some
16
of the popular methods used for gesture classification:
2.2 Nearest Neighbor Models
A k-nearest neighbor (k-NN) approach has been widely implemented in the task of classifying gestures. A nearest neighbor classification algorithm classifies input points based on its proximity with training examples in feature space according to some distance measure. It is a type of instance-based learning algorithm where computation is deferred until classification, and is one of the simplest machine learning algorithms. In k-NN, an input point is assigned to the class most common among its k nearest neighbors. Malassiotis et al. [33] used a k-NN classifier to classify static sign language hand gestures. A normalized cross-correlation measure was used to compare the feature vector of an input image with those in the k-NN model. Dynamic Time Warping (DTW) distance is another example of a distance measure, which can be used to compute a matching score between two temporal sequences, a variant of which was used by Alon et al. [6]. We employ a k-NN algorithm using DTW distances to create a baseline score while analyzing one of the datasets. K-NN methods are attractive because of their simplicity, but it is often difficult to define distance measures that clearly demarcate different classes of time series observations.
2.3 Hidden Markov Models
A Hidden Markov Model (HMM) is another popular tool in temporal pattern recognition, having been implemented in applications of speech recognition, handwriting recognition, as well as gesture recognition. It is a statistical Markov model. In an HMM, there are a number of states and a transition matrix that describes transitions between the states. An observation is made when a system is in a state. In an HMM, the state is not visible; only a sequence of observations and the output defined by the state is visible. While using HMMs for gesture recognition, the assumption that a first-order Markov finite state machine generates a gesture sequence is made. After the HMM has been trained, the most likely state sequence given the observation can be inferred. Chen et al. [5] provided a good example of the use of HMM in the hand-gesture recognition problem. They combined spatial and temporal features in order to represent each gesture by a feature vector, which served as parameters for the HMM. After the HMMs have been trained using training data from all input gestures, the gesture to be recognized was separately scored against all trained HMMs, the model with the highest score indicating the predicted gesture. In another example, Starner et al. [? ] employed an HMM-based system to recognize American Sign Language symbols. One difficulty while implementing HMMs is to determine an appropriate number of hidden states, which can be domain-dependent.
18
2.4 Hidden Conditional Random Fields
Conditional Random Fields (CRF), introduced by Lafferty et al. [34] is a discrimina-tive graphical model with an advantage over generadiscrimina-tive models, such as HMMs: they do not assume that observations are independent given the values of the hidden variables. Hidden Conditional Random Fields (HCRF) use hidden variables to model the latent structure of the input signals by defining a joint distribution over the class label and hidden state labels conditioned on the observations [35]. HCRFs can model the depen-dence between each state and the entire observation sequence, unlike HMMs, which only capture the dependencies between each state and its corresponding observation. Song et al. used a Gaussian temporal-smoothing HCRF [17] to classify gestures that combine both body and hand signals. They also presented continuous Latent Dynamic CRFs [11] to classify unsegmented gestures from a continuous input stream of gestures. They added a set of non-linear gate functions to the standard feature function of HCRFs [36] in order to help automatically learn a discriminative feature representation.
2.5 Decision Tree and Forest models
Decision forests have been applied in a variety of ways in problems related with classi-fying gestures. Miranda et al. [37] used a gesture recognition scheme based on decision forests, where each node in a tree in the forest represented a keypose, and the leaves of the trees represented gestures corresponding to the sequence of keyposes that consti-tute the gesture as one traverses down a tree from root to leaf. Gall et al. [10] used
Hough forests, which are an adaptation of random forests, to perform action recognition. In Hough forests, a set of randomized trees are trained to perform a mapping from a densely-sampled d-dimensional feature space into corresponding votes in Hough space. Yu et al. [15] utilized random forests to model the distribution of Space-Time Interest Points (STIPs) of different action types. During testing, each individual point matched the query class to generate a score for each action type. Choi et al. [38] employed a random forest structure to randomly sample variable volume spatiotemporal regions in order to select the best attributes for classification.
Reddy et al. [39] used a Sphere/Rectangle-tree to generate a feature-tree that used spatiotemporal features. During classification, each feature is classified into a gesture category and the final prediction is based on a voting mechanism. Demirdjian et al. [9] proposed the use of temporal random forests in order to recognize temporal events. Temporal random forests consist of temporal decision trees whose nodes contain tempo-ral information. Each node in a tempotempo-ral decision tree uses the output of a filter (such as the mean or the slope) applied to a feature variable over a randomly chosen time window of some specific length in order to split the node.
2.6 Feature Engineering
Creating a good feature representation is essential in any recognition task. Histograms of Oriented Gradients [40] features have been widely used to describe objects in high-performance object detectors. Similarly, Dalal et al. [41] introduced oriented histograms
20
of optical flow as motion descriptors to supplement appearance descriptors such as HOG to further improve detection in problems involving motion of the subject. An example of the application of HOG-HOF features was given by Konecny et.al. [42]. They utilized a descriptor that combines HOG and HOG features for the task of One-Shot-Learning Gesture Recognition on the 2012 ChaLearn Gesture Challenge [43]. Laptev et al. [44] described Space Time Interest Points (STIPS), which are used to compactly represent spatio-temporal events.
Gesture recognition tasks have been aided with the advent of 3D cameras that are capable of capturing depth information from a scene, and skeleton detection algorithms capable of detecting joint locations and angles of a user with great accuracy. The Microsoft Kinect is the most popular example of such a system. An infrared light emitter emits a non-uniform array of IR rays onto the scene, the reflections of which are detected by the depth camera sensor. Using the principle of structured light, the depth information of the scene can be inferred [45]. An early technique demonstrating this principle was formulated by Zhang et al. [46], which inferred the geometric shape of an object from a 2D image of the object under color-striped illumination. Thus, descriptors such as the angular velocity, acceleration and curvature of joints can be used to replace or supplement the aforementioned image-based descriptors. The task of tracking users performing the gestures or body parts such as hands and fingers has also been aided. In systems devoid of depth cameras, color, shape or appearance models are trained to recognize the presence of humans in a sequence of images in order to track them.
2.7 Summary
Segmenting human gestures from a continuous video stream and accurately classifying them is a difficult problem in computer vision. This chapter described some of the existing and historically popular methods used to segment and classify human gestures, with examples of their usage. It briefly explained some feature representations that have been used to describe gestures, and how the increasing popularity of depth sensors has helped solve some of the tasks associated with the problem of gesture spotting and recognition.
Chapter 3
Decision Trees and Forests
3.1 Decision Trees
Decision tree classifiers have been used in many supervised-learning tasks [47]. A decision tree is a collection of nodes and edges arranged in a tree-like structure. Splits occur on internal nodes, whereas class labels are stored in the terminal nodes known as leaves. Given a training set S of data points and their corresponding labels, trees are built to optimize a certain function, which involves choosing parameters that best splits the data at an internal node. One metric which measures the degree of split is called information gain. Information gain (I) is usually used for multiclass classification problems, and can be defined as:
Ij =H(Sj)− P k(L,R)
|Sk j|
|S|H(Sjk)
whereSj is the set of training points at nodej,H(Sj) is the Shannon entropy at node
j before the split, andSL
j and SjRare the sets of points at the right child and left child
That is, information gain measures the difference in the Shannon entropy H(S) before and after a split. The Shannon entropy can be defined as:
H(S) =−P
cCpclog(pc)
where S is the set of training points and pcis the probability of a sample being class c.
Training the parameters Θj of node j involves maximizing the information gain at the
node. Each split node is associated with a binary split function that decides which child of the node each data point traverses to next in the tree.
There are several popular algorithms associated with the construction of decision trees. Some of them are listed here:
3.1.1 ID3
Iterative Dichotomiser 3 (ID3), invented by Ross Quinlan [48], [49], [50], is one of the first decision-tree construction algorithms. In every iteration of ID3, a previously unselected attribute associated with the biggest information gain is selected to split the set of observations at a node, beginning at the root of the tree. Recursive division of internal nodes occurs until:
• every item of a node has the same label, in which case the node becomes a leaf,
• all attributes have been previously selected, in which case the node becomes a leaf labelled with the class of the most frequently occuring element in the node
24
• if a subset after a split is empty, in which case the parent node becomes a leaf labelled with the class of the most frequently occuring element in the node
During testing, each new object is classified by the traversing down the decision tree from the root to a leaf node, which contains the predicted label.
3.1.2 C4.5
C4.5 was also invented by Quinlan [51] as an improvement to ID3. The improvements made from ID3 include the ability of the algorithm to handle continuous attribute values in addition to discrete attribute values, as well as account for missing attribute values in the training set. Attributes with missing values are neglected during the process of choosing the attribute that best satisfies the splitting criterion. In addition, decision trees constructed with C4.5 are pruned; pruning reduces the size of the decision tree and improves accuracy by reducing overfitting.
3.1.3 CART
The Classification and Regression Trees (CART) method, introduced by Breiman et al. [52], is similar to the C4.5 method. A decision tree is first constructed to a maximal size, and then pruned sequentially back to the root. The optimal decision tree is selected from the sequence of trees (from maximally grown to fully pruned). CART trees can be optimized to perform classification or regression.
The advantages associated with decision trees are often attributed to their underlying simplicity: decision trees are easy to understand and interpret; classification and regres-sion results can be explained by Boolean logic; they are easy to implement irrespective of the size of the dataset and can handle variability in the attribute value types (numerical, categorical).
However, the problem of constructing an optimal decision tree is NP-complete; thus, trees constructed with greedy algorithms may not yield a globally-optimal solution. Another problem associated with individual decision trees is that they tend to over-fit and generalize poorly. Ensembles of decision trees, such as random forests, alleviate the problem of over-fitting by introducing an element of randomness while constructing the individual trees and creating an ensemble of such randomized trees [13].
3.2 Random Forests
Ensemble methods, such as random forests, have shown to be more accurate than in-dividual decision trees in tasks of classification and regression. In random forests [53], multiple decision trees are grown independently and can be grown in parallel. Each tree is built using all the training samples sampled with replacement. The forest is trained to optimize the parameters at each node of every tree. While training a tree, each node of the tree has access to only a randomly chosen subset of the entire set of features. Train-ing consists of selectTrain-ing at each internal node the feature in the randomly chosen feature subset that best separates the training samples. All trees are fully grown, i.e. they are
26
not pruned. During testing, all decision trees in the forest classify the test gesture, and the predicted class label is simply the label that is outputted most frequently by the individual decision trees. Dietterich [54] experimentally compares the effectiveness of the different methods of creating ensembles in order to boost the accuracy of a decision tree.
Random forests differ from other ensemble classification methods such as bagging and boosting. Bagging, an acronym for ”bootstrap aggregating”, is a method of creating multiple versions of a decision tree predictor, which are used in aggregation to form a decision by consensus [55]. Each decision tree is constructed using bootstrap replicates of the training set, that is, each training set is constructed by sampling uniformly from the original training set with replacement. The concept of boosting, introduced by Friedman [56], involves the sequential construction of trees, where the structure of a decision tree depends on the structure of previously-built trees.
Random forests have been shown to be robust to the effects of noise and outliers. More-over, they generalize well to variations in data [53]. Thus, random forests are suitable for classification tasks involving data such as gestures because data collected by image and depth sensors can be sensitive to noise and their execution can exhibit a high level of variance. We employ random forests in our gesture segmentation and classification framework, details of which are presented in the next chapter.
Formulation
Here, we describe in detail the formulation of our gesture recognition system. We first explain the procedure used in training our random forest classifier, and then illustrate how the classifier is used to simultaneously spot and classify gestures from a continuous stream.
4.1 Training
4.1.1 Input
The training set of gestures used in our experiments are labeled with true temporal segmentation as well as classification values. That is, each video sample used in training is associated with a file that describes the class labels of the gestures that are present in the video, along with their start and end frames. Let n be the number of different gestures that are present in the gesture vocabulary. We trained a n+ 1-class random forest classifier using all examples of the ndifferent gestures in the training set, as well as some randomly selected examples of non-gestures (found in intervals between two
28
Figure 4.1: Random Forest Training
gestures). Non-gestural examples may contain a sequence of gestural silence, that is when the user is relatively static, or they may contain non-gestural movements, that is when the user is moving or performing out-of-vocabulary gestures.
4.1.2 Feature Extraction
Our system extracts several features from each frame of every video sample during training. We empirically selected the feature description that performs most accurately. Since both datasets on which we perform our experiments were recorded with systems
capable of extracting depth information from the scence, we have access to both skeletal information of the users, as well as RGBD image data. Thus, we collected both joint-based and image-joint-based features.
Since all gestures in the vocabulary of both datasets were performed by the movement of one or both arms, our system computed features of several body joints such as the positions of the shoulders, elbows and wrists of the left and right arms. Since gestures are performed by subjects with different heights, at different distances from the camera sensor, we first normalized the positional coordinates of the users’ joints using the length of the user’s torso (t) as a reference. Mathematically:
Wx,jn = Wx,j−Wx,root t ,W n y = Wy,j−Wy,root t ,W n z = Wz,j−Wz,root t where:
Wx,jn , Wy,jn , Wz,jn are the normalized x, y, z positional coordinates for jointj, Wx,j, Wy,j, Wz,j are the original x, y, z positional coordinates for jointj,
Wx,root, Wy,root, Wz,root are the original x, y, z positional coordinates for the hip joint,
and
t=p(Wx,head−Wx,hip)2+ (Wy,head−Wy,hip)2+ (Wz,head−Wz,hip)2
We used the normalized positional coordinates (Wxn, Wyn, Wzn) of these joints along with their rotational values (Rx, Ry, Rz, Rw), which are provided with the dataset,
and compute values for their velocities (Wx0, Wy0, Wz0, R0x, Ry0, R0z, Rw0 ) and accelerations (Wx00, Wy00, Wz00, R00x, R00y, R00z, R00w).
30
flow. We computed HOG features and HOF features inside rectangular areas centered on the various joints of the left and right limbs and aggregated them into a single vector. We found that augmenting our skeletal feature vector with HOG features on rectangular areas centered on the left and right hands help improve classification accuracy.
Thus, every frame of every sample video is described by several joint-based and image-based feature vectors. We used the different feature sets to train corresponding classifiers, and tested their performance on a validation set. Thus, we determined the best feature representation to describe the gestures, which we used to train our final classifier.
4.1.3 Gesture Representation
Decision trees (and therefore, random forests) require a uniform descriptor of all objects that are used to construct them. This is because a feature that has been selected to split a node must be uniformly located on all objects. For example, if the first feature of the feature vector representing say, the x-component of the angular velocity of the left-wrist joint, is selected to split a node in a decision tree, then the first feature of the feature vector of all objects must correspond to the same attribute, that is the x-component of the angular velocity of the left-wrist joint.
Because gestures in our dataset are temporal sequences of varying length, consisting of a fixed number of features extracted at every frame, there arises the need to represent every gesture with a feature vector of the same length. We achieved this by first smooth-ing all features ussmooth-ing a movsmooth-ing average filter, dividsmooth-ing the gesture into 10 equi-length
temporal segments, and representing each temporal segment with a vector of the median elements of all features. The representative vectors of each temporal segment were then concatenated into a single feature vector.
Because our classifier is meant to handle instances of candidate intervals that contain no gestures, or gestures that are not contained in the vocabulary of the system, we created a number of examples of such intervals. We selected a random interval of frames between the end of a gesture, and the start of another gesture. The length of the interval was chosen to be more than the number of frames in the shortest gesture in the training set and less than the number of frames in the longest gesture in the training set. A uniform feature vector of this non-gestural example is then constructed the same way as described above. Such a consistent conversion yielded a more concise and uniform representation of all gestures (and non-gestures), which we then used to train our random forest classifier.
4.1.4 Random Forest Training
A random forest classification model consists of several trees. Increasing the number of trees in a random forest helps increase classification accuracy upto a certain number of trees after which the increase in classification accuracy is insignificant. We selected the optimal number of trees through experimentation.
32
We defined the training set as D = {(X1, Y1), ...,(Xn, Yn)}. Here, (X1, ...,Xn)
corre-sponds to the uniform-length feature vector representing the gesture or non-gesture, and (Y1, ..., Yn) represents their corresponding class labels.
Decision treest(x, φk) are constructed until they are fully grown, that is without pruning.
Herexis an input vector andφkis a random vector used to generate a bootstrap sample
of objects from the training setD. That is, for each decision tree,nsamples are chosen randomly with replacement from D.
Let d be the dimensionality of the feature vector of the inputs. At each internal node of the tree, m features are selected randomly from the available d, such that m < d. We chose: m = √d. From the m chosen features, the feature that provides the most information gain is selected to split the node. Information gain (I) is be defined as:
Ij =H(Sj)− P k(L,R) |Sk j| |S|H(S k j)
whereSj is the set of training points at nodej,H(Sj) is the Shannon entropy at node
j before the split, andSjL and SjRare the sets of points at the right child and left child respectively of the parent nodej after the split.
Here,H is the Shannon entropy and can be defined as:
H(S) =−P
Algorithm 1:Pseudocode for training a Random Forest
Data: N training gesture samples, each represented by a feature vector of lengthd Result: Random Forest gesture classification model
foreach tree in the forest do
Sample N datapoints with replacement; for each internal node in the tree do
Randomly sample m attributes (m =√d);
Select the feature from this randomly selected set that provides the most information gain;
Split the input datapoints using the selected feature, creating left and right children nodes;
end
return Fully grown decision tree end
return Random Forest
We trained and saved a random forest classification model based on the features that we extracted. There is a need to strengthen the classifier’s ability to accurately detect inter-vals of non-gestures because the randomly chosen interinter-vals of non-gestural examples fail to fully model the class of non-gestures. In order to achieve this, we applied the random forest model on continuous input of the training set and collected false positives and false negatives, which are examples of intervals from the training set that the classifier fails to classify correctly. False positives correspond to instances where non-gestural in-stances are classified as gestures, whereas false negatives correspond to inin-stances where
34
a gesture gets incorrectly classified as a non-gesture.The set of false positives and false negatives instances is then added to the original training set, and the random forest is re-trained using the new extended set of training examples. This process of bootstrap-ping, as performed by Marin et al. in [57], is performed iteratively until the number of false positives gets reduced below a threshold.
Algorithm 2:Pseudocode for improving classifier by bootstrapping Data: Original Random Forest classifierF, and Original Training Set S Result: Improved Random Forest gesture classification model
fori = 1,...,Nt do
Classify continuous input of the training set using the current random forest; Collect instances of false positives and false negatives and add them to the training set S;
Retrain the random forest using the updated training setS; end
Nt is the value of the iteration where the number of false positives is below a
pre-determined threshold;
return Improved Random Forest
4.2 Testing
The task during testing is to use our trained random forest model to determine the temporal segmentation of gestures in a continuous video and accurately classify the segmented gesture. A sample test video contains a number of frames, and the same features collected during training are computed for every frame. Unlike training videos,
test videos do not contain information about where gestures start and end. Therefore, we perform multi-scale sliding window classification to predict the class labels of the gestures, as well as their start and end-points.
4.2.1 Multi-scale sliding window classification
For each input video, gesture candidates are constructed at different temporal scales. Letfs be the number of frames in the shortest gesture in the training set and fl be the
number of frames in the longest gesture in the training set. Then, the temporal scales range from lengthfs to lengthfl, in increments of 3 frames. Let,G ={g1, ...gn} be the
set of gesture candidates at different temporal scales. At each scale, a candidate gesture gi is constructed by concatenating the feature vectors at an interval specified by the
temporal scale, so that the dimensions of the feature vector match those of the gestures used to train the classification model.
A buffer of length larger than the longest temporal scale is defined. At each temporal scale within the buffer, candidate gestures are constructed and each candidate gesture is classified by our trained random forest model. Each candidate gesture is given a class label and a confidence score by the classifier. The confidence score is the percentage of decision trees that vote for the predicted class. A higher confidence score alludes to the fact that the classifier is more certain of its prediction, whereas a lower confidence score suggests the distribution of prediction votes is spreadout among multiple classes.
36
Figure 4.2: Multi-scale Sliding Window Classification
Within the buffer, a sliding window is used to construct gesture candidates at each tem-poral scale. For a buffer of sizeb, the number of gesture candidates at scale si is equal
tob−si+ 1. Gesture candidates generated by the sliding window within the buffer at
each scale compete to generate a likely gesture candidateGsi at that scale. Since gesture candidates at the neighborhood of where the gesture is truly temporally located tend to be classified as the same gesture, we perform Non-Maximal Suppression to select the most likely gesture candidate. That is, for each scalesi,b−si+ 1 gesture candidates are
generated and the one classified with the highest confidence (Gsi) is selected. Finally, the likely gesture candidates at the various scales compete to generate the final predicted
gesture within the buffer. Therefore, within the buffer, the scale of the final predicted gesture helps determine the segmentation boundaries of the gesture, whereas its class label is that which is predicted by the random forest classifier. The end point of the predicted gesture is chosen to be the start point of the new buffer. This process is then repeated until the end of the test video is reached.
38
Algorithm 3:Multiscale Sliding Window Gesture Classification Pseudocode Data: Input video
Result: Annotation of start-and-end points of gestures in the video along with their class labels
Buffer Length = Max Gesture Scale + 10; Start Buffer = 1;
while End of File is not reached do while End of Buffer is not reached do
for all temporal scales do
Use Sliding window of scale sto generate candidate gestures;
Classifiy candidate gestures at scale s, and save candidate gesture with highest confidence;
end
Compare candidate gestures at each scale and select the one with the highest confidence;
Save segmentation boundary as well as class label; end
Update Start Buffer to be the end of the predicted gesture; return Gesture boundary and label within the buffer end
Datasets
Here, we describe in detail the nature of the datasets we have used to test our gesture recognition system.
5.1 NATOPS
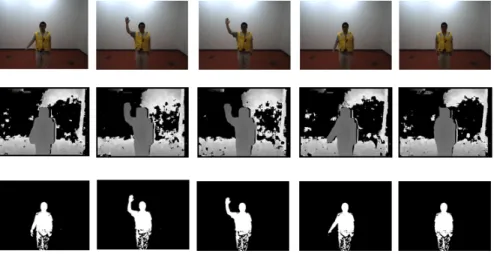
The Naval Air Training and Operating Procedures Standardization (NATOPS) gesture vocabulary comprises of a set of gestures used to communicate commands to naval air-craft pilots by officers on an airair-craft carrier deck. The NATOPS dataset [58] consists of 24 unique aircraft handling signals, which is a subset of the set of gestures in the NATOPS vocabulary, performed by 20 different subjects, where each gesture has been performed 20 times by all subjects. Thus, each gesture has 400 samples. The samples were recorded at 20 FPS using a stereo camera at a resolution of 320 x 240 pixels. The videos were recorded in such a way that the position of the camera and the subject rela-tive to the camera was fixed, and changes in illumination and background was avoided. The dataset includes RGB color images, depth maps, and mask images for each frame of all videos. A 12 dimensional vector of body features (angular joint velocities for the
40
Figure 5.1: RGB, Depth, and User-Mask Segmentation of a subject performing ges-ture 1 ’I Have’ in the NATOPS dataset
right and left elbows and wrists), as well as an 8 dimensional vector of hand features (probability values for hand shapes for the left and right hands) collected by Song et al. [58] was also provided for all frames of all videos of the dataset.
5.2 CHALEARN
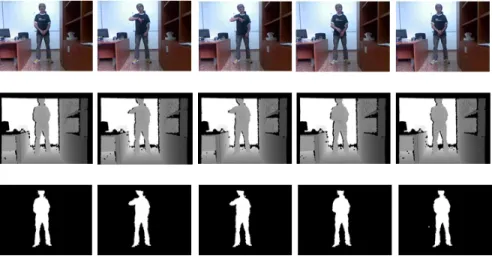
The CHALEARN dataset was provided as part of the 2014 Looking at People Gesture Recognition Challenge [59]. The focus of the gesture recognition challenge was to create a gesture recognition system trained on several examples of each gesture category performed by various users. The gesture vocabulary contains 20 unique Italian cultural and anthropological signs. Gestural communication is a major part of communication
Figure 5.2: RGB, Depth, and User-Mask Segmentation of a subject performing
ges-ture 1 ’sonostufo’ in the CHALEARN dataset
in Italian culture, and developing systems to recognize such gestures is a task that can have many applications.
The development data used to train the recognition system contains a total of 7,754 manually labeled gestures. Additionally, a validation set with 3,363 labelled gestures was provided to test the performance of the trained classifier. During the final evaluation phase, another 2,742 gestures were provided. The gesture examples are contained in several video clips. Along with the RGB data, depth data, user mask data along with skeletal information was also provided. Skeletal information was contained in a .csv file, where world coordinates, rotation values and pixel coordinates were provided for 20 different joints of the user in each frame of the video clip.
Chapter 6
Implementation Details
Our gesture recognition system was trained and tested on a Dell workstation with a 2.67 GHz X5650 Intel(R) Xeon(R) processor with 12 GB RAM. The NATOPS video samples were recorded at 20 FPS using a stereo camera at a resolution of 320 x 240 pixels, whereas the CHALEARN video samples were recorded using the Microsoft Kinect. The Microsoft Kinect is currently the most commonly used depth sensor for research in computer vision, and has popularized research and application development in gesture recognition due to the availability of Microsoft’s Kinect SDK (software development kit), which allows users to access the depth and video streams of the Kinect along with M icrosoft’s proprietary body-tracking algorithms, as well as open-source alternatives such as the OpenNI framework [45]. The Kinect includes a VGA video camera with 640x480 pixel resolution, placed beside a QVGA depth camera with 320x240 pixel resolution, which respectively produce streams of RGB and depth images at up to 30 frames per second.
To compute HOG and HOF features, we developed scripts written in Python that uti-lized the OpenCV library. The remaining scripts to collect features and represent ges-tures were written in MATLAB. A random forest library in MATLAB based on a random forest package in R (ported by Andy Liaw and Matthew Wiener from the Fortran orig-inal by Leo Breiman) was used, and was preferred to MATLAB’s inbuilt Treebagger class. The code is available in https://code.google.com/p/randomforest-matlab/.
The performance of our code was verified using several evaluation metrics. Confusion matrices were used to visualize the performance of various classifiers on segmented ges-tures. A confusion matrix, also known as a contingency table, helps visualize the per-formance of the classifier. Columns of a confusion matrix represent the predicted class, whereas each row represents the true class. The confusion matrix helps illustrate the percentage of gestures that are correctly classified, and the percentage of gestures that are confused for another gesture. The diagonal entries of the matrix represent instances that are correctly classified; taking the average of the diagonal of the confusion matrix gives the average accuracy of the classifier.
In order to evaluate the performance of our classifier on continuous input, we used the Jaccard similarity index. The Jaccard similarity is a metric used to measure the overlap between predictions and truth values. The Jaccard index score between two vectors is simply the intersection divided by the union, i.e. the percentage of similarity between the two vectors. The Jaccard Index is defined as:
Js,n= As,n ∩Bs,n
44
Here, As,n is the vector describing the ground truth indices of gesture n at sequence
s, whereas Bs,n is the vector describing the predicted indices of gesture n at sequence
s. If false positives are predicted, a Jaccard index of 0 is assignned. The final Jaccard score for each sequence is the average of Jaccard index scores of all gestures. The final Jaccard index score is the average of the Jaccard scores obtained for all test sequences.
Experimental Results
Here we describe the experiments performed to evaluate our gesture recognition system on the two datasets. We used the NATOPS dataset to evaluate our gesture classification system in a non-continuous setting. We used a set of gesture samples to train our gesture classifier, and tested its performance on a test-set of segmented gestures. In the CHALEARN dataset, the methods used to train our classifier is similar to that used in the NATOPS dataset. However, due to the availability of evaluation and test videos where the user performs both in-vocabulary and out-of-vocabulary gestures, with intervals of gestural silence or transitions, we were able to test the performance of our system on continuous test input. This way, we were able to learn about the effectiveness of our system in not only labelling candidate gestures, but also finding the start and end points of the candidate gestures in the temporal stream.
7.1 NATOPS
46
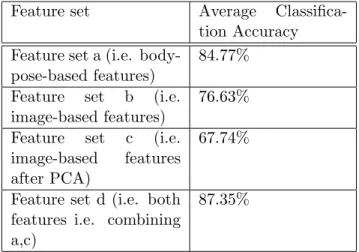
(a) MIT body-pose-based feature set: This feature set [17] consists of 20 unique fea-tures for each timeframe for every gesture. The extracted feafea-tures are angular joint velocities for the right and left elbows and wrists, as well as probability values of hand shapes for the left and right hands. A comprehensive description of how the features were extracted has been provide by Song et al. [17].
For each gesture sample, features are represented by a 2-d matrix whose columns equal the number of feature variables(20), and whose rows equal the number of frames. We converted this 2-d matrix into a single-dimensional feature-vector rep-resentation of length 200 by lining up feature vectors from timeframes at evenly spaced intervals.
(b) CRA image-based feature set: Each gesture sample of the Charles River Analytics (CRA) feature set is represented by a 2-d matrix whose columns equal the num-ber of feature variables (400), which were calculated using randomly pooled edge-orientation and edge-density features, and whose row equals the number of frames (F) [60]. We converted this 2-d matrix into a single-dimension feature vector of length 4000 by lining up feature vectors from timeframes at evenly spaced intervals.
(c) Dimensionality-reduced CRA image-based feature set: We reduced the above 4000-d feature space into a 200-d feature space via Principal Component Analyis (PCA).
(d) Feature set combining both MIT and CRA features: In this feature set, the 200-d feature vectors obtained from the MIT (a) and CRA (c) feature sets were combined to form a 400d feature vector for every gesture.
Feature set Average Classifica-tion Accuracy Feature set a (i.e.
body-pose-based features)
84.77% Feature set b (i.e.
image-based features)
76.63% Feature set c (i.e.
image-based features after PCA)
67.74%
Feature set d (i.e. both features i.e. combining a,c)
87.35%
Table 7.1: Average Classification accuracy on all 24 gestures
Classifier Average Classifica-tion Accuracy k-Nearest Neighbors
us-ing DTW distances (our baseline)
58.36%
Random Forest (our) 87.35%
Table 7.2: Performance comparison with baseline approach.
For each feature set described above, we trained random forests with 500 trees on 19 sub-jects and tested on the remaining subject in a leave-one-out cross-validation approach.
7.1.1 Results
We computed the average recognition accuracy of the random forest classifier on the four different feature sets (a) - (d) of the NATOPS dataset for all 20 test subjects each performing the 24 gestures in the vocabulary. We can see that the classifier performs better on the feature-set containing only body-pose features (a) than the feature-set con-taining only image-based features (b). This suggests, in our case, that body-pose based
48
Figure 7.1: Confusion Matrix for feature set (d) i.e. combining both MIT and CRA
features
features encode more class-discerning information than image-based features. However, the highest average classification accuracy is achieved on the feature set that combines body-pose features with image-based features, suggesting the benefit of combining the two approaches of collecting features.
Classifier Average Classifica-tion Accuracy
HMM 77.67%
HCRF 78.0%
Linked HCRF 87.0% Random Forest (our) 91.5%
Table 7.3: Performance comparison on pairs of similar gestures with other approaches.
The HMM, HCRF, and Linked HCRF results were presented by Song et al. [1].
various featuresets (Table 7.1). The feature set containing only body-pose features is correctly classified 84.77% of the time, whereas the feature set containing only image-based features is correctly classified 76.63% of the time. The highest average classifica-tion accuracy of 87.35% is achieved on feature set (d), i.e. the feature set that combines both body-pose features as well as image-based features.
We also computed a confusion matrix to demonstrate the performance of our classifier for each gesture (Figure 7.1). This figure illustrates the degree of similarity between gestures in the dataset. For example, gesture 2 was incorrectly classified as gesture 3 18% of the time, thus suggesting an inherent similarity in structure. As expected, the two gestures share the same motional structure, only differing in handshapes. Similarly gesture pairs (10, 11) and (20, 21) were confused, often getting misclassified as the other (Figure 7.2). The misclassifications between these pairs of similar gestures is illustrated by a confusion matrix (Figure 7.3).
We compared the classification performance of our random forest classifier with the performance of our baseline, as well as other classifiers that have been used on this dataset (Table 7.2, Table 7.3). Our baseline approach (k-NN with DTW distances)
50
Figure 7.2: Examples of gesture pairs which have similar motional structure but differ
in handshapes.
fares poorly against competing models with an average classification accuracy of less than 60%, but our random forest approach on the challenging subset of similar gestures yields results that exceeds those produced by the state-of-the-art (Linked HCRF) (Table 7.3).
Figure 7.3: Confusion Matrix for pairs of similar gestures in the dataset
7.2 CHALEARN
From the CHALEARN dataset, we constructed the following features sets:
(a) CHALEARN featureset a: Features contain unedited raw skeleton data, that is, each frame consists of 9 values for all 20 joints. The feature vector per frame has 180 dimensions, and per gesture has 1800 dimensions.
(b) CHALEARN featureset b: Features contain normalized positional and velocity data for 9 joints. The feature vector per frame has 126 dimensions, and per gesture has
52
1260 dimensions.
(c) CHALEARN featureset c: Features contain positional, velocity, and acceleration data for 9 joints. Dimensions. The feature vector per frame has 189 dimensions, and per gesture has 1890 dimensions.
(d) CHALEARN featureset d: Features contain HOG data for boxes around 9 joints (head, left shoulder, left elbow, left wrist, left hand, right shoulder, right elbow, right wrist, right hand). Each image from the RGB video is first converted to grayscale. For each image, we define boxes, which are 32x32 pixel squares centered on the joint. Each box is divided into 4x4 cells, each of which is represented by a 9-dimensional histogram (i.e. 9 orientation bins between 0 and 180 degrees) of oriented gradients. A [-1,0,1] gradient filter is used in both directions to calculate the gradients. Each box is divided into 3x3 overlapping blocks (each block contains 2x2 cells), which are used to normalize the cell histograms. Thus, each block is a 36-dimensional vector. There are 9 blocks in a box, thus the normalized histogram can be represented as a 324-dimensional vector. Since there are 9 such boxes, the feature vector per frame has 2916 dimensions, and per gesture has 29160 dimensions.
(e) CHALEARN featureset e: Features contain HOF data for boxes around 9 joints. A dense optical flow is first calculated between two corresponding boxes in consecutive frames using Gunnar Farneback’s optical flow algorithm [4] in OpenCV. Histograms of Optical flow are then calculated similarly as above. The feature vector per frame has 2916 dimensions, and per gesture has 29160 dimensions.
(f) CHALEARN featureset f: This feature set combines featureset (b) with HOG data for boxes around left and right hand.
For each feature set described above, we trained random forests with 500 trees on a randomly selected subset that comprised 90
7.2.1 Results
The feature set that combines the normalized positional and velocity information, with HOG features of the hands (featureset f), is correctly classified correctly 88.91% of the time (Table 7.4), which is the highest average classification accuracy of all feature sets.
We also compared the average classification accuracy of a gesture classifier based on a single multiclass random forest, to that based on multiple one-vs-the rest random forests (Table 7.5). To train a one-vs-the-rest random forest, all gesture samples from a given gesture class are selected as positive examples, and a comparable number of randomly selected examples of other gestures are selected as negative examples. A binary random forest classifier is thus trained for all gesture classes. During testing, the one-vs-rest classifiers compete to label the gesture; the classifier that classifies the test gesture with the highest confidence is selected as the label of the test gesture. We found that a single random forest classifier performs better than a system of multiple one-vs-the-rest random forest classifiers.
We illustrate the effect of increasing the number of decision trees in the random forest on classifier accuracy (Table 7.6). When a single decision tree is used, the average