Guide to Using
StatTools
Statistics Add-In for Microsoft
®Excel
Version 5.7
September, 2010
Palisade Corporation
798 Cascadilla St
Ithaca, NY 14850
(607) 277-8000
http://www.palisade.com
Copyright Notice
Copyright © 2010, Palisade Corporation.
Trademark Acknowledgments
Microsoft, Excel and Windows are registered trademarks of Microsoft, Inc. IBM is a registered trademark of International Business Machines, Inc.
Palisade, TopRank, BestFit and RISKview are registered trademarks of Palisade Corporation.
Welcome to StatTools for Excel
Welcome
StatTools gives Microsoft Excel - the industry-standard data analysis and modeling tool - a new, powerful statistics toolset! StatTools is a Microsoft Excel statistics add-in, allowing you to analyze data in Excel worksheets and work in the familiar Microsoft Office environment. By combining a powerful data manager, along with analyses that rival the best statistics packages available, StatTools brings you the best of two worlds: Microsoft Office ease-of-use and reporting, and robust statistical power.
Work Where You're Comfortable
If you know Excel, you'll know StatTools! StatTools works just as Excel does, with toolbars, menus and custom worksheet functions, all inside of Excel. Unlike stand-alone statistics software, there's no steep learning curve and upfront training costs with StatTools, because you work just as you are used to working in Excel. Your data and
variables are in Excel spreadsheets. You can utilize standard Excel formulas for calculations and transformations, along with Excel sorting and pivot tables. Reports and charts from your statistical analyses are in standard Excel format and can utilize all of Excel's built-in formatting capabilities.
Robust Statistics Inside Excel
StatTools replaces Excel's built-in statistics with its own robust and fast calculations. The accuracy of Excel's built-in statistics calculations has often been questioned, and StatTools uses none of them! Even Excel's worksheet statistics functions – such as STDEV() – are replaced by new, robust StatTools versions – such as StatSTDEV(). StatTools statistics calculations meet the highest tests for accuracy, with performance optimized through the use of C++ .DLLs, not macro calculations.
StatTools Analyses
StatTools covers the range of the most commonly used statistical procedures, and offers unprecedented capabilities for adding new, custom analyses. A total of 36 wide-ranging statistical procedures plus 8 built-in data utilities cover the most widely used statistical analyses. Statistical functions provided include descriptive statistics, normality tests, group comparisons, correlation, regression analysis, quality control, forecasts and more. Add to this a library of custom procedures (written by your staff or other experts in the field) and you've got a comprehensive and customizable statistics toolset, right inside of Excel!
StatTools features live, "hot-linked" statistics calculations! If you change a value in Excel, you expect your worksheet to recalculate and give you a new answer. Well, the same thing happens in StatTools! Change a value in your dataset and your statistics report
automatically updates. StatTools uses a powerful set of custom worksheet functions to insure that the statistics displayed in your reports are always up-to-date with your current data.
StatTools Data Management
StatTools provides a comprehensive dataset and variable manager right in Excel, just as you would expect from a stand-alone statistics package. You can define any number of datasets, each with the variables you want to analyze, directly from your data in Excel. StatTools intelligently assesses your blocks of data, suggesting variable names and data locations for you. Your datasets and
variables can reside in different workbooks and worksheets, allowing you to organize your data as you see fit. Then, you run statistical analyses that refer to your variables, instead of re-selecting your data over and over again in Excel. And StatTools variables aren't limited in size to a single column of data in an Excel worksheet – you can use the same column across up to 255 worksheets for a single variable! (65,535 X 255, or over 16 million cases in StatTools Industrial; 10,000 cases in StatTools Professional Edition)
StatTools Reporting
Excel is great for reports and graphs, and StatTools makes the most of this. StatTools uses Excel-format graphs, which can be easily
customized for new colors, fonts and added text. Report titles, number formats and text can be changed just as is any standard Excel worksheet. Drag and drop tables and charts from StatTools reports straight into your own documents in other applications. Charts and tables stay linked to your data in Excel, so whenever your analysis reports change, your document is automatically updated.
Data Access and Sharing
Excel has great data import features, so bringing your existing data into StatTools is easy! Use standard Excel capabilities to read in data from Microsoft SQL Server, Oracle, Microsoft Access, or any other ODBC compliant database. Load data from text files or other applications – if you can read it into Excel, you can use it with StatTools!
StatTools saves all its results and data in Excel workbooks. Just like any other Excel file, you can send your StatTools results and data to colleagues anywhere. Sharing couldn't be easier!
StatTools Industrial
StatTools Industrial includes a complete, object-oriented,
programming interface, where custom statistical procedures may be added using Excel's built-in VBA programming language. These custom procedures can utilize StatTools' built-in data management, charting and reporting tools, all accessible via StatTools custom controls, functions and methods. Your custom procedures can even be displayed on the StatTools menu for easy access!
So what if you're not going to write your own statistical procedures? StatTools Industrial still provides a great benefit to you, as you can use custom procedures that are written by others, right off the standard StatTools menu! Experts in the field are constantly adding to the library of new, custom procedures that are built with StatTools. Simply copy a workbook with a new procedure into your StatTools directory on your PC and it instantly shows up on the StatTools menu. Run it and you'll see all the standard StatTools data management tools, combined with the new statistical analysis you
Table of Contents
Chapter 1: Getting Started 1
Introduction ...3
Checking Your Package ...3
What the Package Includes...3
About This Version ...3
Working with your Operating Environment ...4
If You Need Help ...4
StatTools System Requirements ...6
Installation Instructions ...7
General Installation Instructions ...7
Setting Up the StatTools Icons or Shortcuts ...8
The DecisionTools Suite...9
Software Activation ...11
Chapter 2: An Overview to StatTools 15 Overview ...17
StatTools Menu and Toolbar ...17
Data Sets and the Data Manager ...17
StatTools Reports and Charts ...20
Chapter 3: StatTools Reference Guide 23 Introduction ...27
StatTools VBA Macro Language and Developer's Toolkit ...27
Reference: StatTools Icons 29 StatTools Toolbar ...29
Add-in Analysis Packs ...33
Command Listing ...35
StatTools Menu – DataSets...43
Data Set Manager Command...43
Data Utilities Menu...49
Stack Command...49 Unstack Command...51 Transform Command ...52 Lag Command...54 Difference Command...56 Interaction Command...58 Combination Command ...60 Dummy Command ...62
Random Sample Command ...64
Summary Statistics Menu ...67
One Variable Summary Command ...67
Correlations and Covariance Command...70
Summary Graphs Menu ...73
Histogram Command ...73
Scatter Plot Command...76
Box-Whisker Plot Command...78
Statistical Inference Menu ...81
Confidence Interval - Mean/ Std. Deviation Command ...81
Confidence Interval - Proportions Command ...84
Hypothesis Test - Mean/ Std. Deviation Command...87
Hypothesis Test - Proportions Command ...90
Sample Size Selection Command ...93
One-Way ANOVA Command ...95
Two-Way ANOVA Command...98
Chi-square Independence Test Command...100
Normality Tests Menu ...103
Chi-Square Normality Test Command ...103
Lilliefors Test Command...107
Q-Q Normal Plot Command ...110
Time Series and Forecasting Menu ...113
Time Series Graph Command ...113
Autocorrelation Command...116
Forecasting Command...120
Regression and Classification Menu...125
Regression Command ...126
Logistic Regression Command ...131
Discriminant Analysis Command...135
Quality Control Menu ...139
Pareto Chart Command...140
X/R Charts Command...143
P Chart Command...147
C Chart Command ...150
U Chart Command ...153
Nonparametric Tests Menu...157
Sign Test Command ...159
Wilcoxon Signed-Rank Test Command...162
Mann-Whitney Test Command...165
Utilities Menu ...169
Application Settings Command ...169
Delete Data Sets Command ...175
Clear Dialog Memory Command...175
Unload StatTools Add-in Command...175
Help Menu...177
StatTools Help ...177
Online Manual ...177
License Activation Command...177
About Command...177
Reference: StatTools Functions 179 Introduction ...179
StatTools Functions vs. Excel Functions ...179
Distribution Functions...180
"Live" Reports ...181
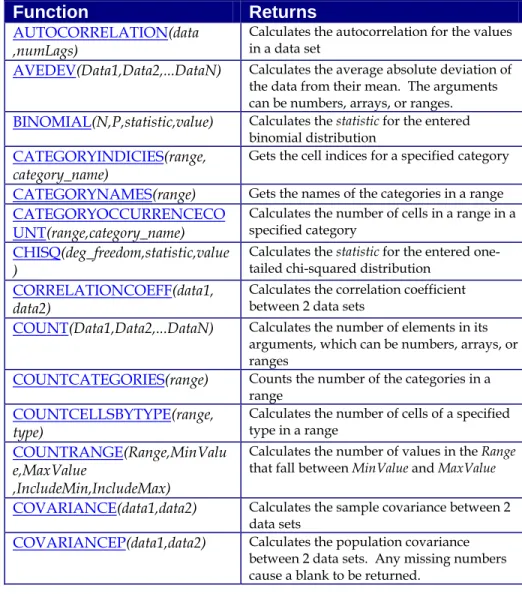
Reference: Listing of Statistics Functions...183
Table of Available Functions...183
Detailed Function Descriptions...187
Chapter 1: Getting Started
Introduction ...3
Checking Your Package ...3
What the Package Includes...3
About This Version ...3
Working with your Operating Environment ...4
If You Need Help ...4
StatTools System Requirements ...6
Installation Instructions ...7
General Installation Instructions ...7
Setting Up the StatTools Icons or Shortcuts ...8 @RISK 4.5 Help System © Palisade Corporation, 1999
Introduction
This introduction describes the contents of your StatTools package and shows you how to install StatTools and attach it to your copy of Microsoft Excel 2000 for Windows or higher.
Checking Your Package
Your StatTools package should contain:
Learning Statistics with StatTools, a statistics book that uses StatTools written by Dr. S. Christian Albright of Indiana University The StatTools or DecisionTools Suite CD-ROM including:
• StatTools Program
• StatTools Tutorial
• The StatTools Users Guide (this book) in .PDF format
The StatTools Licensing Agreement
If your package is not complete, please call your StatTools dealer or supplier or contact Palisade Corporation directly at (607) 277-8000.
What the Package Includes
StatTools may be purchased on its own and also ships with the DecisionTools Suite Professional and Industrial versions. The StatTools CD-ROM contains the StatTools Excel add-in, several StatTools examples, and a fully-indexed StatTools on-line help system. The DecisionTools Suite Professional and Industrial versions contain all of the above plus additional applications.
About This Version
This version of StatTools can be installed as a 32-bit program for Microsoft Excel 2000 or higher.
Chapter 1: Getting Started 4
Working with your Operating Environment
This User’s Guide assumes that you have a general knowledge of the Windows operating system and Excel. In particular:
• You are familiar with your computer and using the mouse.
• You are familiar with terms such as icons, click, double-click, menu, window, command and object.
• You understand basic concepts such as directory structures and file naming.
If You Need Help
Technical support is provided free of charge for all registered users of StatTools with a current maintenance plan, or is available on a per incident charge. To ensure that you are a registered user of StatTools,
please register online at
http://www.palisade.com/support/register.asp.
If you contact us by telephone, please have your serial number and User’s Guide ready. We can offer better technical support if you are in front of your computer and ready to work.
Before contacting technical support, please review the following checklist:
• Have you referred to the on-line help?
• Have you checked this User's Guide and reviewed the on-line multimedia tutorial?
• Have you read the README.WRI file? It contains current information on StatTools that may not be included in the manual.
• Can you duplicate the problem consistently? Can you duplicate the problem on a different computer or with a different model?
• Have you looked at our site on the World Wide Web? It can be found at
http://www.palisade.com. Our Web site also contains the latest FAQ (a searchable database of tech support questions and answers) and
StatTools patches in our Technical Support section. We recommend visiting our Web site regularly for all the latest information on
StatTools and other Palisade software.
Palisade Corporation welcomes your questions, comments or suggestions regarding StatTools. Contact our technical support staff using any of the following methods:
• Email us at [email protected].
• Telephone us at (607) 277-8000 any weekday from 9:00 AM to 5:00 PM, EST. Follow the prompt to reach technical support.
• Fax us at (607) 277-8001.
• Mail us a letter at:
Technical Support Palisade Corporation 798 Cascadilla St. Ithaca, NY 14850 USA
If you want to contact Palisade Europe: • Email us at [email protected].
• Telephone us at +44 1895 425050(UK).
• Fax us at +44 1895 425051(UK).
• Mail us a letter at:
Palisade Europe 31 The Green West Drayton Middlesex UB7 7PN United Kingdom
If you want to contact Palisade Asia-Pacific: • Email us at [email protected]
• Telephone us at + 61 2 9252 5922 (AU).
• Fax us at + 61 2 9252 2820 (AU).
• Mail us a letter to:
Palisade Asia-Pacific Pty Limited Suite 404, Level 4
20 Loftus Street Sydney NSW 2000 Australia
Regardless of how you contact us, please include the product name, version and serial number. The exact version can be found by selecting the Help About command on the StatTools menu in Excel. Contacting
Chapter 1: Getting Started 6
Telephone support is not available with the student version of StatTools. If you need help, we recommend the following alternatives:
♦ Consult with your professor or teaching assistant.
♦ Log on to http://www.palisade.com for answers to frequently asked questions.
♦ Contact our technical support department via e-mail or fax.
StatTools System Requirements
System requirements for StatTools for Microsoft Excel for Windows include:
• Pentium PC or faster with a hard disk.
• Microsoft Windows 2000 SP4, Windows XP or higher.
• Microsoft Excel 2000 or higher.
Student Versions
Installation Instructions
General Installation Instructions
The Setup program copies the StatTools system files into a directory you specify on your hard disk. To run the Setup program in
Windows 2000 or higher:
1) Insert the StatTools or DecisionTools Suite ROM in your CD-ROM drive
2) Click the Start button, click Settings and then click Control Panel 3) Double-click the Add/Remove Programs icon
4) On the Install/Uninstall tab, click the Install button 5) Follow the Setup instructions on the screen
If you encounter problems while installing StatTools, verify that there is adequate space on the drive to which you’re trying to install. After you’ve freed up adequate space, try rerunning the installation. If you wish to remove StatTools from your computer, use the Control Panel’s Add/Remove Programs utility and select the entry for StatTools.
Removing StatTools from Your Computer
Chapter 1: Getting Started 8
Setting Up the StatTools Icons or Shortcuts
In Windows, setup automatically creates a StatTools command in the Programs\Palisade DecisionTools menu of the Taskbar. However, if problems are encountered during Setup, or if you wish to do this manually another time, follow these directions. Note that the
directions given below are for Windows XP Professional. Instructions for other operating systems may vary.
1) Click the Start button, and then point to Settings.
2) Click Taskbar and Start Menu, and then click the Start Menu tab. 3) Click Customize, click Add, and then click Browse.
4) Locate the file StatTools.EXE, click it and then click OK.
5) Click Next, and then double-click the menu on which you want the program to appear.
6) Type the name “StatTools”, and then click Finish. 7) Click OK on all opened dialogs.
Creating the Shortcut in the Windows Taskbar
The DecisionTools Suite
StatTools is part of the DecisionTools Suite, a set of products for risk and decision analysis available from Palisade Corporation. The default installation procedure of StatTools puts StatTools in a subdirectory of a main “Program Files\Palisade” directory. This is quite similar to how Excel is often installed into a subdirectory of a “Microsoft Office” directory.
One subdirectory of the Program Files\Palisade directory will be the StatTools directory (by default called StatTools5). This directory contains the Evolver add-in program file (STATTOOLS.XLA) plus example models and other files necessary for StatTools to run. Another subdirectory of Program Files\Palisade is the SYSTEM directory which contains files needed by every program in the DecisionTools Suite, including common help files and program libraries.
Software Activation
Activation is a one time license verification process that is required in order for your StatTools software to run as a fully licensed product.
An activation code is on your printed/emailed invoice and may
resemble a dash separated sequence like "19a0-c7c1-15ef-1be0-4d7f-cd". If you enter your Activation code during installation, then your software is activated the first time the software is run and no further user action is required. If you wish to activate your software after installation, select the StatTools Help menu License Activation command and enter your activation code in the displayed Palisade
License Activation dialog box.
1) What if my software is not activated?
If you do not enter an activation code during installation or you are installing a trial version, your software will run as a trial version with time and/or number of uses limitations and must be activated with an activation code in order to run as a fully licensed product.
2) How long can I use the product before I have to activate it?
Software that is not activated may be run for fifteen days. All of the product's features are present, but the License Activation dialog will appear each time the program is launched to remind you to activate and to indicate the time remaining. If the 15 day trial period expires, the software will require activation in order to run.
Frequently Asked Questions
Chapter 1: Getting Started 12 3) How do I check my activation status?
The License Activation dialog box is viewed through the StatTools Help menu License Activation command. Activated software shows a status of Activated and trial version software shows a status of Not
Activated. If the software is not activated, the remaining time that the
software is allowed to run is displayed.
4) How do I activate my software?
If you do not have an activation code you may obtain one by clicking the Puchase button in the License Activation dialog. An online purchase will be immediately given an activation code and an optional link to download the installer should reinstallation become necessary. To purchase by phone call the local Palisade office given in the Contacting Palisade section of this chapter.
Activation may be done over the Internet or via email:
• Activation if you have Internet Access
In the Palisade License Activation dialog box, type or paste the activation code and press "Automatic via Internet". A success
message should appear after a few seconds and the License Activation dialog box will reflect the software's activated status.
• Activation if you do not have Internet Access
Automated activation by email requires a few steps:
1. Click "Manual via Email" to display the request.xml file which you may save to disk or copy to the Windows
clipboard. (It is recommended you note the location on your computer of the request.xml file.)
2. Copy or attach the XML file to an email and send it to
[email protected]. You should receive an automatic response to the return address in your email shortly.
3. Save the response.xml attachment in the response email to
your hard drive.
4. Click on the Process button that is now in the Palisade
License Activation dialog box and navigate to the response.xml file. Select the file and click OK.
A success message should appear and the License Activation dialog will reflect the software's activated status.
5) How do I transfer my software license to another machine?
Transfer of a license, or rehosting, may be peformed through the Palisade License Activation dialog box as a two step procedure:
deactivation on the first machine and activation on the second machine. A typical use of rehosting is to transfer your copy of StatTools from your office PC to your laptop. To rehost a license from Machine1 to
Machine2, make sure both machines have the software installed and are connected to the Internet during the deactivation/activation rehosting.
1. On Machine1, click deactivate Automatic via Internet in the License Activation dialog. Wait for the success message. 2. On Machine2, click activate Automatic via Internet. Wait for
the success message.
If the machines do not have Internet access then you may follow the similar instructions above for rehosting by the automated email process.
6) I have Internet Access but I am still unable to Activate/Deactivate automatically.
Your firewall must be set to allow TCP access to the licensing server. For single user (non network installations) ths is
http://service.palisade.com:8888 (TCP port 8888 on http://service.palisade.com).
Chapter 2: An Overview to
StatTools
Overview ...17
StatTools Menu and Toolbar ...17 Data Sets and the Data Manager ...17 Multi-Range Data ...19 Stacked and Unstacked Data...19 Treatment of Missing Values...19 StatTools Reports and Charts ...20 Use of Formulas Versus Values ...20 Use of Comments in Cells...22
Overview
StatTools provides you with powerful statistical capabilities in an environment that you are familiar with - Microsoft Excel. StatTools procedures - such as creating scatterplots, testing a variable for normality, and running a regression analysis - can be run on your data in Excel and the reports and charts from your analyses are created in Excel.
StatTools Menu and Toolbar
Once you have installed StatTools in Excel 2003 and earlier, its menu and commands will be included as part of the Excel menu bar. There will also be a StatTools toolbar displayed. In Excel 2007 and later, a StatTools ribbon will be displayed.
Data Sets and the Data Manager
StatTools is analogous to most stand-alone statistical software packages in that it is structured around variables. For most analyses it is required that you work with a data set, or a set of statistical variables, often located in contiguous columns with variable names in the first row of the data set. The StatTools Data Set Manager allows you to define your data sets and variables. You can then use these predefined variables in your statistical analyses, without re-selecting the data you wish to analyze over and over.
Each variable in a data set has a name and a range of Excel cells associated with it. A typical variable layout is One Variable Per
Column, but variables may also be laid out by row. A data set can
include multiple blocks of cells, allowing you to put data on different sheets in the same workbook.
When you are defining a data set, StatTools attempts to identify the variables in a block of cells surrounding the current selection in Excel. This makes it quick and easy to set up a data set with variable names in the top row and variables laid out by column.
The lengths of the columns in your data set do not necessarily have to be equal. For example, you could have two variables, Weight_Men
and Weight_Women, with different numbers of observations.
However, for many analyses, StatTools will treat the blank cells in the shorter columns as missing data.
A single column in an Excel 2003 or earlier worksheet can hold up to 65536 data points for a variable. If your variables have more values than this and you choose not to adopt Excel 2007, StatTools allows multiple cell ranges to be assigned to a single data set. For example, you could "repeat" a data set across multiple sheets, assigning the same columns in different worksheets to hold all the values for a data set. You could also use this capability to assign different blocks of cells on the same worksheet to a single data set. This is helpful if your data is scattered about a single worksheet, but you want to combine it all into a single data set.
StatTools supports both Stacked and Unstacked data. With some statistical procedures it easier to work with Stacked data, and with others, Unstacked data. For example, if we are comparing mean household incomes in several different neighborhoods, then in unstacked form there would be a separate Income variable (or column) for each neighborhood. In stacked form there would be a value variable Income and a category variable Neighborhood indicating which neighborhood each household is in.
StatTools Variable Stacking utility allows you to "stack" your variables into two columns: a value column, Income, and a category column,
Neighborhood. Depending on the type of analysis, the stacked data set might be easier to work with than the unstacked version.
If your data set has missing values (a common occurrence in statistical analysis) StatTools deals with them in an appropriate way, depending on the task. For example, summary measures such as means and standard deviations ignore missing values. As another example, a regression analysis involving three variables uses only the rows of the data set that have no missing values for any of the three variables. (This is called "listwise", or "casewise", deletion.) As a third example, a scatterplot of two variables plots only those points where both of the variables have nonmissing values.
Note: Not all StatTools procedures allow missing values. Check the Reference section of this manual to see how each procedure deals with missing values.
Multi-Range Data
Stacked and Unstacked Data
Treatment of Missing Values
StatTools Reports and Charts
Whenever StatTools creates numerical output, such as a report from a regression analysis or a table of summary statistics, it gives a set of options for the placement of the report. These include:
• In a New Workbook, where a new workbook is created (if
necessary) and each report is placed on a sheet in that workbook.
• In New Worksheet in the Active Workbook, where each
report is placed in a new sheet in the active workbook.
• Starting After Last Used Column, where each report is
placed on the active sheet to the right of the last used column.
• Starting at Cell, where you have the opportunity to select a
cell where the top-left corner of the report or graph will be placed.
Whenever StatTools creates one or more charts, it places them with the reports. Charts are created in Excel format and may be
customized using standard Excel chart commands.
By default, StatTools tries to make the results as "live" as possible. That is, whenever it is practical, reports have formulas that link to the original data. For example, suppose you have a variable Weight and you want summary measures on Weight, such as its mean and standard deviation. The Summary Statistics procedure names the range of weights as Weight, and then it enters formulas in the output cells: =StatMean(Weight) and =StatStdDev(Weight). StatMean and StatStdDev are built in StatTools functions for calculating mean and standard deviation. These replace the standard built-in Excel functions for the same statistics.
Use of Formulas Versus Values
Formulas are used in reports for two reasons. First, it helps you to learn statistical procedures and the StatTools functions in Excel. You don't just see a numerical result; you see how it is formed. Second, it has the practical advantage that if your data change, the results change automatically, so that you don't have to rerun the procedure. There are times when it is not practical to do this. The prime example is regression. StatTools does not provide the formulas that are used to create regression output; it provides only the numerical results. In such cases, if your data change, you will have to rerun the
procedures.
StatTools also gives you the option to turn off live updating. This is useful if Excel recalculation time becomes an issue as data changes.
A feature of Excel is the ability to include a "pop-up" comment in any cell. You can tell that there is a comment in a cell by noticing a small red triangle in the upper right corner of the cell. You can read the comment by placing the cursor over the cell. StatTools has taken advantage of these comments to insert some context-sensitive help. You can think of these as the most "online" of all online help!
By the way, if you ever have a spreadsheet where the comments won't go away, that is, they always appear in front of your data, select the Tools/Options menu item, click on the View tab, and click on the Comment Indicator Only button.
Use of Comments in Cells
Chapter 3: StatTools Reference
Guide
Introduction ...27
StatTools VBA Macro Language and Developer's Toolkit ...27
Reference: StatTools Icons 29 StatTools Toolbar ...29
Reference: StatTools Menu Commands 33 Introduction ...33
Add-in Analysis Packs ...33
Command Listing ...35 StatTools Menu – DataSets...43
Data Set Manager Command...43
Data Utilities Menu...49
Stack Command...49 Unstack Command...51 Transform Command ...52 Lag Command...54 Difference Command...56 Interaction Command...58 Combination Command ...60 Dummy Command ...62 Random Sample Command ...64
Summary Graphs Menu ...73
Histogram Command ...73 Scatter Plot Command...76 Box-Whisker Plot Command...78
Statistical Inference Menu ...81
Confidence Interval - Mean/ Std. Deviation Command ...81 Confidence Interval - Proportions Command ...84 Hypothesis Test - Mean/ Std. Deviation Command...87 Hypothesis Test - Proportions Command ...90 Sample Size Selection Command ...93 One-Way ANOVA Command ...95 Two-Way ANOVA Command...98 Chi-square Independence Test Command...100
Normality Tests Menu ...103
Chi-Square Normality Test Command ...103 Lilliefors Test Command...107 Q-Q Normal Plot Command ...110
Time Series and Forecasting Menu ...113
Time Series Graph Command ...113 Autocorrelation Command...116 Runs Test for Randomness Command...118 Forecasting Command...120
Regression and Classification Menu...125
Regression Command ...126 Logistic Regression Command ...131 Discriminant Analysis Command...135
Quality Control Menu ...139
Pareto Chart Command...140 X/R Charts Command...143 P Chart Command...147 C Chart Command ...150 U Chart Command ...153
Nonparametric Tests Menu...157
Sign Test Command ...159 Wilcoxon Signed-Rank Test Command...162 Mann-Whitney Test Command...165
Utilities Menu ...169
Application Settings Command ...169 Delete Data Sets Command ...175
Clear Dialog Memory Command...175 Unload StatTools Add-in Command...175
Help Menu...177
StatTools Help ...177 Online Manual ...177 License Activation Command...177 About Command...177
Reference: StatTools Functions 179 Introduction ...179
StatTools Functions vs. Excel Functions ...179
Reference: Listing of Statistics Functions...183
Table of Available Functions...183 Detailed Function Descriptions...187
Introduction
The StatTools Reference Guide chapter describes the icons,
commands, and statistics functions used by StatTools. This chapter is divided into four sections:
1) Reference: StatTools Icons
2) Reference: Summary of StatTools Procedures 3) Reference: StatTools Commands
4) Reference: StatTools Functions
StatTools VBA Macro Language and Developer's
Toolkit
StatTools also includes a powerful VBA-based macro language which can be used for:
1) Automating StatTools analyses
2) Developing new statistical analyses which use the StatTools
Data Set Manager, reports and graphs. These custom
calculations can provide analyses not found in the built-in StatTools procedures. These analyses can show up on the StatTools menu and toolbars if desired.
For more information on StatTools VBA Macro Language and Developer's Toolkit, see the on-line documentation supplied with the product.
Reference: StatTools Icons
StatTools Toolbar
StatTools icons are used to define data sets and variables and then run statistical procedures on those variables. StatTools icons appear on the Excel toolbar (i.e., as a custom toolbar in Excel) in Excel 2003 and earlier and on a ribbon in Excel 2007. This section briefly describes each icon, outlining the functions they perform and the menu command equivalents associated with them.
The following icons are shown on the StatTools toolbar in Excel 2003 and earlier.
Icon
Function Performed and Command Equivalent
Define a data set and variables, or edit or delete an existing data set and variables
Command equivalent: Data Set Manager command
Run a data utility
Command equivalent: Data Utilities command
Run a summary statistics procedure
Command equivalent: Summary Statistics command
Create summary graphs for variables
Command equivalent: Summary Graphs command
Run a statistical inference procedure
Command equivalent: Statistical Inference command
Run a normality test on variables
Run a time series or forecasting procedure
Command equivalent: Time Series & Forecasting command
Run a regression or classification procedure
Command equivalent: Regression & Classification command
Run a quality control procedure
Command equivalent: Quality Control command
Run a nonparametric test
Command equivalent: Nonparametric Tests command
Display StatTools Utilities
Command equivalent: Utilities commands
Display StatTools help file
The following icons are shown on the StatTools ribbon in Excel 2007.
Icon
Function Performed and Command Equivalent
Define a data set and variables, or edit or delete an existing data set and variables
Command equivalent: Data Set Manager command
Run a data utility
Command equivalent: Data Utilities command
Run a summary statistics procedure
Command equivalent: Summary Statistics command
Create summary graphs for variables
Command equivalent: Summary Graphs command
Run a statistical inference procedure
Command equivalent: Statistical Inference command
Run a normality test on variables
Command equivalent: Normality Test command
Run a time series or forecasting procedure
Command equivalent: Time Series & Forecasting command
Run a regression or classification procedure
Command equivalent: Regression & Classification command
Run a quality control procedure
Command equivalent: Quality Control command
Run a nonparametric test
Command equivalent: Nonparametric Tests command
Display StatTools Utilities
Command equivalent: Utilities commands
Reference: StatTools Menu
Commands
Introduction
This section of the Reference Guide details the available StatTools commands as they appear on the StatTools menu in Excel 2003 or earlier and on the StatTools ribbon in Excel 2007 and later.
Commands are discussed as they appear on the menu, starting with the Data Set Manager command and subsequently moving down. StatTools icons can be used to perform many of the available commands. The Reference: StatTools Icons section of this chapter gives the command equivalents for each StatTools icon.
Several StatTools commands are also available in a pop-up floating menu that is displayed when the right mouse button is clicked in Excel.
Add-in Analysis Packs
StatTools Industrial can use "analysis packs", or add-in packages of new analyses not found in the core StatTools product. Commands found in these packages will be added to the StatTools menu. Thus, if you are using add-in analysis packs your menu may not look exactly
Command Listing
The procedures available in StatTools come in natural groups. For each group there is a item on a StatTools menu. If a group has more than one item, there is a submenu listing the items in this group. This section provides a brief description of each procedure in each group. More detailed information on each procedure is provided in the section of this chapter titled Reference: StatTools Commands.
Procedure Description Missing
Data? Live vs. Static Reports
Data
Requirement Multi-Range Data? Invalid Data # of Vars. Summary Statistics One Variable Summary Command Generates Summary Statistics including the usual measures, such as average, median, and standard deviation, plus options such as quartiles and percentiles.
Allowed at beginning, middle and end of data
Live Stacked and unstacked data Up to 16m cases allowed Yes Ignored 1-100 Correlations and Covariance Command Creates a table of correlations and/or covariances for a set of variables that you select.
Allowed at beginning, middle and end of data Live Unstacked data only Up to 16m cases allowed Yes Ignored 1-250 Summary Graphs Histogram Command
Creates a Histogram for each variable you select. It gives you the option of defining the histogram's categories or "bins". Allowed at beginning, middle and end of data Partially Live – data changes update graph when data is within the graph's X-axis range Stacked and unstacked data Up to 16m cases allowed Yes Ignored 1-100 Scatter Plot Command
Creates a Scatter plot for each pair of variables you select. Allowed at beginning, middle and end of data Live Unstacked data only Up to 32,000 cases allowed No Not allowed 1-10 Box-Whisker Plot Command
Creates a single boxplot (if you select a single variable) or side-by-side
Allowed at beginning, middle and
Live Stacked and unstacked data Up to 16m
Procedure Description Missing
Data? Live vs. Static Reports
Data
Requirement Multi-Range Data? Invalid Data # of Vars. Statistical Inference Confidence Interval - Mean/ Std. Deviation Command Calculates a confidence interval for the mean and standard deviation of single variables, or the differences between the means for pairs of variables. The confidence intervals can be calculated using a One-Sample Analysis, a Two-Sample Analysis, or a Paired Sample Analysis. Allowed at beginning, middle and end of data
Live Stacked and unstacked data Up to 16m cases allowed Yes Ignored 1-250 (one-sample analysis) Exactly 2 (two-sample analysis; paired sample analysis) Confidence Interval - Proportion Command
Analyzes the proportion of items in a sample that belong to a given category (One-Sample Analysis), or compares two samples with regard to the proportion of items in a given category (Two-Sample Analysis).
Allowed at beginning, middle and end of data
Live Stacked and unstacked data Up to 16m cases allowed Yes Ignored 1-250 (one-sample analysis) Exactly 2 (two-sample analysis; paired sample analysis) Hypothesis Test - Mean/ Std. Deviation Command
Performs hypothesis tests for the mean and standard deviation of single variables, or the differences between the means for pairs of variables. The hypothesis tests can be performed using a One-Sample Analysis, a Two-Sample Analysis, or a Paired Sample Analysis. Allowed at beginning, middle and end of data
Live Stacked and unstacked data Up to 16m cases allowed Yes Ignored 1-250 (one-sample analysis) Exactly 2 (two-sample analysis; paired sample analysis) Hypothesis Test - Proportion Command
Analyzes the proportion of items in a sample that belong to a given category (One-Sample Analysis), or compares two samples with regard to the proportion of items in a given category (Two-Sample Analysis).
Allowed at beginning, middle and end of data
Live Stacked and unstacked data Up to 16m cases allowed Yes Ignored 1-250 (one-sample analysis) Exactly 2 (two-sample analysis; paired sample analysis)
Procedure Description Missing
Data? Live vs. Static Reports
Data
Requirement Multi-Range Data?
Invalid Data # of Vars.
Sample Size Command
Determines the sample size (or sample sizes) required to obtain a confidence interval with a prescribed half-length. It does this for confidence intervals for a mean, a proportion, the difference between two means, and the difference between two proportions.
n/a n/a n/a n/a n/a n/a
One-Way ANOVA Command
An extension of the two-sample analysis for comparing two population means. It tests whether two or more means are all equal.
Allowed at beginning, middle and end of data
Live Stacked and unstacked data Up to 16m cases allowed Yes Ignored 2-50 Two-Way ANOVA Command Performs a two-way analysis of variance. This is usually done in the context of an experimental design where there are two "factors" that are each set at several "treatment levels.
Not allowed
Live Stacked data Up to 16m cases allowed Experiment must be balanced Yes Not allowed 2 category variable s, 1 value variable Chi-square Independence Test Command
Uses a chi-square test to check whether row and column attributes in a contingency table are statistically independent. No Live (as long as table size does not change)
Procedure Description Missing
Data? Live vs. Static Reports
Data
Requirement Multi-Range Data? Invalid Data # of Vars. Normality Tests Chi-Square Normality Test Command
Runs a chi-square test of normality for any variable you select. Allowed at beginning, middle and end of data Partially Live (bin positioning will not change but occupation and graphs will) Stacked and unstacked data Up to 16m cases allowed Yes Ignored 1 Lilliefors Test Command
Provides a more powerful test for normality than the chi-square goodness-of-fit test. (More powerful means that it is more likely to detect nonnormality if it exists) Allowed at beginning, middle and end of data
Live Stacked and unstacked data Up to 16m cases allowed Yes Ignored 1-10 Q-Q Normal Plot Command Creates a quantile-quantile (Q-Q) plot for a selected variable. It provides an informal test of normality.
Allowed at beginning, middle and end of data
Live Stacked and unstacked data Up to 16m cases allowed No Ignored 1 Time Series & Forecasting Time Series Graph Command
Creates a time series plot of one or more time series variable(s), all on the same chart. Allowed at beginning, middle and end of data Live Unstacked data Up to 32,000 cases allowed No Not allowed 1-100
Procedure Description Missing
Data? Live vs. Static Reports
Data
Requirement Multi-Range Data?
Invalid Data # of Vars.
Autocorrelation Command
Calculates any number of autocorrelations for a time series variable, indicates which (if any) are significantly nonzero, and (optionally) provides a bar chart (called a correlogram) of the autocorrelations. Allowed at beginning or end of data Live Unstacked data Up to 32,000 cases allowed No Not allowed 1-10
Runs Test for Randomness Command
Performs a runs test to check whether a variable (usually a time series variable) is random. Allowed at beginning or end of data Live Unstacked data Up to 16m cases allowed Yes Not allowed 1 or more Forecasting Command
Forecasts time series data using the moving averages method, simple
exponential smoothing, Holt's exponential smoothing method for capturing trend, and Winters' exponential smoothing method for capturing seasonality. Allowed at beginning of data only Live Unstacked data Up to 32,000 cases allowed Yes Not allowed 1 or more Regression & Classification Regression Command Runs a variety of regression analyses including Simple Multiple, Stepwise, Forward, Backward and Block.
Allowed at beginning, middle and end of data Static Unstacked data Up to 16m cases allowed Yes Not allowed 1 depende nt; 1-250 indepen dent Logistic Regression Command Performs a logistic regression analysis on a data set. This is essentially a nonlinear type of regression analysis where the response variable is binary: 0 or 1.
Allowed at beginning, middle and end of data
Static Stacked data Up to 16m cases allowed Yes Not allowed 1 depende nt; 1-250 indepen dent Discriminant Analysis Command Performs a discriminant analysis on a data set. There should be a "category" variable that specifies which of two or more groups each observation is in, plus one or more explanatory
Allowed at beginning, middle and end of data
Static Stacked data Up to 16m cases allowed Yes Not allowed except in depend ent variable s 1 depende nt; 1-250 indepen dent
Procedure Description Missing
Data? Live vs. Static Reports
Data
Requirement Multi-Range Data? Invalid Data # of Vars. Quality Control Pareto Chart Command
Produces Pareto chart that allows you to see the relative importance of categorized data. Allowed at beginning, middle and end of data Static Unstacked data Yes Ignored 1 category , or 1 value and 1 category X/R Charts Command
Produces X and R charts that allow you to see whether a process is in statistical control. Not allowed Static Unstacked data Up to 32,000 cases allowed No Not allowed 2-25 P Chart Command
Produces P charts that allow you to see whether a process is in statistical control. Not allowed Static Unstacked data Up to 32,000 cases allowed No Not allowed 1 variable 1 size variable C Chart Command
Produces C charts that allow you to see whether a process is in statistical control. Not allowed Static Unstacked data Up to 32,000 cases allowed No Not allowed 1 U Chart Command
Produces U charts that allow you to see whether a process is in statistical control. Not allowed Static Unstacked data Up to 32,000 cases allowed No Not allowed 1 Non-Parametric Tests Sign Test
Command Performs hypothesis tests for the median of a single variable or for the median of differences for a pair of variables
Allowed at beginning, middle and end of data
Live Stacked and unstacked data Up to 16m cases allowed Yes Ignored 1-250 (one-sample analysis) Exactly 2 (two-sample analysis; paired sample analysis)
Procedure Description Missing
Data? Live vs. Static Reports
Data
Requirement Multi-Range Data? Invalid Data # of Vars. Wilcoxon Signed-Rank Test command
Performs hypothesis tests as does the Sign Test but assumes that the probability distribution is symmetric Allowed at beginning, middle and end of data
Live Stacked and unstacked data Up to 16m cases allowed Yes Ignored 1-250 (one-sample analysis) Exactly 2 (two-sample analysis; paired sample analysis) Mann-Whitney Test Command
Performs a hypothesis test on two samples
Allowed at beginning, middle and end of data
Live Stacked and unstacked data Up to 16m cases allowed Yes Ignored 1-250 (one-sample analysis) Exactly 2 (two-sample analysis; paired sample analysis) Data Utilities Stack Command
Takes a data set with separate variables for each group in separate columns, and allows you to "stack" them into two columns: a "category" column, and a "value" column. Depending on the type of analysis, the stacked data set might be easier to work with than the unstacked version. Yes – anywhere in variable Static Unstacked data only Up to 65535 cases allowed No n/a 1-100 Unstack Command
Does the exact opposite of the Stack procedure.
Yes – anywhere in variable
n/a Stacked data only Up to 16m cases allowed Yes n/a 1-32 Dummy Command Creates dummy (0-1) variables based on existing variables. Yes – anywhere in variable Live Unstacked data only Up to 16m cases allowed Yes n/a 1
Procedure Description Missing
Data? Live vs. Static Reports
Data
Requirement Multi-Range Data?
Invalid Data # of Vars.
Combination Command
Creates a new variable from a pair of numeric variables, a category and numeric variable or two category variables Yes – anywhere in variable Live Unstacked data only Up to 16m cases allowed Yes Not allowed 2-32 from same dataset Interaction Command
Creates a new variable by taking the product, sum, average, min, max or min-max range from one or more variables. Yes – anywhere in variable Live Unstacked data only Up to 16m cases allowed
Yes n/a 2 value vars., or 1 value and 1 category var, or 2 category var Lag Command Creates a new lagged
variable based on an existing variable. A lagged variable is simply a version of the original variable, "pushed down" by a number of rows equal to the lag. Yes – anywhere in variable Live Unstacked data only Up to 16m cases allowed Yes Ignored 1 Transform
Command Applies any of four nonlinear transformations to any variables you select - natural logarithm, square, square root, or reciprocal - to create a new variable
Yes – anywhere in variable
Live or
static Unstacked data only Up to 16m cases allowed
Yes Ignored 1-100 Difference
Command
Creates any number of difference variables from an original variable. Yes – anywhere in variable Live Unstacked data only Up to 16m cases allowed Yes n/a 1 Random Sample Command
Allows you to generate any number of random samples from a given data set, where sampling is with or without replacement.
Yes – anywhere in variable
Static Stacked data only
Up to 16m cases allowed
StatTools Menu – DataSets
Data Set Manager Command
Defines StatTools data sets and variables, or edits or deletes an existing data set and variables
The Data Set Manager command allows you to define your data sets
and variables. Once data sets and variables are defined, they may be analyzed in StatTools procedures. The Data Set Manager dialog box allows you to add or remove data sets, name a data set, specify the layout of the variables in a data set, and name the variables in a data set.
StatTools is analogous to most stand-alone statistical software packages in that it is structured around variables. For most analyses it is required that you work with a data set, or a set of statistical variables, often located in contiguous columns with variable names in the first row of the data set. You can then use these predefined variables when you run statistical analyses, without re-selecting the data you wish to analyze over and over.
Each variable in a data set has a name and a range of Excel cells associated with it. The selected Layout specifies how variables are located within a data set. A typical variable layout is Columns with one variable per column, but variables may also be laid out by Rows. A data set can include multiple blocks of cells, allowing you to put data on different sheets in the same workbook.
When you are defining a data set, StatTools attempts to identify the variables in a block of cells surrounding the current selection in Excel. This can make it quick and easy to set up a data set with variable names in the top row and variables laid out by column.
The lengths of the columns in your data set do not necessarily have to be equal. For example, you could have two variables, Weight_Men
and Weight_Women, with different numbers of observations.
However, for many analyses, StatTools will treat the blank cells in the shorter columns as missing data.
What Are Data Sets and Variables?
The Data Set options in the Data Set Manager dialog box include:
• New, Delete – adds a new data set, or deletes an existing
one.
• Name – specifies the name of the data set.
• Excel Range – specifies the Excel Range associated with a
data set. If multiple cell ranges have been assigned to a data set this entry will be prefaced by the label Multiple.
• Apply Cell Formatting - adds a grid and colors that identify
your data sets.
• Multiple - clicking the Multiple button in the Data Set
Manager dialog box displays the Multiple Range Selector
dialog. This dialog allows the entry of individual cell ranges that comprise the multiple cell range data set.
StatTools allows multiple cell ranges to be assigned to a single data set. A multiple range data set can be used when:
1) Each variable in a data set has more than 65536 data points (in Excel 2003 or earlier), requiring the data set to extend across multiple worksheets in the same workbook,
2) The data for a variable is located in multiple blocks scattered throughout the worksheets in a workbook.
Data Set
Manager Dialog Box
Multiple Range Data Sets
The options in the Multiple Range Selector dialog include:
• Clear All – Clears all entered ranges.
• Auto Fill – Applies the first range entered (in row 1 ) to all
visible worksheets in the active workbook, and enters these
SheetName!CellRange references in the grid
• Select – Displays a selector for highlighting a block of cells to
be used as a Data Set Range.
• Secondary Ranges Have Variable Names in the First
Column (Row) - Multiple range data sets can have variable
names labeling each column (or row, depending on the variable layout selected) in each range listed in the dialog, or variable names labeling the column or row in just the first selected range. The first selected range is the range entered in row 1 of the Multiple Range Selector dialog.
The Variables optionsin the Data Set Manager dialog box include:
• Layout – specifies how variables are structured in the Excel
range that holds the data set. The options for Layout include:
- Columns. This is the typical layout where each column in
the data set's Excel range has the data for a variable. Often the names of the variables will be entered at the top of each column.
- Rows. With this layout, each row of the data set holds
the data for a variable. This layout often is used for time series data in Excel.
• Names in First Column(or Row) – select this when you have
included the names of the variables in a data set in cells at the top of columns (or in the leftmost cells when variable layout is Rows).
Each row in the grid in the Data Set Manager dialog box lists the variables in a data set, including the name of each variable, the Excel range that holds the data points for a variable, and the Excel range name used to identify the data for the variable in Excel formulas.
• Excel Range Name - The shown range name will be used in
Excel formulas that are created in StatTools reports and graphs. These formulas allow your reports to be "live" – that is, update automatically when a variable's data changes. Having range names that are understandable to you helps to make formulas more readable.
• Output Format – specifies the format for values shown for a
variable in reports from StatTools analyses. The Auto entry specifies that StatTools will select a "best" format based on the numeric formatting applied to the cells containing the
variable's values in Excel. By clicking the arrow next to the Output Format entry, you can alternatively select a specific format to be used:
General is equivalent to Excel's General numeric format.
Fixed displays precision using the entered number of
Decimal Digits. Currency is equivalent to Excel's Currency
numeric format, and displays precision using the entered number of Decimal Digits.
Note: The desired output format can also be entered directly in the Data Set Manager dialog, using the notation
selectedFormat(#decimalDigits), such as Currency(4).
Variables Options
In a single session, StatTools allows:
• Up to 256 data sets, located in a single workbook.
• Up to 256 variables per data set. All the data for a single data set must be located in the same workbook.
• Up to 16,777,216 data points per variable.
Actual data capacities may be less than shown above depending on the system configuration and version of Excel in use. Specific StatTools analyses may have different limitations. Memory limitations of Excel itself may also affect data capacities. Note: the Data Set Manager dialog box lists all data sets and variables in the active workbook (this is the workbook listed in the caption of the Data Set Manager dialog). To list data sets in other workbooks, activate the desired workbook in Excel and display the Data Set Manager dialog.
Data Set and Variable Capacities
Data Utilities Menu
Stack Command
Converts a set of variables to stacked format from unstacked format
The Stack command allows you to convert data from "unstacked" form, where a data set includes at least two value variables, to a "stacked" form, in where the data set includes a category variable and a value variable. For example, if we are comparing mean household incomes in several different neighborhoods, then in unstacked form there would be a separate Income variable (or column) for each
Neighborhood. These columns would not need to be of equal length, that is, each neighborhood could have a different sample size. In stacked form there would be a value variable Income and a category variable Neighborhood indicating which neighborhood each household is in.
Essentially, this procedure allows you to "stack" your variables into two columns: a value column, Income, and a category column,
Neighborhood. Depending on the type of analysis, the stacked data set might be easier to work with than the unstacked version.
Stacked and Unstacked Variables
Variables are stacked using the Stacking Utility dialog box:
At least two or more variables must be selected for stacking. The selected data set is always initially treated as unstacked data. Variables can be from different data sets.
The options in the Variable Stacking Utility dialog include:
• Stacked Variable Names – specifies the name of the category
and value variables that will comprise the two variable
stacked data set. These names will appear at the top of the columns for the category and value variables.
When OK is clicked, the variables are stacked and a new data set is created for the stacked data.
Category and Value variables are required for a stacked data set. The
Category variable (sometimes referred to as the "code" variable) is simply a descriptive identifier for a related set of value variable(s). The Category variable is often a text label. Value variables, on the other hand, (sometimes referred to as "measurement" variables), are standard numeric variables which can be analyzed in statistical procedures.
If a StatTools procedure imposes limits on the number of variables to select for analysis, in stacked format that limit applies to the number of categories in the category variable. In stacked format one typically selects a single category and a single value variable, thereby
specifying multiple variables for analysis, one corresponding to each category in the category variable.
Stacking Utility Dialog Box What are Category and Value Variables? Number of Variables for Analysis in Stacked Format
Unstack Command
Converts a set of variables from stacked format to unstacked format
The Unstack command does the exact opposite of the Stack command. For example, if you start with a category variable Gender and a value variable Weight, this command unstacks them into separate
Weight_Men and Weight_Women columns.
Variables are unstacked using the Unstacking Utility dialog box:
The selected data set is always initially treated as stacked data. At least two or more variables must be selected for unstacking. One of these variables is identified as the Category variable (by checking Cat) and one or more variables are identified as Value variables (by checking Val). Variables can be from different data sets.
When OK is clicked, the variables are unstacked and one or more new data set(s) are created for the unstacked data.
Unstacking Utility Dialog Box
Transform Command
Transforms one or more variables to new variables and values based on an entered transformation function
The Transform command allows you to transform any variable with one of four possible transformations: natural logarithm, square, square root, or reciprocal. In addition, it allows you to enter a formula which will be used to calculate a transformed variable value. If there are missing values for the variable on which the transformed variable is based, there will be corresponding missing values in the transformed variable.
Variables are transformed using the Transformation Utility dialog box:
The selected data set is always unstacked data. Only variables from one data set at a time can be transformed.
Transformation Utility Dialog Box