Web application deployment:
A practical approach to capacity planning
IBM Global Services
Introduction
Your human resources organization has a new Web-based application for updating employee records. Purchasing wants to implement a new application for capital requests. Next month, your charitable contributions campaign application must be fully functional. How does an information technology (IT) organization ensure suffi-cient capacity to support these new applications while providing acceptable performance to users?
This white paper discusses the organizational model and capacity-planning processes that IBM has developed to successfully deploy over 200 Web-based applications in 1999 alone. Through this experience, we have found that:
•Capacity planning is more cost-effective and efficient if done prior to deployment •Performance problems resulting from a lack of capacity are more complex and
costly to resolve after deployment
•Capacity planning provides the information needed to strategically assess future IT requirements for new equipment, additional network capacity and new, underlying IT architectures
•Engaging an independent organization experienced in Web-application, system and network architectures helps ensure an unbiased analysis of application resource requirements. This in turn helps the deployment team to adequately prepare sys-Key Topics
Planning from inception Getting organized
Defining the best approach Standardizing processes and methodologies Collecting data Sizing and delivering
2
Planning from application inception
Many companies implement new processes only after a problem or failure has occurred. Yet often, failure results because developers do not consider system and connection complexity when designing or developing applications. In addi-tion, application developers are not always aware of the number of potential user accesses to a Web site at any given time. Without this information, capacity plan-ning is simply guesswork.
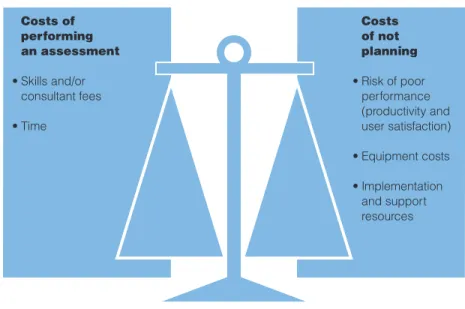
Consider this example: A company deploys a new Web-based peer review applica-tion. After a lengthy series of performance problems, users are instructed that until further notice, they should resume use of the legacy-based version of the applica-tion — a decision bound to lower productivity and decrease user satisfacapplica-tion. These types of situations can be prevented if companies learn to properly assess new applications from the outset. This requires an understanding of how Web applications can impact an organization’s IT architecture — its operating systems, server types and underlying network communication, plus its application architecture. Ensuring a standardized assessment also calls for a reliable analy-sis methodology that includes defined data input and reporting structures. It is important to understand that capacity planning represents added costs to the development and deployment of applications — expenditures that must be included in the assessment process (Figure 1).
Figure 1: Weighing the costs
Costs of not planning • Risk of poor performance (productivity and user satisfaction) • Equipment costs • Implementation and support resources Costs of performing an assessment • Skills and/or consultant fees • Time
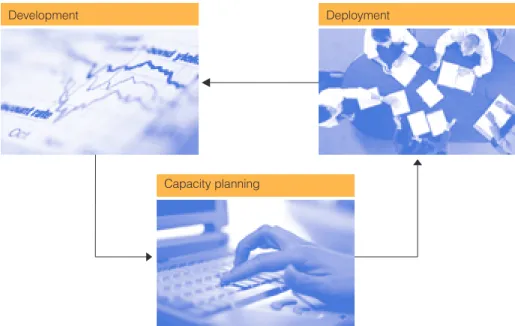
Figure 2: Process oriented organization
Development Deployment
Capacity planning
Getting organized
Applying costs appropriately and setting up the supporting organizational structure are essential when implementing a capacity planning process. Ideally, companies should design the organization to include capacity planning as part of the devel-opment costs. This not only allows for more accurate return on investment (ROI) calculations, but it also brings the development team into the process. The capacity planning team should remain a separate entity — with final decisions owned by the deployment team.
For example, if the development team were to request an exception to bypass the capacity planning process, the deployment team should be authorized to approve or disapprove the request. In some cases, applications may have a minimal impact, and incurring capacity planning costs is not financially viable.
4
In some organizations, all costs related to capacity planning are charged back to the application development team (human resources, etc.). In the Figure 2 scenario, the capacity planning team receives input from the development team, performs the capacity planning analysis and passes the results to the deployment organiza-tion. Using these results, the deployment team begins identifying and implementing resources to support the requirements of the new application. An added benefit of this process is that the development team may find that their understanding of the user community is incorrect. This provides an opportunity for design modifications to better support actual expected user access. If the development team requests an exception to the assessment process, the capacity planning team simply passes the exception along to the deployment team for approval. The deployment team owns final responsibility for the performance of the application.
Identifying skills
Finding skilled, experienced professionals to perform reliable capacity planning for Web-based applications is a challenge, especially when one considers today’s shortage of qualified IT resources. At the same time, maintaining a staff focused on continual performance is critical to help ensure prompt and accurate results. A team approach is thus the most effective way to perform capacity planning. Here is an overview of the key members of a capacity planning team:
The project manager manages project work flow and tracks results. This individual is the focal point for providing required data to all team members and forwarding exceptions and timely results to the deployment team. The project manager also monitors the communications flow between the development and deployment teams. He or she must have strong technical knowledge of each key application, the ability to focus on details and good organizational skills.
Lead technical consultants must have a detailed understanding of the architectures being employed. When benchmark data is required for a new system or application type, these key team members are responsible for acquiring the data and updating capacity models. Their role includes researching new technologies, mentoring other team members and validating sizings to confirm accuracy.
To perform an accurate analysis, you may need several capacity analysts, who perform their work using standard methodologies. They review development-team input to identify any discrepancies. For example, if the input indicates that there are 1,000 users and 50 expected transactions per day, a capacity analyst will validate this data to ensure that the final results of the analysis are a true reflection of the expected production environment. A capacity analyst should have a good understanding of application architecture and the underlying technol-ogy implementation.
Retraining or borrowing internal resources to perform capacity planning does not allow for timely or reliable analysis. Maintaining a staff of skilled professionals can help control the cost and time needed to ensure successful results. For internal Web-based applications, a five-day turnaround is advisable (once required data is collected). This can help development and deployment teams quickly assess and plan for applications that often have short development cycles.
Defining the best approach
There are two developed methodologies that can help you assess resource requirements for new Web-based applications.
Architectural sizings employ architectural design points and benchmark data to identify needed resources. Organizations must size the project and estimate resources before the application is developed to ensure that the development team is given accurate feasibility input. If the ROI is unattractive, the application may need to be redesigned, or management may decide to drop the develop-ment project altogether.
Test-based sizings use testing results to simulate user-access scenarios and run-ning production-level code. These results, along with base user information, validate architectural sizings and finalize deployment system resource requirements. If there is any discrepancy in the sizings, incorrect input from the development application team may be the cause.
Ideally, both types of sizings should be performed. However, development activities may cause one or the other to be bypassed. If an application is delayed in devel-opment but must be in production by a predefined date, test-based sizing can be performed while the application is being deployed. In this case, the analysis helps the deployment team understand what performance problems may occur, enabling them to quickly resolve resource issues relating to insufficient capacity.
6
Standardizing processes and methodologies
By using a proven methodology and following an established process, organizations can achieve accurate results from both types of sizings. The methodology should include workflow, data-collection definition and process, plus implementation of the analysis. The standard process or workflow can vary slightly, depending on which sizing is performed. The capacity team should document a risk factor of high, medium or low, based on the quality of information provided for the capacity analy-sis. This places the responsibility on the development team to provide quality information for quality results. In the case of an exception request by the develop-ment team, the capacity planning team simply passes the request along to the deployment team for approval.
The process steps for each type of sizing are: •Architectural sizing process:
— Workload management is initiated by the project manager — Information is received from the development group and checked
for completeness
— If new benchmark data is required, the project manager will pass the project to the technical consultant
— If existing benchmark data is available, the project is assigned to an analyst with matching skills for capacity assessment
— When standard benchmark data is available, the analysis is performed and results documented
— The project manager makes sure that results are received by the deploy-ment team.
•Test-based sizing process:
— Workload management is initiated by the project manager — Information is received from the test center
— Assignment is made to an analyst with matching skills for validation sizing — The analysis is performed and results are documented
— The project manager makes sure that results are received by the deploy-ment team.
Collecting data
To properly determine resource requirements for an application, the capacity planning team requires architectural information, along with a functional description of anticipated usage. The completeness and accuracy of the sizing depends on the quality of the information received. When portions of information are unknown or missing, the risk factor for incorrect sizing increases.
The capacity planning team uses the following type of information to drive the capacity planning analysis:
•Percentage of new function supplied by solution •Percentage of new data elements created •Business-use scenarios
•Data transferred to or from an information warehouse •Solution architecture definition:
— Business function, scenarios and supporting models
— Data architecture, solution architecture — business and deployment architecture diagrams
— Technical architecture and schematic (client, server, network, Web) — Build/buy assessment
•Operating systems •Type of Web server
•Network protocol: TCP/IP, SNA, IP Dial, etc. •Subnetwork protocol: FDDI, ISDN, ATM •Data access services: DB2,®
Lotus®
Approach •Programming languages: Java,TM
Perl, SAP, LotusScript •Presentation services: Netscape, SAP GUI
•Application/workgroup services: SAP, CICS®
•Object management services: SOM®
/DSOM •Communication services: DCE RPC, MQSeries,®
SAP ALE •Distribution services: NFS, DFS, Kerberos
•Systems management: SNMP, AntiVirus, ADSM, TME
•Common Gateway Interface (CGI): Total no., languages, no. of times called •Application interface with legacy data/systems
•Definition of performance exit criteria: end-user response and data throughput. Once you have defined the information input, the best approach is to develop standard worksheets or information templates that can be easily completed by the development team.
8
Performing the sizing and delivering the results
Once the capacity team has the information for the sizing, it can apply standard calculations to produce results. The following is an example of an architectural sizing that IBM capacity planning specialists completed for a health care benefits enrollment application. The risk is indicated as “medium,” based on the detail of the information initially provided. Using this information, the deployment team identifies available resources and begins acquiring additional resources to support the application.
This capacity assessment report is for the Web application server only, and is based on the information provided in the following document(s): 1. Human Resources Access Web
(HRAWEB) authentication document 2. Enterprise Web Management (EWM)
hosting template
3. Health care attachment information 4. Data transferred to or from an
infor-mation warehouse
5. Benefits enrollment architecture design
6. Web Enterprise Programming Organization (WEPO) questionnaire. Capacity assessment
Server capacity is based on a standard configuration of an RS/6000® F50 (or
H-50) with four CPUs.
The recommendation is that this application be deployed on one dedicated midrange server or two dedicated low-end servers (RS/6000 43P model 240 with two CPUs) with eNetwork DispatcherTM for
load balance.
Lotus DominoTM Go Webserver: One
dedicated midrange server, or two low-end dedicated servers. 1. The Health care application
provides the Internet access. When fully deployed, it will support a maximum of 500 concurrent users in peak session and 100,000 employee health plan enrollments in October. At that time, it is estimated that it will
require 60 percent of the equivalent CPU capacity of a RS/6000 F50 with four CPUs.
2. If two dedicated low-end servers are used via eNetwork Dispatcher for load balance and redundancy, the server CPU usage will be 30 per-cent each.
Assumptions:
•According to the input from the WEPO questionnaire, the Web site should sat-isfy 100,000 health plan enrollments in October and a maximum of 500 con-current users during the final week of enrollment. These figures are the basis for the workload assumptions.
•Each end user will access two forms, three medical options and two work-sheets. An end user will complete ten Web transactions (including login and logout) during each user session of 15 minutes.
•The Health care application uses sophisticated technology, including a WebSphereTM application server,
FastCGI for retrieval and updating of data, Servlet for user information authentication, SSL for secure trans-actions, Cookie for user sessions, and JavaScriptTM for external MVS® DB2
access. This application is highly CPU-intensive.
•The capacity team assumes that the Web page size is about 20 KB on average, and it will use this sizing to estimate the network bandwidth. Risk factor: Medium
This capacity assessment report is for the Health care GWA Domino Go Server only, and is based on the information provided in the XPRS Test Report for Health care.
Capacity assessment
1. Server capacity is based on the RS/6000 7026-H50 332 MHz with four CPUs.
The recommendation is that this application be deployed with 100 per-cent CPU utilization to support 3,000 users in the peak hour. Two Domino GO servers will share 50 percent of the workload each, or three Domino GO servers will share 33 percent of the workload each.
Server percentages were calculated based on the directive that the servers run at no more than 75 percent total utilization. For example, if a location requires 100 percent of a server, then the geography will drive its server to 75 percent. If a location requires 50 percent of a server, the geography will drive its server to 37.5 percent.
Once this application was developed, the capacity team performed a test-based capacity assessment. In the following results, you will notice that the user population estimates changed. Because there are actual test results available, the team gave a risk factor of “Low.”
XPRS testing data analysis Testing environment
1. The testing benchmark of the GWA server is based on an RS/6000 7043-150 375 MHz with 256MB memory. 2. AIX®
V4.3.2, Go Server 4.6.2.6 Testing data — GWA server CPU usage 1. 221 users/hr : Average CPU utilization
of 17 percent
2. 686 users/hr : Average CPU utilization of 47 percent
3. 848 users/hr : Average CPU utilization of 72 percent
Testing data analysis based on the RS/6000 7026-H50
1. The GWA server is based on RS/6000 7026-H50 332Mhz with 4-way CPUs.
10
The RS/6000 7026-H50 server’s processing power is about 3.5 times faster than the testing machine, which is a 375 Mhz 604e CPU single proces-sor machine.
2. The testing machine’s CPU utilization is recalculated based on a RS/6000 7026-H50 server. The new CPU utili-zation is:
a. 221 users: average CPU utilization of 4.85 percent
b. 686 users: average CPU utilization of 13.43 percent
c. 848 users: average CPU utilization of 20.57 percent.
3. Based on the workload from the XPRS testing environment, the total Web-page download during the test-ing is:
a. 221 users: 2267 Web pages/hour, or 0.077 CPU second/page b. 686 users: 6809 Web pages/hour,
or 0.071 CPU second/page c. 848 users: 8484 Web pages/hour,
or 0.08728 CPU second/page. 4. The projected workload estimates
about 20,000 users for the average day and 3,000 users, or 15 percent, for the peak hour. The capacity sizing is based on the projected peak hour rate of 3,000 users. According to the testing data, the average download pages per user is about ten pages.
5. Based on the above testing data statistics, the projected peak work-load is about 30,000 pages/hour, and it takes about 0.08728 CPU second to download a Web page. Therefore, this application needs 73 percent CPU utilization to support 3,000 users in the peak hour.
Since we do not expect the server to run at more than 75 percent total utilization, the projected allocation of CPU utilization for this application is 100 percent.
6. In the initial assessment, the capacity sizing was based on 2,000 users (WEPO input) in the peak hour, and the recommended server capacity was 60 percent. Since the project team experienced last-year enroll-ment, they used 3,000 users rather than 2,000 users in the peak hour. If we adjust the number of users, then the initial assessment recommenda-tion (95 percent) is quite consistent with the XPRS testing data. Risk factor: Low
At this time, the deployment team has a very good understanding of the resource requirements needed for this application to perform well in a production environment.
Summary
To effectively provide for the high-quality performance of your Web-based applica-tions, employ a disciplined methodology for sizing your resource needs based on application architecture and the characteristics of the user community. To maintain skills and provide cost-effective analysis, establish an unbiased group of capacity analysts or consider outsourcing this activity. Focusing on capacity requirements at the start of a development project, then validating these requirements before deploying a Web-based application can help achieve higher performance and higher user satisfaction.
For more information
For more information on IBM Performance Management and Capacity Planning Services, call 1-800-426-4682 (in the US), and 919-301-4141 (from outside the US), or e-mail:
©Copyright IBM Corporation 2000 IBM Global Services
Route 100 Somers, NY 10589 U.S.A.
Produced in the United States of America 03-00
All Rights Reserved
IBM, AIX, CICS, DB2, eNetwork Dispatcher, MQSeries, MVS, RS/6000, SOM, WebSphere and the e-business logo are trademarks or registered trademarks of International Business Machines Corporation in the United States, other countries, or both.
Lotus is a registered trademark and Domino is a trademark of Lotus Development Corporation. Java and all Java-based trademarks are trademarks of Sun Microsystems, Inc. in the United States, other countries, or both. Other company, product and service names may be trademarks or service marks of others. References in this publication to IBM products and services do not imply that IBM intends to make them available in all countries in which IBM operates.
IBM Integrated Technology Services organization in the United States, part of IBM Global Services, design and development of services offerings, is registered to the ISO 9001-1994 international quality standard.