Abstract—During the past decade, applying nonparametric operation research problems such as Data Envelopment Analysis(DEA) has received significant consideration among researchers. In this paper, a new DEA-based SBM-FDH model is introduced. Productivity evaluation for banking systems in Malmquist Productivity Index (MPI) based on the proposed model has been compared with Slack Based Measurement (SBM) and Free Disposal Hull (FDH). The obtained results confirm the high performance of the proposed model in comparison to the other models used in this paper.
Index Terms— Data Envelopment Analysis; Slack Based Measurement; Free Disposal Hull; Malmquist Productivity Index; SBM-FDH
I. INTRODUCTION
DEA is a nonparametric mathematical approach that widely used for measuring efficiency of decision-making units (DMUs). There is an extensive body of literature on the application of the DEA on different areas, including the cement industry [1], healthcare [2,3], expert systems [4-6], power industry [7,8] and other optimization well-known methods [9-13] Similarly, FDH is a nonparametric method to measure the efficiency of DMUs. It relaxes the convexity assumption of the basic DEA models. While DEA model uses a linear programming problem, the FDH deals with a mixed integer programming problem. It has been implemented in different industries, including banking [14]. Besides, SBM uses a non-radial efficiency measure that is computed as a ratio of the average input reductions over the average output increases. It has some attractive features, such as efficiency indication, monotonicity, and unit invariance [15]. As an example, it has been applied in efficiency and risk estimation in banking [16].
The innovative content of this paper is to introduce a new DEA-based SBM-FDH model, which is a methodological strength in investigating the DEA model. The productivity evaluation for the banking system has been applied as a case study. Finally, we hope that the results of this study can be regarded as one of the resources for making policy suggestions and management strategies.
The paper is organized as follows: Section 2 and 3 reviews the FDH and SBM models, respectively. Section 4 and 5 describe the SBM-FDH proposed model and MPI for the proposed model. In Section 5, Inputs and outputs descriptions
Published on May 21, 2020.
Mirpouya Mirmozaffari, Gohar Azeem, Azam Boskabadi, Jithin John, Aditya Vaishnav are with the Department of Industrial Manufacturing and Systems Engineering, The University of Texas at Arlington, USA.
Ali Aranizadeh is with the Department of Electrical Engineering,
Amirkabir University of Technology, Iran.
(Corresponding e-mail: [email protected])
are provided. Discussion in MPI-SBM, MPI-FDH, MPI-SBM-FDH models is presented in sections 7-9. Finally, in Sections 10 and 11, results and conclusions are derived.
II. FDH MODEL
One of the main classes of DEA technologies are free disposal hulls (FDH) categorized as non-convex models. These models evaluate the efficiency of production units or DMUs, where a convexity relaxation of basic DEA is considered. FDH models are typically solved as mixed integer programming problems as opposed to basic DEA models with a linear programming framework [17]. They were originally introduced by Deprins et al. [18], and later an extension of FDH models was studied by Lovell et al. [19]. In an FDH model, the producible pairs of inputs and outputs are members of the so-called production possibility set. Figures 1 and 2 demonstrates that if a pair is a part of the set, then the activity (x, y) also belongs to for any positive scalar t, also seen in CCR and CRS models.
Fig. 1. Production possibility sets
Fig. 2. Production possibility sets in CRS, VRS, and FDH
A Novel Improved Data Envelopment Analysis Model
Based on SBM and FDH Models
Mirpouya Mirmozaffari, Gohar Azeem, Azam Boskabadi, Ali Aranizadeh, Aditya Vaishnav, and Jithin John
FDH assumes Variable Return to Scale (VRS) like BCC models. The production possibility set in the FDH model can also be defined using CCR and BCC models. Suppose
(𝑥!, 𝑦!) and (𝑥", 𝑦") are elements of P; then, for any positive
scalars, we can show that (𝑥!+ 𝑥") and (𝑦!+ 𝑦")) are also
components of P which confirms the convexity of the set. Another property of FDH models is that for all pairs that belong to, any pairs with more input and less output are also reproducible, which is called the free impossibility property. The frontier line for the FDH model is developed by the observed inputs and outputs, which makes it prone to failure. Figure 3 illustrates the stepwise shape of P for FDH models. The frontiers are defined by two inputs, and one output for six production units labeled from A through F. As seen in the figure, for the BCC model, A, B, and C are efficient DMUs whereas, for the DFH mode, A, B, C and F are efficient. The efficiency of E in the BCC and FDH models is obtained by (1) and (2) respectively:
𝜃!.#$$.%&'()*+,%-&)-.= 𝑂𝐸//𝑂𝐸 (1) 𝜃!.012.%&'()*+,%-&)-. = 𝑂𝐸3/𝑂𝐸 (2)
FDH models can be input-oriented, where the goal is to minimize the inputs while meeting the given output levels. Another group of the FDH models is the output-oriented ones, where the objective is to maximize the outputs with no additional input requirements.
Fig. 3. FDH Input-Oriented Efficiency Measures
The efficiency scores are between 0 and 1. In general, the efficiency scores of the input-oriented FDH models are more than the efficiency scores of the input-oriented VRS models. In contrast, the efficiency scores of the input-oriented VRS models are significantly more than the input-oriented CRS models. This means that the production possibility set of FDH is a subset of VRS and CRS model
So, we have the following relation:
𝜃!.012.%&'()*+,%-&)-.
≥ 𝜃!.#$$.%&'()*+,%-&)-. (3) ≥ 𝜃!.#$$.%&'()*+,%-&)-.
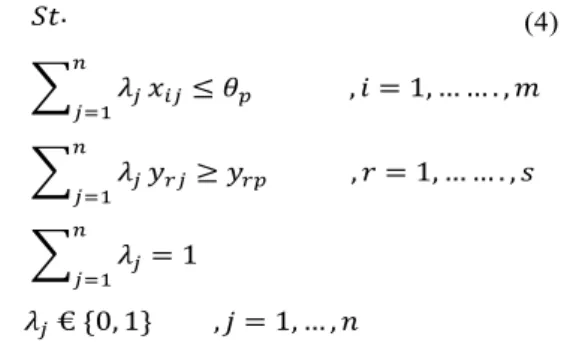
The FDHIOis represented as follows:
𝑀𝑖𝑛𝜃 𝑆𝑡. (4) 3 𝜆5 & 563 𝑥%5≤ 𝜃' , 𝑖 = 1, … … . , 𝑚 3 𝜆5 & 563 𝑦,5≥ 𝑦,' , 𝑟 = 1, … … . , 𝑠 3 𝜆5 & 563 = 1 𝜆5 € {0, 1} , 𝑗 = 1, … , 𝑛 III. SBM FOR CRS AND VRS MODELS
The additive models are commonly called Slack Based Measure (SBM). This model shows the input extra, and the output lack simultaneously with inward at a point on the efficient frontier. In scientific relationships, the SBM-CRS model is given as:
𝑀𝑖𝑛𝑍 = 3 𝑆%* 7 %63 + 3 𝑆, 8 9 𝑖 = 1 𝑆𝑡. (5) 3 𝜆5 & 563 𝑥%5+ 𝑆% * = 𝑥% , 𝑖 = 1, … … . , 𝑚 3 𝜆5 & 563 𝑦,5− 𝑆, 8 = 𝑦, , 𝑟 = 1, … … . , 𝑠 𝜆5, 𝑆, 8 , 𝑆%*≥ 0 , 𝑗 = 1, … , 𝑛
The key SBM goal is to attain the highest value of the input and output slacks in the assumed DMUs. DEA calculates the efficiency of each observation based on the frontier that shows all the descriptions. Inefficient DMUs can be value-added (changed to the efficient frontier line) with anticipated instruction for growth, which are the facts along the frontier. The distance to the efficiency frontier distributes an amount of efficiency. After adding the following constrain to the SBM-CRS or relation number (5) model:
3 𝜆5
&
563 = 1 (6)
We can convert CRS to the VRS model. This is exactly like converting CCR to the BCC model.
IV. SBM-FDH PROPOSED MODEL
We combine the two abovementioned models. Showing the input extra, and the output lack simultaneously for the SMB model side and considering the mixed integer programming problem compared to the DEA model with a linear programming problem for the FDH side. Finally:
𝑀𝑖𝑛𝑍 = 3 𝑆%* 7 %63 + 3 𝑆,8 9 𝑖 = 1 𝑆𝑡. (7) 3 𝜆5 & 563 𝑥%5+ 𝑆% * = 𝑥% , 𝑖 = 1, … … . , 𝑚 3 𝜆5 & 563 𝑦,5− 𝑆, 8 = 𝑦, , 𝑟 = 1, … … . , 𝑠 3 𝜆5 & 563 = 1 𝜆5, 𝑆, 8 , 𝑆%*≥ 0 , 𝑗 = 1, … , 𝑛 𝜆5 € {0, 1} , 𝑗 = 1, … , 𝑛
V. MPI FOR THE PROPOSED MODEL
The MPI is measured to assess productivity growth based on the reference technology. The following two main topics are used in the calculation of MPI development:
• The first issue is the quantity of productivity change over the period.
• On the other hand, second is to decompose changes in productivity into what are generally denoted as a catching-up result or technical efficiency change (TEC) and a frontier shift result or technological change (TC).
MPI measures the total factor productivity change of a DMU between two periods. The idea of productivity typically denoted as labor productivity. This idea is related to TFP, defined as the product of efficiency change (catch-up) and technological change (frontier-shift). If TFP value is more than one, this specifies a progressive TFP growth from period (t) to period (t+1). However, an amount of less than one designates a reduction in TFP development or performance relative to the preceding year. In fact:
Malmquist Productivity Index (MPI) = TE C × T C (8 )
The MPI can be stated through distance function(E) based on the two following equations applying the reflections at time t and t+1[20]. 𝑀𝑃𝐼) := 𝐸) :(𝑥)83+ 𝑦)83) 𝐸) :(𝑥)+ 𝑦)) (9) 𝑀𝑃𝐼)83 := 𝐸)83 :(𝑥)83+ 𝑦)83) 𝐸)83 :(𝑥)+ 𝑦)) (10)
The geometric mean of two MPI in equations (9) and (10) provides the equation (11):
𝑀𝑃𝐼; := (𝑀𝑃𝐼):𝑀𝑃𝐼)83:)3// = [J𝐸):(𝑥)83+ 𝑦)83) 𝐸) :(𝑥)+ 𝑦)) K . J 𝐸)83 :(𝑥)83+ 𝑦)83) 𝐸)83 :(𝑥)+ 𝑦)) K] 3// (11)
The input-oriented geometric mean of MPI can be
disintegrated using the abovementioned TC and TEC based on our proposed SBM-FDH model are as follows:
𝑀𝑃𝐼!
"= %𝑇𝐶")(𝑇𝐸𝐶!"+ #/%
(12) =𝐸&'#"(𝑥&'#+ 𝑦&'#)
𝐸&
"(𝑥&+ 𝑦&) [3
𝐸&
"(𝑥&+ 𝑦&)
𝐸&'#"(𝑥&+ 𝑦&)4 . 3
𝐸&
"(𝑥&'#+ 𝑦&'#)
𝐸&'#"(𝑥&'#+ 𝑦&'#)4] #/%
MPI specified by equations (11) and (12) can be well-defined applying DEA, such as distance function. These are the elements of MPI which can be driven from the assessment of distance functions defined on frontier technology. So, the abovementioned MPI is the most common method between the numerous techniques that have been established to evaluate a production technology [21].
Finally, we apply the abovementioned MPI for SBM, FDH, and the proposed SBM-FDH models to find the superior models. So, the final proposed model is as follow:
MPI(SBM − FDH) = (𝑀𝑃𝐼(𝑆𝐵𝑀). 𝑀𝑃𝐼(𝐹𝐷𝐻))3// (13)
VI. INPUTS AND OUTPUTS DESCRIPTIONS
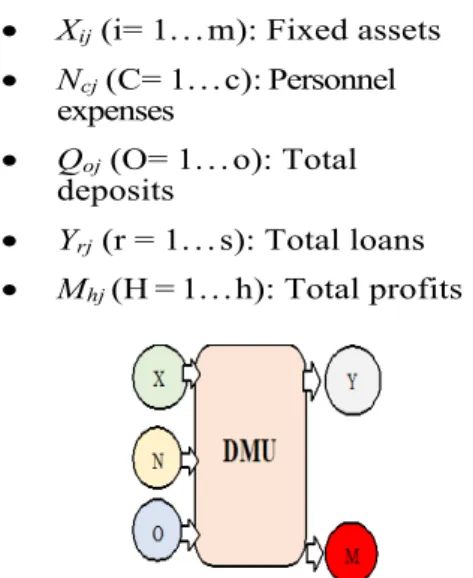
As soon as the five suggested models, the orientation, and the DMUs were established, the next step was to create which variables would be involved in the model. This is the most important step in applying DEA. After applying the DMU j (j=1. . . n) which are banks in eight selected developing countries or decision-making units, we propose the following three inputs and two outputs in our study:
• Xij(i= 1. . . m): Fixed assets
• Ncj(C= 1. . . c): Personnel expenses
• Qoj(O= 1. . . o): Total deposits
• Yrj(r = 1. . . s): Total loans
• Mhj(H = 1. . . h): Total profits
Fig. 4. Three inputs and two outputs for the three suggested models
Drake et al. [22] divide the selecting variables for financial institutes, into two following parts:
• Production: Based on Benston [23], banks are
mainly measured to be service providers for customers. The inputs involve physical variables such as staff, capital, and materials. The outputs are generally related to the services available to customers, which may include deposits and loans
• Intermediation: Based on Sealey and Lindley [24],
the critical role of banks is to gather assets and change them into investments and other profitable assets. The bank is chiefly playing an essential intermediary among extra managers and a lack of managers.
The production approach is more appropriate for assessing agencies, while the intermediation method is more suggested for bank evaluation. Several papers such as Svitalkova [25], Liu et al. [26] Zimkova [27], and Assaf et al. [28] have used the same inputs in our study. However, these papers measured the number of employees instead of personnel expenses.
Concerning the outputs, many papers used the total loans as the output, such as Drake et al. [22], Liu et al. [26], Assaf et al. [22], and Yilmaz and Güneş [29]. Numerous papers used the intermediation method also used total loan output, like in our study, based on the primary duty of banks, is to take deposits and to lend money. We consider the total profits in our research as a second output too.
The data analysis was directed applying R language and the Benchmarking package, which makes many DEA models available.
presented below: A. Dual model in 𝐹𝐷𝐻#$: 𝑀𝑖𝑛 𝜃 𝑆𝑡. (14) 3 𝜆5 & 563 𝑥%5≤ 𝜃'𝑥%' 3 𝜆5 & 563 𝑛=5≤ 𝜃'𝑛=' 3 𝜆5 & 563 𝑞+5≤ 𝜃'𝑞+' 3 𝜆5 & 563 𝑦,5≥ 𝑦,' 3 𝜆5 & 563 𝑚>5≥ 𝑚>' 3 𝜆5 & 563 = 1 𝜆5 € {0, 1}, 𝜃' 𝑓𝑟𝑒𝑒 , 𝑗 = 1, … , 𝑛 B. Dual model in SBM-VRS: 𝑀𝑎𝑥 𝑌 = 3 𝑢,𝑦,5 9 ,63 (15) + 3 𝑒>𝑚>5− 3 𝑣%𝑥%5 7 %63 2 >63 − 3 𝑓=𝑛=5− 3 𝑘+𝑞+5 ? +63 + 𝑤 $ =63 𝑆𝑡. 9 𝑢𝑟𝑦𝑟𝑗 𝑠 𝑟=1 +9 𝑒ℎ𝑚ℎ𝑗−9 𝑣𝑖𝑥𝑖𝑗 𝑚 𝑖=1 𝐻 ℎ=1 −9 𝑓𝑐𝑛𝑐𝑗−9 𝑘𝑜𝑞𝑜𝑗 𝑂 𝑜=1 + 𝑤 ≤ 0 𝐶 𝑐=1 3 𝑢, 9 ,63 ≥ 1 3 𝑒> 2 >63 ≥ 1 3 𝑣% 7 %63 ≥ 1 3 𝑓= $ =63 ≥ 1 3 𝑘+ ? +63 ≥ 1 3 𝜆5 & 563 = 1 𝑢,, 𝑒>,𝑣%, 𝑓=, 𝑘+≥ 0
C. Dual model in proposed SBM-FDH model:
𝑀𝑎𝑥 𝑌 = 3 𝑢,𝑦,5 9 ,63 + 3 𝑒>𝑚>5− 3 𝑣%𝑥%5 7 %63 2 >63 − 3 𝑓=𝑛=5− 3 𝑘+𝑞+5 ? +63 $ =63 + 𝑤 𝑆𝑡. (16) 3 𝑢,𝑦,5 9 ,63 + 3 𝑒>𝑚>5− 3 𝑣%𝑥%5 7 %63 2 >63 − 3 𝑓=𝑛=5− 3 𝑘+𝑞+5 ? +63 + 𝑤 ≤ 0 $ =63 3 𝑢, 9 ,63 ≥ 1 3 𝑒> 2 >63 ≥ 1 3 𝑣% 7 %63 ≥ 1 3 𝑓= $ =63 ≥ 1 3 𝑘+ ? +63 ≥ 1 3 𝜆5 & 563 = 1 𝑢,, 𝑒>,𝑣%, 𝑓=, 𝑘+≥ 0 𝜆5 € {0, 1}, 𝜃' 𝑓𝑟𝑒𝑒 , 𝑗 = 1, … , 𝑛
VII. DISCUSSION IN MPI-SBM,MPI-FDH AND PROPOSED
MPI-SBM-FDH MODELS
The data covers in this study are five years from 2015 to 2019 for 30 banks in the developing countries. The number of DMUs is N or 30, and the period is T or 5.
A. Discussion in MPI-SBM model
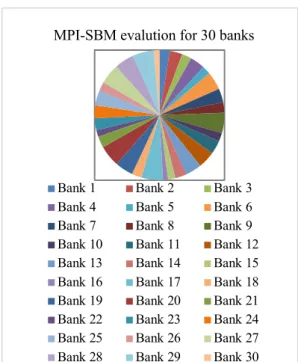
The average MPI-SBM for all banks over 2015-2019 is given in Table 1 and Fig 5.
TABLE 1. PRODUCTIVITY MEASUREMENT RESULTS BASED ON MPI-SBM FOR 30 BANKS OVER 2015-2019
Banks MPI Rank Banks MPI Rank
1 0.91 21 16 0.45 30 2 1.12 16 17 1.91 1 3 0.85 23 18 0.87 22 4 1.31 12 19 1.61 7 5 0.77 25 20 1.89 2 6 1.60 8 21 1.01 18 7 1.22 13 22 0.59 28 8 0.92 20 23 1.06 17 9 1.81 4 24 1.13 15 10 0.75 26 25 1.33 11 11 1.21 14 26 0.81 24 12 1.50 9 27 1.78 5 13 1.45 10 28 1.74 6 14 1.00 19 29 1.88 3 15 0.65 27 30 0.51 29
Fig. 5. Average productivity for MPI-SBM over 5-year periods for 30 DMUs
B. Discussion in MPI-FDH model
The average MPI-FDH for all banks over 2015-2019 is given in Table 2 and Fig 6.
TABLE 2. PRODUCTIVITY MEASUREMENT RESULTS BASED ON MPI-FDH FOR 30 BANKS OVER 2015-2019
Banks MPI Rank Banks MPI Rank
1 0.92 21 16 0.46 30 2 1.13 16 17 1.92 1 3 0.86 3 18 0.88 22 4 1.32 12 19 1.64 7 5 0.78 25 20 1.90 2 6 1.61 8 21 1.02 18 7 1.24 13 22 0.61 28 8 0.93 20 23 1.07 17 9 1.83 4 24 1.14 15 10 0.76 26 25 1.36 11 11 1.22 14 26 0.82 24 12 1.52 9 27 1.79 5 13 1.46 10 28 1.75 6 14 1.01 19 29 1.89 3 15 0.66 27 30 0.53 29
Fig. 6. Average productivity for MPI-FDH over 5-year periods for 30 DMUs
C. Discussion in MPI-SBM-FDH model
The average MPI-SBM-FDH model for all banks over 2015-2019 is given in Table 3 and Fig 7.
TABLE 3. PRODUCTIVITY MEASUREMENT RESULTS BASED ON MPI-SBM-FDH FOR 30 BANKS OVER 2015-2019
Banks MPI Rank Banks MPI Rank
1 0.93 21 16 0.47 30 2 1.14 16 17 1.93 1 3 0.87 23 18 0.89 22 4 1.33 12 19 1.67 7 5 0.79 25 20 1.91 2 6 1.62 8 21 1.03 18 7 1.26 13 22 0.63 28 8 0.94 20 23 1.08 17 9 1.85 4 24 1.15 15 10 0.77 26 25 1.39 11 11 1.23 14 26 0.83 24 12 1.54 9 27 1.80 5 13 1.47 10 28 1.76 6 14 1.02 19 29 1.90 3 15 0.67 27 30 0.55 29
Fig. 7. Average productivity for MPI—SBM-FDH over 5-year periods for 30 DMUs
MPI-SBM evalution for 30 banks
Bank 1 Bank 2 Bank 3
Bank 4 Bank 5 Bank 6
Bank 7 Bank 8 Bank 9
Bank 10 Bank 11 Bank 12
Bank 13 Bank 14 Bank 15
Bank 16 Bank 17 Bank 18
Bank 19 Bank 20 Bank 21
Bank 22 Bank 23 Bank 24
Bank 25 Bank 26 Bank 27
Bank 28 Bank 29 Bank 30
0 0,5 1 1,5 2 2,5 0 10 20 30 40
MPI-FDH evaluation for 30 banks
0 1 2 3 Bank 1 Bank 2 Bank 3 Bank 4 Bank 5 Bank 6 Bank 7 Bank 8 Bank 9 Bank 10 Bank 11 Bank 12 Bank 13 Bank 14 Bank 15 Bank 16 Bank 17 Bank 18 Bank 19 Bank 20 Bank 21 Bank 22 Bank 23 Bank 24 Bank 25 Bank 26 Bank 27 Bank 28 Bank 29 Bank 30
MPI-SBM-FDH evaluation for 30 banks
VIII. RESULTS
It can be concluded from (Table 1 and Fig 5), (Table 2 and Fig 6) and (Table 3 and Fig 7):
• SBM-FDH, FDH and SBM models have the same
ranking for all DMUs
• SBM-FDH model has the first and the highest average efficiency score over 5-years period for 30 DMUs
• FDH model has the second average efficiency score over 5-years period for 30 DMUs
• SBM model has the third average efficiency score over 5-years period for 30 DMUs
So SBM-FDH model is the best fit model for our evaluation. The horizontal axis in Fig. 5, 6, and 7 indicate the banks, and the vertical axis shows the productivity score. According to the evaluation of MPI in three suggested models in table 1,2,3, for 30 banks with quantified input and output principles:
Based on the SBM in table 1 and Fig 5:
• The 17th bank has the 1st or the highest MPI with
a productivity score of 1.91.
• The 20th and 29th banks are in the 2nd and 3rd places
with productivity scores of 1.89 and 1.88, respectively.
• The 16th bank has the 30th and the lowest MPI with
a productivity score of 0.45.
• The 22nd and 30th banks are in the 28th and 29th
places with productivity scores of 0.59 and 0.51, respectively.
Based on the FDH in table 2 and Fig 6:
• The 17th bank has the 1st or the highest MPI with
a productivity score of 1.92.
• The 20th and 29th banks are in the 2nd and 3rd places
with productivity scores of 1.90 and 1.89, respectively.
• The 16th bank has the 30th and the lowest MPI with
a productivity score of 0.46.
• The 22nd and 30th banks are in the 28th and 29th
places with productivity scores of 0.61 and 0.53, respectively.
Based on the SBM-FDH in table 3 and Fig 7:
• The 17th bank has the 1st or the highest MPI with
a productivity score of 1.93.
• The 20th and 29th banks are in the 2nd and 3rd places
with productivity scores of 1.91 and 1.90, respectively.
• The 16th bank has the 30th and the lowest MPI with
a productivity score of 0.47.
• The 22nd and 30th banks are in the 28th and 29th
places with productivity scores of 0.63 and 0.55, respectively.
The SBM-FDH model has the highest rank. FDH and SBM models are in the second and third places, respectively. Finally, the following relation is applicable
for all DMUs in all MPIs and all years:
SBM-FDH>FDH>SBM (17)
IX. CONCLUSION
Over past decades various well-known DEA nonparametric operation research models such as SBM and FDH have been proposed. In this paper, a novel DEA model based on the combination of FDH and SBM models has been proposed. The SBM-FDH model has a more positive impact on efficiency score compare with other suggested models. To evaluate the performance of the proposed model, we have tested MPI for 30 banks in developing countries. The results obtained by the SBM-FDH model provide superior results. So, the results and predictions can be helpful for managers of these banks and other managers who benefit from this approach to achieve a higher relative productivity score. Besides, managers can compare the efficiency of the current year with other similar companies over the past years.
REFERENCES
[1] M. Mirmozaffari, “Eco-Efficiency Evaluation in Two-Stage Network Structure: Case Study: Cement Companies,” Iranian Journal of Optimization (IJO), Dec. 16, 2018.
[2] M. Mirmozaffari, and A. Alinezhad, “Ranking of Heart Hospitals Using cross-efficiency and two-stage DEA,” 7th International Conference on Computer and Knowledge Engineering (ICCKE), Mashhad, pp. 217-222, 2017.
[3] A. Alinezhad, and M. Mirmozaffari, “Malmquist Productivity Index Using Two-stage DEA Model in Heart Hospital, Iranian Journal of Optimization. Volume 10, Issue 2, 2018.
[4] M. Mirmozaffari, “Presenting an expert system for early diagnosis of gastrointestinal diseases,” International Journal of Gastroenterology Sciences, Vol 1; Issue 1; Page 21-27, 2020.
[5] M. Mirmozaffari, “Developing an Expert System for Diagnosing Liver Diseases,” EJERS, vol. 4, no. 3, pp. 1-5, Mar. 2019.
[6] M. Mirmozaffari, “Presenting a Medical Expert System for Diagnosis and Treatment of Nephrolithiasis,” EJMED. May; 1:1, 2019. [7] A. Aranizadeh, M. Kazemi, H. Berahmandpour, and M. Mirmozaffari,
“MULTIMOORA Decision Making Algorithm for Expansion of HVDC and EHVAC in Developing Countries (A Case Study),” Iranian Journal of Optimization, 2020.
[8] A. Aranizadeh, I. Niazazari, and M. Mirmozaffari, “A Novel Optimal Distributed Generation Planning in Distribution Network using Cuckoo Optimization Algorithm,” European Journal of Electrical Engineering and Computer Science 3 (3), 2019.
[9] A. Azadeh, A. Boskabadi, and S. Pashapour. “A unique support vector regression for improved modelling and forecasting of short-term gasoline consumption in railway systems,” International Journal of Services and Operations Management, 21(2), 217-237, 2015. [10] A. Boskabadi. “Using support vector regression (SVR) for weekly oil
consumption prediction in railway transportation industry,” no. December 1-12, 2011.
[11] A. Boskabadi and A. Azadeh, A, “A fuzzy model for a distribution network problem in a multi-product supply chain system,” 5th national & 3rd international LOGESTICS & SUPPLY CHAIN CONFERENCE, 75-85, 2012.
[12] H. Kamalzadeh, S.N. Sobhan, A. Boskabadi, M. Hatami and A. Gharehyakheh, “Modeling and Prediction of Iran's Steel Consumption Based on Economic Activity Using Support Vector Machines,” arXiv preprint arXiv:1912.02373, 2019.
[13] S.S..Fazeli, S. Venkatachalam, R.B. Chinnam, and A. “Murat. Two-Stage Stochastic Choice Modeling Approach for Electric Vehicle Charging Station Network Design in Urban Communities,” IEEE Transactions on Intelligent Transportation Systems, 2020.
[14] I.M Tavakoli and A. Mostafaee. “Free disposal hull efficiency scores of units with network structures,” European Journal of Operational Research, Vol. 277, pp. 1027-1036, 2019.
[15] K.Tone, “A slacks-based measure of efficiency in data envelopment analysis,” European Journal of Operational Research, Vol. 130, pp. 498-509, 2011.
[16] Y. H. Chiu, Y.C. Chen, and X.J. Bai, “Efficiency and risk in Taiwan banking: SBM super-DEA estimation,” Applied Economics, Vol. 43, pp. 587-602, 2011.
[17] B. Lim, K. Lee, and C. Lee., “Free Disposal Hull (FDH) Analysis for Efficiency Measurement: An Update to DEA,” The Stata Journal, 2016.
[18] D. Deprins and L. Simar, “On Farrell Measures of Technical Efficiency, Recherches Economiques de Louvain, 49, 2, 123–137. , and H. Tulkens, ‘‘Measuring Labor Inefficiency in Post Offices,’’ in M. Marchand, P. Pestieau and H. Tulkens (Eds.), The Performance of Public Enterprises: Concepts and Measurements, North-Holland, Amsterdam, 1984, 243–267, 1983.
[19] C. Lovell, S. Grosskopf, E. Ley, J. Pastor, D. Prior, and P. Eeckaut, “Linear programming approaches to the measurement and analysis of productive efficiency,” TOP: An Official Journal of the Spanish Society of Statistics and Operations Research, 1994.
[20] K.R. Lee, C. W. Lee, B.‐I. Leem, and C. Lee, “Malmquist Productivity Index Using DEA Frontier in Stata,” The Stata Journal, Vol. 2, pp. 1– 9, 2011.
[21] R. Fare R., S. Grosskopf, M. Norris, and Z. Zhang Z. Productivity Growth, Technical Progress, and Efficiency changes in Industrialized Countries,” American Economic Review 84: 66–83, 1994.
[22] L. Drake., M.J. Hall, and R. Simper, “Bank modelling methodologies: A comparative nonparametric analysis of efficiency in the Japanese banking sector,” Journal of International Financial Markets, Institutions and Money, 19(February (1)), 1–15, 2009.
[23] G. J. Benston, “Branch banking and economies of scale,” The Journal of Finance, 20(May (2)), 312–331, 1965.
[24] C.W., Sealey and J. T. Lindley, “Inputs, outputs and a theory of production and cost at depository financial institutions,” The Journal of Finance, 32(September (4)), 1251–1266, 1977.
[25] Z. Svitalkova. “Comparison and evaluation of bank efficiency in selected countries in EU,” Procedia Economics and Finance, 12(1), 644–653, 2014.
[26] S.T. Liu. “Measuring and categorizing technical efficiency and productivity change of commercial banks in Taiwan,” Expert Systems with Applications, 37(April (4)), 2783–2789, 2010.
[27] E. Zimková. “Technical efficiency and super-efficiency of the banking sector in Slovakia,” Procedia Economics and Finance, 12(1), 780–787, 2014.
[28] G. A., Assaf, C.P., Barros, and R. “Matousek, Technical efficiency in Saudi banks,” Expert Systems with Applications, 38 (May (5)), 5781– 5786, 2011.
[29] A. Yilmaz and N. Güneş. “Efficiency comparison of participation and conventional banking sectors in Turkey between 2007–2013,” Procedia - Social and Behavioral Sciences 195(July (1)), 383–392, 2015.