Assessment of the Potential Fiscal Impacts of
Existing and Proposed
Transit-Oriented Development in the
Dallas Area Rapid Transit Service Area
Prepared for:
Dallas Area Rapid Transit
Prepared by:
Terry L. Clower, Ph.D.
Bernard Weinstein, Ph.D.
Michael Seman, M.S.
Center for Economic Development and Research
University of North Texas
Denton, TX
Executive Summary
The research reported here offers a new assessment of the fiscal impacts of
transit-oriented development associated with development of the Dallas Area Rapid Transit light rail system. The analysis considers development near existing and planned light rail stations. Our findings support the conclusion that the transit-oriented developments associated with DART Rail stations offer substantial fiscal impacts for local taxing entities. These findings include:
• The announced existing and projected values of development projects located near DART Rail stations have increased by almost 50 percent since 2005.
• While there are many factors contributing to development investment decisions, proximity to an LRT station is often an important site location factor. The total value of projects that are attributable to the presence of a DART Rail station since 1999 is $4.26 billion (see Table ES1).
• Adjusting for tax exemptions and the value of public buildings, the taxable value of real and business personal property associated with the projects reviewed in this analysis along existing DART Rail corridors and the planned Green, Orange, and Blue Line extensions exceed $2.84 billion.
• Increased taxable property values associated with the rail stations have the potential to generate on-going annual tax revenues totaling:
o $16.8 million for DART member cities;
o Over $46 million for area school districts;
o $6.6 million that will be shared by Dallas and Collin counties;
o Approximately $2.3 million each year that will be shared by Dallas County Community College District and Collin County Community College District;
o As much as $6.7 for Parkland Hospital in new annual revenues attributable to DART-related transit-oriented development.
• Based on our fiscal planning model, the retail component of transit-oriented-development projects in the DART service area will generate over $660 million in annual taxable retail sales boosting local municipal revenues by $6.6 million annually.
• Total local fiscal impacts of development associated with DART Rail is estimated at $23.5 million each year once all announced projects are completed.
• These same taxable retail sales will generate over $41 million in revenue for the State of Texas.
• In total, once all announced projects are completed, state and local tax revenues associated with development near DART Rail stations will exceed $127 million per year.
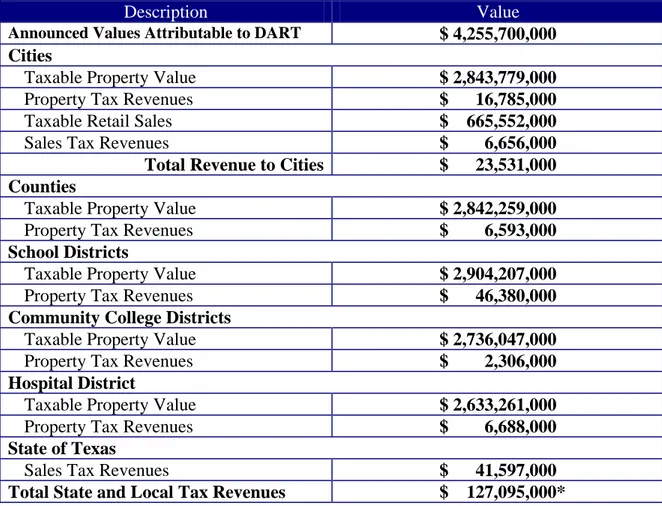
Table ES1
Potential Fiscal Impacts of Existing and Proposed
Transit-oriented Development in the Dallas Area Rapid Transit Service Area Annual Estimates at Buildout
Description Value
Announced Values Attributable to DART $ 4,255,700,000 Cities
Taxable Property Value $ 2,843,779,000
Property Tax Revenues $ 16,785,000
Taxable Retail Sales $ 665,552,000
Sales Tax Revenues $ 6,656,000
Total Revenue to Cities $ 23,531,000 Counties
Taxable Property Value $ 2,842,259,000
Property Tax Revenues $ 6,593,000
School Districts
Taxable Property Value $ 2,904,207,000
Property Tax Revenues $ 46,380,000
Community College Districts
Taxable Property Value $ 2,736,047,000
Property Tax Revenues $ 2,306,000
Hospital District
Taxable Property Value $ 2,633,261,000
Property Tax Revenues $ 6,688,000
State of Texas
Sales Tax Revenues $ 41,597,000
Total State and Local Tax Revenues $ 127,095,000*
* Includes local property taxes and state and local sales taxes. Sources: Dallas Central Appraisal District, Media reports, Chambers of Commerce, Developers, DART, Authors’ estimates.
Introduction
The Dallas Area Rapid Transit (DART) light rail system is heralded as a success by organizations and reviewers across the nation and in countries around the globe. Having exceeded ridership expectations from the start, DART light rail services are embraced by an increasing number of citizens in the region. Their success has spurred planning for light and other transit rail systems in the north central Texas region and in other major metropolitan areas across Texas. In addition, the presence of DART light rail stations has been linked to improved property valuations and a new generation of transit-oriented development projects in DART’s member cities.
Increasingly, the availability of high quality public transportation options is a critical component of a package of amenities available to residents of economically competitive regions. With rapidly growing populations, increasing traffic congestion, and concerns about the environmental impacts of automobile use, a first rate multimodal transit system is likely to become a necessary, if not sufficient, condition for sustainable economic growth. The market value of proximity to rail transit services has been widely recognized in the academic and professional literature. Moreover, gains in property valuations and the potential for increased sales tax revenues from commercial activities located in transit-oriented development projects offer a stream of new revenues for local taxing entities. It is these latter impacts that are the focus of this research.
Even with the demonstrated success and popularity of rail transit operations in cities across the nation, there are always concerns among municipalities about the fiscal opportunity costs of supporting local transit operations. Under current Texas law, cities that are members of DART face choices between finding alternative sources of revenue
and not participating in some activities that could be supported through local option sales taxes.1 Therefore, it is important for local taxing jurisdictions to understand the magnitude of tax revenue gains and the continuing opportunity to expand and diversify their local tax base associated with transit-oriented development projects.
The research presented here updates and expands several previous research projects conducted on the fiscal impacts of transit-oriented development associated with development of the Dallas Area Rapid Transit light rail system. Importantly, this analysis considers development at existing and planned light rail stations. We begin with a review of the broader literature on the impact of transit rail stations on property values and cover some of the findings of our previous analyses. Following the literature review we describe the methodological approach used in this analysis and detail the sources of data and assumptions made in conducting the reported research. We then present our findings and finish with conclusions and implications of our research findings.
Review of Literature /Previous Findings
There is a growing body of research examining the impacts of urban rail transit systems on residential and commercial property values and other sources of municipal revenue. In the following we review a sample of the published research illustrating these impacts and offering guidance on how transit-oriented development affects municipal revenues.2
1
Transit authority sales taxes are one of several local sales tax options available to cities to fund economic and community development programs, support reductions in local property tax rates, and pay for other specified municipal programs. However, transit taxes count against state mandated local sales tax rate caps, meaning that cities with transit districts are limited in their ability to raise designated tax revenues for certain activities.
2
Portions of this literature review are drawn from previous papers such as Clower and Weinstein (2002) and Weinstein, Clower, and Gross (1999).
Our review of the relevant research begins in the 1960s with studies that considered the broad issue of how transportation infrastructure influences urban form and, consequently, urban property values (Alonso, 1964; Mills, 1967; Muth, 1969). The central theme of this research is that that urban property values are influenced by accessibility (Kain & Quigley, 1970). Significant improvements in the transportation system resulting in increased accessibility and lower transportation costs should be capitalized in land values and result in land-use changes. However, empirical research results have not always supported this theory (Giuliano, 1989). For example, Cervero and Landis (1995) concluded that the capitalization effects of rail transit are actually extremely modest and highly variable.
Interest in the impacts of rail systems on property values began to emerge in the early-1970s with the construction of “new generation” rail transit systems in San Francisco, Washington, D.C., and Atlanta, of which more will be said shortly (Giuliano, 1989). But the first study of this ilk examined the suburban land use impacts of Philadelphia’s Lindenwold high-speed rail line, which replaced a conventional rail system in 1969 (Boyce, et al., 1972). This research concluded overall that the Lindenwold system had resulted in transportation savings and, consequently, had some positive impact on property values. But, it also muddied the issue by suggesting that the positive impacts of rail transit on property values were more apparent in lower- and middle-class neighborhoods than in higher-income areas (Mudge, 1974; Allen & Mudge, 1974; Boyce, et al., 1976). This could be reflective of the income characteristics of transit system riders in the Lindenwold case.
San Francisco’s Bay Area Rapid Transit (BART) system has received much attention from researchers. The earliest BART study to look at impacts on residential property values yielded mixed results: Only a handful of the neighborhoods studied showed noticeable impacts on property values (Lee, 1973). Two more studies concluded that BART had encouraged the decentralization of both population and employment in the Bay Area, which seems to suggest downward pressure on inner-city property values (Webber, 1976; Dyett, et al., 1979). Several other studies, meanwhile, concluded that BART depressed adjacent property values for a variety of aesthetic and social reasons, including increased noise and vibration, increased automobile traffic, the perceived accessibility of lower classes to previously higher income neighborhoods, and architecturally insensitive design treatments of rail stations (Dornbush, 1975; Burkhardt, 1976; Baldassare, et al., 1979).
At least four studies have found that BART exerts a positive influence on property values. One identified a positive effect on properties located within 1,000 feet of a BART rail station (Blayney Associates, 1978). Landis, et al. (1994) found a premium on homes with good access to the BART system. The real contribution of this particular study, however, may be that it identified an effect two decades after BART service began; in other words, there probably was a significant time lag involved in the capitalization of transportation improvements (Giuliano 1986). These findings are expanded in Cambridge Systematics’ 1998 report and a 1999 study by the Sedway Group to include multifamily, office, and retail properties in addition to single-family homes. This research shows clear rent gradients for both central business district (CBD)/urban and suburban stations. In a contrast for industrial land uses, Landis, et al. (1995) found
no property value impacts for the five California rail transit systems. This finding was supported by our 2002 study of the DART light rail system that is reviewed in more detail below.
Washington D.C.’s Metro system has received scrutiny in three studies. Two concluded that the impact of rail transit on property values was, at most, indirect and limited to areas characterized by other favorable factors such as the availability of developable land, positive economic, political and social conditions, and coordinated government policies for development (Lerman, et al., 1978; Damm, et al., 1980). Their findings supported two earlier studies that reviewed and reinterpreted the then extant body of research on rail transit capitalization and determined that rail does little to promote real economic growth absent these supporting factors (Knight & Trygg, 1977a; 1977b). A third Metro study found that rail encouraged the decentralization of population and employment and, consequently, tended to lower property values in older neighborhoods (Paget Donnelley, 1982).
In Atlanta, researchers discovered that rail transit had virtually no impact on property values (Nelson & McCleskey, 1989), while a study of Miami’s Metrorail system came to the same conclusion (Gatzlaff & Smith, 1993). Over the past decade, Portland’s MAX rail transit system has also received attention. In two studies, only very modest and spotty impacts on property values were identified (Arrington & Davis, 1987; Al-Mosaind, et al., 1994). Results of a third study hold that rail transit has had virtually no impact on property values (Dueker, 1997).
In an earlier analysis (Weinstein, Clower, & Gross, 1999) we found that a sample of properties located around DART rail stations saw increases in property values and
rents about 25 percent greater than overall county levels as well as a sample of comparable non-DART properties, with the sharpest gains posted in the Cityplace-Mockingbird-Lovers Lane corridor.
Clower and Weinstein (2002) re-examined the impact of having a DART light rail station within one-quarter mile on property values using a slightly different methodology. We found that between 1997 and 2001, median values of residential properties increased 32.1 percent near the LRT stations compared to 19.5 percent in the control group areas. For office buildings, the increase was 24.7 percent for the DART properties versus 11.5 percent for the non-DART properties. There was no impact on retail properties and a negative impact for industrial properties similar to Landis’ (1995) findings.
In 2005 we took an entirely different approach in examining the existing and potential impact of light rail stations on area property development and redevelopment. Here, we used the announced value of existing and planned projects that could be classified as transit-oriented development between 1999 and 2005. In total, we identified over $3 billion in investment at some stage of development in projects influenced by the presence of DART light rail services.
Several explanations have been advanced for the inconsistent empirical relationship identified between rail transit and property values. The first questions the theoretical premise that transit systems can affect land use. Older research by Hamer (1976) and Meyer and Gomez-Ibanez (1981) make this observation. However, an increasing body of more recent research refutes this argument (Schilling, et al., 2006; Center for Transit-oriented Development, 2007).
Another simple explanation for the counter-intuitive conclusion of most of the empirical research is that rail systems simply haven’t been given sufficient time to impact adjacent properties. The case here is that the durability of capital stock implies long time lags in land-market responses to changes in the transportation system (Giuliano, 1986). This would appear to be the case with San Francisco’s BART system, based on the work by Landis, et al. (1994).
Measurement techniques remain an issue in transit research. Though there are academic issues that can be raised, most studies, including this one, use the best data that are readily available and state clearly where assumptions replace empirical constructs.
In summary, the empirical research of the past three decades – though not without flaws – reveals that the capitalization effects of rail transit systems are not easily generalizable but are increasingly apparent as more transit-oriented approaches to land development are taken in response to public demand. These mixed signals suggest that the impacts of rail transit systems on nearby property values may be highly localized and contextual. In the following sections we describe our current approach to measuring the impact of DART rail stations on near-by property values and present our findings.
Methodology
Our current study takes a more detailed approach to estimating the fiscal impacts of announced transit-oriented development near DART rail stations using both quantitative and qualitative methodologies. Our data gathering included secondary sources such as newspapers, business and trade publications, web sites, personal
communications with key informants, and field observations. In the following, we describe our data sources and approaches used in this analysis.
The first step in assessing the value of transit-oriented development (TOD) near DART Rail stations was to review and update news stories published since 1999 on TOD projects. In many respects, since reporters are most often citing development officials in these stories, they serve the same function as a limited key informant interview. However, we do not simply take the reported estimates of investment at face value. For each project, we compare the project’s reported value with a description of the project including consideration for the project’s location. Though examining each story in detail was not practical, there were a few projects with value claims that could not be justified based on the description available in news reports. If the project was completed, we used values reported by the appropriate appraisal district. If the subject project was under construction or still on the drawing boards, we used the most detailed description available and valued the project consistent with other projects with similar characteristics. We intentionally took a more conservative approach and have possibly understated some valuations.
Recognizing the possibility, even probability, that we would miss an article describing transit-oriented development projects, and the likelihood that not every project was covered in the business press, we engaged in a two-step process of examining activities in an around existing and planned rail stations. In step one we obtained aerial photography for the years 1997 and 2005 using an online mapping tool created by the Greater Dallas Chamber of Commerce. For each existing and planned station we looked
for new or substantially changed structures near the station projects that were not covered by news stories we reviewed.
Step two in our development review process was to engage in direct field observations. Staff researchers visited every existing station and the site of every planned station to see what is happening on the ground. In some instances we were able to observe and catalog previously un-noted development projects, such as new multi-family residential properties located in close proximity to the Cedars Station, office structures in north Richardson, office-industrial flex space projects near a future station in the Stemmons Expressway corridor, and a host of industrial properties in Garland.
Observations were supplemented with information obtained from DART staff, officials with local and regional chambers of commerce, and developer representatives. Combined with the findings of our observations, we categorized the developments along multiple dimensions. First, based on observations we noted those properties that are public buildings and therefore have little or no impact on local tax revenues. Second, we made judgments on which developments would likely have occurred regardless of the presence of a DART Rail station.
In assessing the degree to which announced developments near DART Rail stations would have occurred in any case, we started with a few premises. First, stand-alone retail stores that are not a part of an overall transit district design are not included in our fiscal impact assessment. For example, the WalGreens stores located on Lancaster Blvd. and East Ledbetter Road are in close proximity to the Kiest and Ledbetter stations, respectively. However, in our opinion their site location was not likely influenced to any measurable extent by the presence of the rail station. Our judgment is also influenced by
the type of station. For example, park and ride stations may have a smaller influence on certain types of development such as big box stores that would include retailers like Kohl’s (Parker Road Station) and Linen & Things (Parker Road Station). Others we judge to be at their locations to serve a market not heavily influenced by transit rail ridership such as Central Market (Lovers Lane Station), Minyards (Ledbetter Station), and some retail banking locations (Bank of America near Lovers Lane Station). The same effect is assumed to hold true for fast food restaurants located on pad sites near rail stations. This would include a Jack-in-the-Box on Ledbetter and a Krispy Kream shop at Lovers Lane as two of several similar cases.
Other examples of structures that are near DART Rail stations that we excluded from the fiscal impact analysis include a fairly small loft apartment project located near Fair Park Station, which is currently under construction. Also, there is a large warehouse/industrial park located adjacent to Forest-Jupiter Station. This industrial park was under development long before there were light rail services. Moreover, as noted in the literature review, our previous findings and those of other researchers suggest that light rail is possibly a deterrent for warehouse-industrial land uses. It is possible that some workers at the facilities in the Miller Park development arrive via DART Rail; however, to be conservative we did not count any of the $174 million in taxable property value associated with this development in our current analysis.
More difficult to judge are those projects that are influenced by the presence of rail but represent other concerns for our fiscal impact analysis. For example, a new $265 million office park for Blue Cross and Blue Shield is located near the Galatyn Park station. Based on information obtained from key informants, the presence of the DART
Rail station influenced the site location decision. However, this building will consolidate activities from multiple existing locations as well as support new levels of activity. Therefore, some of this development value is offset by displacement from other buildings in the region. To address this concern, we decided to only count one-third of the total value of this project towards the fiscal impact analysis.
A more direct calculation of partial value includes a planned town center mixed-use project near the future Lake Highlands Station. To make room for this project, more than 1,400 old apartment dwellings will be removed. Our estimate of the value of the new project is net of the value of the existing apartments based on current appraisal district data.
Another example of allocating a portion of total development value for the fiscal impact analysis is the W Hotel at Victory Station. This $180 million project includes a hotel and high-end condominiums. Hotel operators report that many of their employees are DART riders and that the job of recruiting staff would be more difficult without the presence of a rail station. However, we expect that few of the permanent residents of the W rely on DART services for local transportation. In addition, as a part of the overall Victory development project, there were several other market factors that strongly influenced the decision to bring a W Hotel to this location. Therefore, we only count one-third of the project development value to the fiscal impact assessment.
In total, we removed over $600 million from the total value of existing or proposed developments near DART stations to account for projects that would have happened even without the presence of DART light rail services.
As noted earlier, we obtained data on taxable property values from county appraisal districts, where available. However, reports referring to some proposed properties (not yet on the tax rolls) did not include estimates of their valuation but did describe the property in terms of size. In these cases we used a fiscal planning model developed by the authors to estimate taxable values. Our planning model has been used by several north central Texas cities and other entities in assessing the taxable value of prospective residential, office, commercial, industrial, and retail properties. In addition, our fiscal impact planning model is used to estimate taxable retail sales in TOD projects with retail and/or restaurant components.
In assessing the taxable value of subject properties, we have included, where possible, the value of business personal property, which includes equipment, furnishings, and inventory. For residential properties we have made allowances for a portion of the properties to be owner-occupied and therefore qualifying for homestead taxable value exemptions. In addition, some special properties are treated differently by individual taxing authorities. For example, the old Sears building near the Cedars Station is a historic structure that is exempt from City of Dallas property taxes and partially exempt from county and hospital district taxes but pays full taxes to the Dallas Independent School District and the Dallas County Community College District. Unless specifically noted in appraisal district records, we did not adjust our estimates for any tax abatements, grants, and other economic development incentives obtained by developers or their tenants. Furthermore, we did not adjust the value of planned projects in anticipation of incentives being given to developers or building occupants. Finally, we do not count the
value of land in our estimates, though there is likely some influence on land prices due to the presence of DART light rail stations.
Other adjustments include jurisdiction considerations. For example, taxable values reported for Parkland Hospital District are only for Dallas County locations, and community college district values do not include projects associated with Denton County station locations.
A final exclusion should be considered for this analysis. The fiscal impacts presented below do not include the value of impact fees, permit fees, licenses, or other sources of revenues to member cities. Therefore, our estimates of the total impacts of TOD related development on municipal finances may be understated.
Findings
Based on the approach described above, we categorize our findings into several distinct impacts. These include:
• Value of development projects: Total announced of estimated value of projects developed, under construction, or announced.
• Value of development projects attributable to DART: Value of development projects less development that would have occurred anyway.
• Taxable property values attributable to DART: Value of development projects attributable to DART not including tax exempt properties (public structures) and the value of tax exemptions.
• Potential property tax revenues: Taxable property values multiplied by the average tax rate for municipalities, counties, and school districts in the DART service area. Does not include existing and potential tax incentives.
• Potential sales tax revenues: Municipal sales tax revenues based on estimated retail sales in TOD projects. Does not include any sales tax rebate schemes used as development incentives.
The total value for all current and projected developments near DART rail stations is $4.9 billion, which shows substantial valuation growth in existing properties as well as additions of many new projects since our 2005 study (see Table 1). While there are no significant development projects whose entire market justification is based on the presence of light rail services, proximity to an LRT station is often an important site location factor. The total value of projects that are attributable to the presence of a
DART Rail station since 1999 is $4.26 billion.
The value of taxable real and business personal property (associated with the projects reviewed in this analysis) along existing DART Rail corridors and the planned Green, Orange, and Blue Line extensions (after adjustments described in the preceding section) exceed $2.84 billion. This tax base has the potential to generate $16.8 million in property tax revenues for DART member cities each year at current estimated valuations. Area school districts will potentially gain over $46 million each year in new revenues, while Dallas and Collin counties will share about $6.6 million. The two community college districts will share about $2.3 million each year, while Parkland Hospital could see as much as $6.7 million in new annual revenues attributable to DART-related transit-oriented development.
Based on our fiscal planning model, the retail component of TOD projects in the DART service area will generate over $660 million in annual taxable retail sales. These sales will boost local municipal revenues by $6.6 million annually, bringing the total potential fiscal impact of transit-oriented development near DART Rail stations to $23.5 million each year once all announced projects are completed. These same taxable retail sales will generate over $41 million in revenue for the State of Texas.
Table 1
Potential Fiscal Impacts of Existing and Proposed
Transit-oriented Development in the Dallas Area Rapid Transit Service Area Annual Estimates at Buildout
Description Value
Announced Value $ 4,902,800,000
Announced Value Attributable to DART $ 4,255,700,000 Cities
Taxable Property Value $ 2,843,779,000
Property Tax Revenues $ 16,785,000
Taxable Retail Sales $ 665,552,000
Sales Tax Revenues $ 6,656,000
Total Revenue to Cities $ 23,531,000 Counties
Taxable Property Value $ 2,842,259,000
Property Tax Revenues $ 6,593,000
School Districts
Taxable Property Value $ 2,904,207,000
Property Tax Revenues $ 46,380,000
Community College Districts
Taxable Property Value $ 2,736,047,000
Property Tax Revenues $ 2,306,000
Hospital District
Taxable Property Value $ 2,633,261,000
Property Tax Revenues $ 6,688,000
State of Texas
Sales Tax Revenues $ 41,597,000
Total State and Local Tax Revenues $ 127,095,000*
* Includes local property taxes and state and local sales taxes. Sources: Dallas Central Appraisal District, Media reports, Chambers of Commerce, Developers, DART, Authors’ estimates.
Conclusions
Since our 2005 analysis, the announced and estimated values for transit-oriented development projects in the DART service area have grown greatly, rising by about 50 percent to $4.9 billion. Some of the reason for this increase can be attributed to the current methodology identifying some projects that may have been previously
overlooked. However, even with the change in methodology there has been a tremendous increase in TOD activity in the north Texas region. One of the key reasons for this new activity is the growing popularity of higher-density urban living designs supported by the availability of transit rail services. Riding the rail has become a part of the social fabric of north Texas with increased demand for transit rail services sparking support for expansion of the DART system and the development of new systems in the region.
Increasingly, cities that are competing for economic opportunity in a global marketplace see efficient public transportation systems, usually including a rail component, as a necessary condition for long term growth. This remains one of the best reasons for north Texas communities to invest in transit rail services. While the returns on these investments are best measured in broad economic trends, our findings support the conclusion that the transit-oriented developments associated with DART rail stations offer substantial fiscal impacts for local taxing entities. Existing and planned TOD projects near DART Rail stations will eventually provide over $46 million each year to area schools, $23.5 million to member cities, and millions to other local taxing entities. We anticipate that the scale and activity level associated with transit-oriented development in DART’s service area and other parts of north Texas will continue to rise offering even greater opportunities for local taxing authorities to see the direct and indirect benefits of supporting and investing in transit rail services.
References
Al-Mosaind, M.A., Dueker, K.J., & Strathman, J.G. (1994). Light-Rail Transit Stations and Property Values: A Hedonic Price Approach, Transportation Research Record
1400, pp. 90-94.
Allen, W.B., & Mudge, R. (1974). The Impact of Rapid Transit on Urban Development, Paper P-5246, Rand Corporation.
Alonso, W. (1969). Location and Land Use, Boston: Harvard Press.
Arrington, G.B., & Davis, J. (1987). Great Expectations: An Early Assessment of the Development Impacts of MAX, TRI-MAX, Portland, Oregon.
Baldassare, M., Knight, R., & Swan, S. (1979). Urban Service and Environment
Stressor: The Impact of the Bay Area Rapid Transit System on Residential Mobility,
Environment and Behavior 11, pp.435-450.
Blayney Associates (1978). The Study of Property Prices and Rents: BART Impact Study, Berkeley Metropolitan Transportation Commission.
Boyce, D., Allen, W.B., Mudge, R., Slater, P., & Isserman, A. (1972). Impact of Rapid Transit on Suburban Residential Property Values and Land Development: Analysis of the Philadelphia-Lindenwold High-Speed Line, final report to the U.S. Department of Transportation, Department of Regional Science, University of Pennsylvania. Boyce, D., Allen, W.B., & Tang, F.T. (1976). The Impact of Rapid Transit on
Residential Property Sales Prices, in Chatterji, M. (ed.), Space, Location and Regional Development, Pion.
Burkhardt, R. (1976). Summary of Research: Joint Development Study, Administration and Managerial Research Association.
Cervero, R., & Landis, J. (1995). Development Impacts of Urban Transport: A U.S. Perspective, in Banister, D. (ed.), Transport and Urban Development, Chapman & Hall, pp.136-156.
Center for Transit-oriented Development (2007). Realizing the Potential: Expanding Housing Opportunities Near Transit. Reconnecting America. Accessed October 4, 2007 at http://www.reconnectingamerica.org/public/reports
Clower, T., & Weinstein, B.(2002). The Impact of Dallas Area Rapid Transit Light Rail Stations on Taxable Property Valuations. Australasian Journal of Regional Studies,
8(3), 389-400.
Damm, D., Lerman, S., Lerner-Lamm, E., & Young, J. (1980). Response of Urban Real Estate Values in Anticipation of Washington Metro, Journal of Transport Economics and Policy 14, pp. 315-336.
Dornbush, D. (1975). BART-Induced Changes in Property Values and Rents, in Land Use and Urban Development Projects: Phase I, BART Impact Study, U.S.
Department of Housing and Urban Development and U.S. Department of Transportation.
Dueker, K.J. (1997). Telephone conversation.
Dyett, M., Dornbush, D., Fajans, M., Falcke, C., Gussman, V., & Merchant, J. (1979).
Land Use and Urban Development Impacts of BART, Final Report, U.S. Department of Housing and Urban Development and U.S. Department of Transportation.
Gatzlaff, D.H., & Smith, M.T. (1993). The Impact of the Miami Metrorail on the Value of Residences Near Station Locations, Land Economics 69, pp. 54-66.
Giuliano, G. (1986). Land-Use Impacts of Transportation Investments: Highway and Transit, in Hanson, S. (ed.), The Geography of Urban Transportation, Guildford. Giuliano, G. (1989). Research Policy and Review 27: New Directions for Understanding
Transportation and Land Use, Environment and Planning A 21, pp.145-159. Hamer, A. (1976). The Selling of Rail Rapid Transit: A Critical Look at Urban
Transportation Planning, Lexington.
Kain, J.F., & Quigley, J. (1970). Measuring the Value of Housing Quality, Journal of the American Statistical Association 65, pp. 532-548.
Kain, J.F. (1990). Deception in Dallas: Strategic Misrepresentation in Rail Transit Promotion and Evaluation, Journal of the American Planning Association 56, 184-196.
Keefer, L. (1983). A Review of Nine UMTA-Assisted Joint Development Projects, Urban Mass Transit Administration, U.S. Department of Transportation.
Knight, R.L., & Trygg, L.L. (1977a). Evidence of Land Use Impacts of Rapid Transit Systems, Transportation 6, 231-248.
Knight, R.L., & Trygg, L.L. (1977b). Land Use Impacts of Mass Transit, Office of the Assistant Secretary for Policy, Plans and International Affairs, U.S. Department of Transportation.
Landis, J., Guhathakurta, S., & Zhang, M. (1994). Capitalization of Transportation Investments into Single Family Home Prices: A Comparative Analysis of California Transit Systems and Highways, Institute of Urban and Regional Development, University of California at Berkeley.
Landis, J., Guhathakurta, S., & Zhang, M. (1995). Rail Transit Investments, Real Estate Values, and Land Use Change: A Comparative Analysis of Five California Transit Systems, Institute of Urban and Regional Development, University of California at Berkeley.
Lee, D.B. (1973). Case Studies and Impacts of BART on Prices of Single Family Residences, Institute of Urban and Regional Development, University of California at Berkeley.
Lerman, S.R., Damm, D., Lerner-Lamm, E., & Young, J. (1978). The Effect of
Washington Metro on Urban Property Values, Urban Mass Transit Administration, U.S. Department of Transportation.
Meyer, J.R., & Gomez-Ibanez, J.A. (1981). Autos, Transit and Cities. Boston: Harvard Press.
Mills, E.S. (1967). An Aggregative Model of Resource Allocation in Metropolitan Areas, American Economic Review 57, pp. 197-210.
Mudge, R. (1974). The Impact of Transportation Savings on Suburban Residential Property Values, Paper P-5259, Rand Corporation.
Muth, R. (1969). Cities and Housing, Chicago.
Nelson, A.C., & McCleskey (1989). Influence of Elevated Transit Stations on Neighborhood House Values, Georgia Institute of Technology.
Paget Donnelly (1982). Rail Transit Impact Studies: Atlanta, Washington, San Diego, Urban Mass Transit Administration, U.S. Department of Transportation.
Pushkarev, B., & Zupan, J. (1977). Public Transportation and Land Use Policy, Indiana. Salvesen, D. (1996). Promoting Transit-Oriented Development, Urban Land, July,
Schilling, J. et al. (2006). Route 50 BRT/TOD Corridor Study: Linking land use and transit in northern Virginia. Virginia Tech Urban Affairs and Planning Program. Retrieved October 3, 2007, from
http://www.nvc.vt.edu/uap/docs/Student%20Projects/Route_50_BRT_TOD_Stud y.pdf
Sedway Group (1999). Regional Impact Study. A report commissioned by the Bay Area Rapid Transit System.
Smith, W. (1984). Mass Transit for High-Rise, High-Density Living, Journal of Transportation Engineering 100, pp. 521-535.
Webber, M. (1976). The BART Experience -- What Have We Learned? The Public Interest 12, pp. 79-108.
Weinstein, B., Clower, T. & Gross, H. (1999). The Initial Economic Impacts of the DART LRT System. Center for Economic Development and Research, University of North Texas.
Weinstein, B., & Clower, T. (2005). The estimated value of new investment adjacent to DART LRT stations. Center for Economic Development and Research, University of North Texas.