Measuring the Effect of Social Communications on
Individual Working Rhythms: A Case Study of
Open Source Software
Qi Xuan
∗†, Mohammad Gharehyazie
∗, Premkumar T Devanbu
,
∗, Vladimir Filkov
∗ ∗Department of Computer Science, University of California, DavisDavis, California 95616–8562
†Department of Automation, Zhejiang University of Technology Hangzhou 310023, China
Email: [email protected]
Abstract—This paper proposes novel quantitative methods
to measure the effects of social communications on individual working rhythms by analyzing the communication and code committing records in tens of Open Source Software (OSS) projects. Our methods are based on complex network and time-series analysis. We define the notion of a working rhythm as the average time spent on a commit task and we study the correlation between working rhythm and communication frequency. We build communication networks for code developers, and find that the developers with higher social status, represented by the nodes with larger number of outgoing or incoming links, always have faster working rhythms and thus contribute more per unit time to the projects. We also study the dependency between work (committing) and talk (communication) activities, in particular the effect of their interleaving. We introduce multi-activity time-series and quantitative measures based on multi-activity latencies to evaluate this dependency. Comparison of simulated time-series with the real ones suggests that when work and talk activities are in proximity they may accelerate each other in OSS systems. These findings suggest that frequent communication before and after committing activities is essential for effective software development in distributed systems.
I. INTRODUCTION
Recently, much attention has been paid to social networks [1]–[3], where nodes represent different individuals and links between pairs of nodes mean the corresponding individuals are friends or directly communicate with each other. Generally, there are two reasons that can explain this great interest in networks. First, can conveniently model the topological structure of complex systems, providing a series of structural characteristics [4], [5] that can help differentiate the roles of individuals working on these systems. For example, Albert et
al. [6] and Holme et al. [7] found that the communication
efficiencies of networks are more likely to depend on the nodes with larger degrees or betweenness centralities, i.e., the network performance decreases quickly once these nodes are removed. Second, it is widely believed that network structure, or more specifically, communications themselves can influence the individual actions, and thus some cooperative behaviors such as synchronization [8]–[10] naturally emerge.
However, such influence is often difficult to measure, and
subject to conflicting viewpoints. Consider the increasing interest of developers to contribute to open source software (OSS) projects [11]–[13]. Developers communicate through emails and commit to different files in real time. Since most work on OSS is voluntary, the success of these OSS projects is mainly determined by the committing activities of developers [14], which leads to an important question [15] in this area: whether and how do the communication activities influence the committing activities? For this question, different people may have different answers before such influence can be quantified. It is often argued that social communication activities delay programming activities, since both of these activities may compete for the time resources of developers. As a result, people always prefer to find ways to reduce “communication overheads”. Baldwin and Clark [16] argued that the commu-nication and coordination in large systems can be significantly reduced by adopting proper design rules. On the other hand, in our society, productivity and communication often go hand-in-hand. In OSS projects, it can be argued that once a user finds a bug [17], [18], she would want to report them as soon as pos-sible in order to gain some sense of achievement, while once the developers received some (possibly negative) evaluations of their work, they may respond by updating the software right away, in order to preserve their reputation among the social circle of developers. In such a situation, since task-relevant information flows through communication activities, it can be argued that communication activities accelerate committing activities in the OSS projects to some extent.
Then, which is it? Do the communication activities impede committing activities or do they accelerate them? Although a recent study [19] on OSS projects indicates that there are strong correlations between the number of messages sent by an individual and the number of code changes he/she made, this result still cannot answer the above question. Clearly, both of these activities are positively correlated with the time interval over which they take place; however, this result doesn’t necessarily imply that one accelerates the other.
In order to answer this question more definitely, here we first provide the definition of working rhythm, or committing
rhythm more specifically, for developers. Then, we propose two methods to measure the effects of communication activi-ties on committing rhythms. In particular, the main contribu-tions of this paper include the following two parts:
1) Macroscopic view. We build communication networks for code developers from ten years of email records in 31 OSS projects, and utilize the local structural properties in complex network theory, such as outgoing degree and incoming degree, to quantify the social status of devel-opers. We find that the developers with higher social status, represented by the nodes with larger number of outgoing or incoming links, always have faster working rhythms and thus contribute more per unit time to the projects.
2) Microscopic view. We introduce multi-activity time-series and propose the definitions of evaluation and
response latencies between the successive committing
and incoming communication activities in order to quan-titatively measure the dependency between work and talk activities. We introduce a mechanism to generate inde-pendent simulated time-series of incoming communica-tion activities which have precisely the same statistical properties as the real ones. By comparing measurements on the simulated time-series with those on the real ones, we find that the committing and communication activities may significantly accelerate each other in OSS systems.
We study how work and talk activities interact; our find-ings suggest that frequent, interleaving communication around committing activities is essential for effective software devel-opment in a distributed setting; but our findings may have broader implications beyond OSS. Many real-world systems can be described by complex networks and individual actions can be modeled using time-series, the methods proposed here can also be used to quantify certain relationships in other areas. The rest of the paper is organized as follows. In Section II, the communication and committing data obtained from OSS projects are briefly introduced, where communication net-works and committing netnet-works are constructed and some ba-sic properties are provided. In Section III, the methodologies, including the definition of committing rhythm and the network and time-series based methods are introduced. In Section IV, the main results are obtained based on the proposed definition and methods. The paper is finally concluded in Section V.
II. DATADESCRIPTION
A total of 31 OSS projects were obtained from the Apache
Software Foundation on March 24th, 2012. For each project,
a communication social network is constructed from online developer mailing lists [20]. These mailing lists are used for communication and coordination among the normal users and developers, where each email has an ID, a sender ID, and a reference ID with date time and body. Here, the reference ID is the ID of the email that this email is in response to. In such a network, the nodes are the people sending messages on the list, if a person P1 replies to a message from another person P2,
TABLE I
SOME BASIC PROPERTIES OF THE31 OSSPROJECTS.
Project NT ND NF hkouti hdFi Accumulo 75 5 1622 3.5 833.2 Mahout 552 16 5123 4.4 698.9 Lucene 2148 41 6674 4.2 414.2 Nutch 862 16 3072 3.4 424.3 Derby 1128 35 6563 5.6 660.1 Ode 377 18 11006 3.8 1013.4 Openejb 179 38 43960 5.8 2374.0 Log4php 88 9 1409 2.1 242.0 Wicket 540 24 48045 5.5 3907.3 Log4j 540 19 5519 2.3 472.7 Bookkeeper 32 3 407 3.0 245.0 Xerces2 j 922 33 3732 1.7 347.4 Hive 321 18 7333 3.4 887.2 Axis2 java 3758 76 129978 2.8 3034.1 Hadoop hdfs 264 25 1153 2.4 171.2 Camel 844 31 36965 3.2 1713.1 Avro 284 12 3021 3.0 387.6 Abdera 196 13 3193 2.7 352.4 Cassandra 397 13 17125 3.7 1534.7 Activemq 2053 29 16788 2.2 946.3 Cxf 443 45 37867 4.2 1726.2 Log4net 297 7 1060 1.4 320.9 Ant 1406 45 11620 3.2 666.5 Empire db 8 5 2341 0.88 807.6 Axis2 c 608 24 10262 4.4 805.3 Cayenne 170 20 31489 3.8 2629.9 Log4cxx 92 6 2966 1.7 730 Harmony 709 25 14898 9.0 636.8 Pluto 265 23 5971 3.1 483.0 Solr 839 19 8534 3.76 655.8 Ivy 68 9 3513 2.3 523.2
then there is a directed link from the node representingP1 to
that representingP2. The social networks constructed by this
method are directed networks, and each nodevi in a network
will have an incoming degree kin
i and an outgoing degree
kouti representing the numbers of directed links from and to
this node, respectively. The average outgoing degree of the network is denoted byhkouti, and the average incoming degree
of the network has the exactly same value. Meanwhile, the committing activities of developers on different files in each project are gathered from the corresponding Git repository and can also be considered as a network, where a node represents a developer or a file, and a link between a developer and a file represents that the developer has contributed to the file (i.e., add some codes in this file). The committing networks constructed by this method are bipartite networks, i.e., links only exist from developers to files. A developer vD
i has a
degreedF
i representing the number of files s/he has committed.
Then the average degree hdFiin a project denotes the mean
number of files committed by a developer. Note that, in these projects, users can have multiple aliases; these were resolved using a semi-automatic approach devised by Bird et al. [19]. Several basic properties, including name of the project, number of users NT (including the developers), number of
developers ND, number of files NF, average outgoing
de-gree hkouti in the corresponding communication network,
3
1
2
3
1
2
1 2 3(a) Social network (b) Committing network
(c) Time series of committing activities
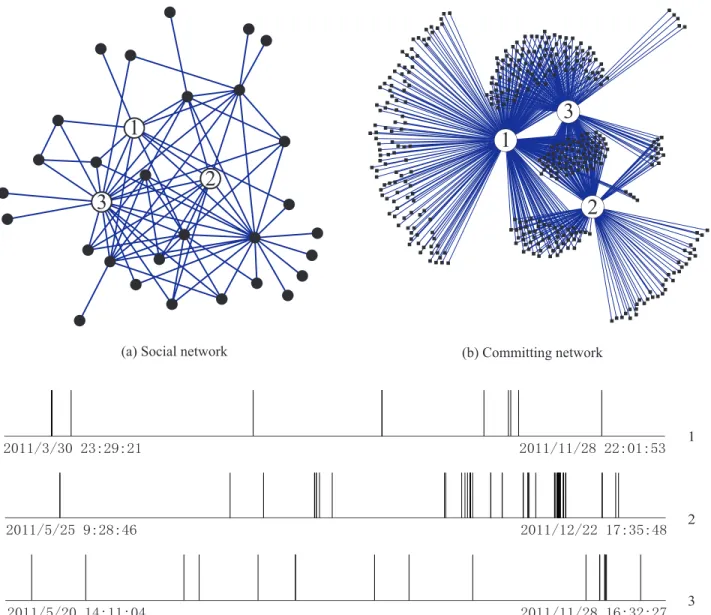
Fig. 1. The topological structure of (a) social network and (b) committing network of the project called bookkeeper, where the three marked unfilled nodes are the developers who contributed to the project and the filled nodes represent the other users and files in the corresponding networks. (c) The time-series of the committing activities of the three corresponding developers, with the time of their first and last committing activities provided, where the horizontal axis denotes time (in one second) and each vertical line corresponds to an activity of adding codes.
are presented in TABLE I. By considering all the projects together, there are totally 20465 users, 702 developers and 483,209 files. In particular, the social network structure and the committing network structure of the project called bookkeeper are shown in Fig. 1 (a) and (b), respectively, where the three developers are represented by the unfilled nodes and marked by 1, 2, and 3, respectively, while the other users and files are represented by the filled nodes, in the corresponding networks. Meanwhile, the time-series of committing activities of the three corresponding developers are visualized in Fig. 1 (c), where there is a vertical line if the developer added codes at that time.
III. METHODOLOGY
A. Definition of committing rhythm
Suppose there are totally M(M ≥2) activities for an in-dividual at different consecutive timet1, t2, . . . , tM satisfying
t1 < t2 < . . . < tM, there will beM −1 inter-activity time
buckets, denoted by
∆ti =ti+1−ti, i= 1,2, . . . , M−1. (1)
Since many human activities are Poisson processes [21] where independent events occur at a constant rateλ, the inter-activity time between two consecutive activities of an individual fol-lows an exponential distribution as folfol-lows:
P(∆t) =λe−λ∆t
10−4 10−2 100 102 104 106 0 0.1 0.2 0.3 0.4 0.5 0.6 0.7 0.8 0.9 1
T (h)
P(
∆
t<T)
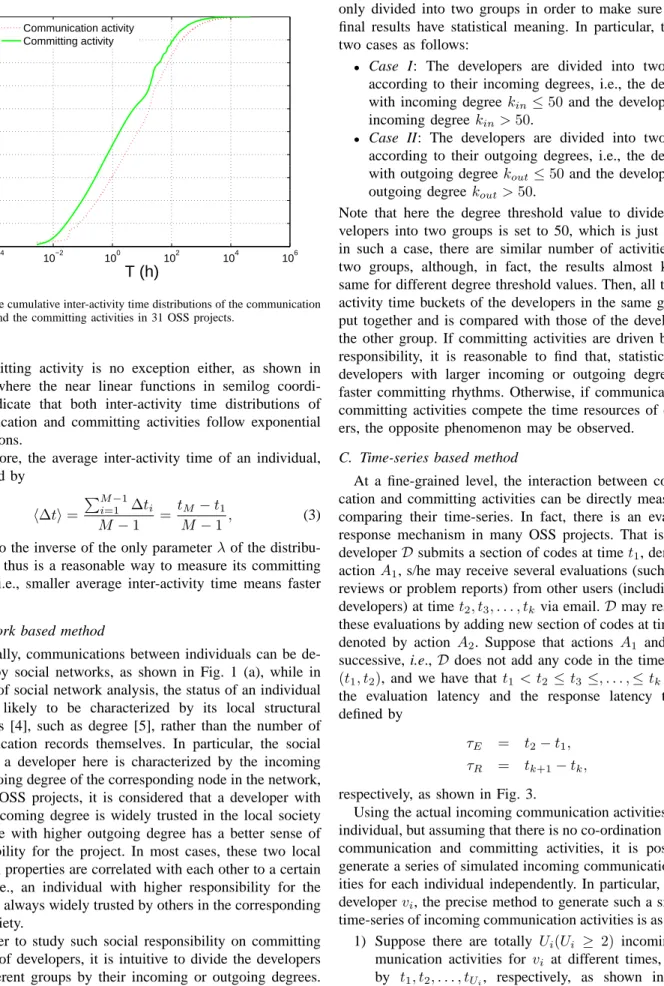
Communication activity Committing activityFig. 2. The cumulative inter-activity time distributions of the communication activities and the committing activities in 31 OSS projects.
Committing activity is no exception either, as shown in Fig. 2, where the near linear functions in semilog coordi-nates indicate that both inter-activity time distributions of communication and committing activities follow exponential distributions.
Therefore, the average inter-activity time of an individual, calculated by h∆ti= PM−1 i=1 ∆ti M −1 = tM−t1 M−1 , (3)
is close to the inverse of the only parameterλof the distribu-tion, and thus is a reasonable way to measure its committing rhythm, i.e., smaller average inter-activity time means faster rhythm.
B. Network based method
Generally, communications between individuals can be de-scribed by social networks, as shown in Fig. 1 (a), while in the area of social network analysis, the status of an individual is more likely to be characterized by its local structural properties [4], such as degree [5], rather than the number of communication records themselves. In particular, the social status of a developer here is characterized by the incoming and outgoing degree of the corresponding node in the network, since in OSS projects, it is considered that a developer with higher incoming degree is widely trusted in the local society while one with higher outgoing degree has a better sense of responsibility for the project. In most cases, these two local structural properties are correlated with each other to a certain extent, i.e., an individual with higher responsibility for the project is always widely trusted by others in the corresponding local society.
In order to study such social responsibility on committing rhythms of developers, it is intuitive to divide the developers into different groups by their incoming or outgoing degrees. Since there are only 702 developers, here the developers are
only divided into two groups in order to make sure that the final results have statistical meaning. In particular, there are two cases as follows:
• Case I: The developers are divided into two groups
according to their incoming degrees, i.e., the developers with incoming degree kin≤50 and the developers with
incoming degree kin>50.
• Case II: The developers are divided into two groups
according to their outgoing degrees, i.e., the developers with outgoing degreekout ≤50and the developers with
outgoing degreekout>50.
Note that here the degree threshold value to divide the de-velopers into two groups is set to 50, which is just because, in such a case, there are similar number of activities in the two groups, although, in fact, the results almost keep the same for different degree threshold values. Then, all the inter-activity time buckets of the developers in the same group are put together and is compared with those of the developers in the other group. If committing activities are driven by social responsibility, it is reasonable to find that, statistically, the developers with larger incoming or outgoing degrees have faster committing rhythms. Otherwise, if communication and committing activities compete the time resources of develop-ers, the opposite phenomenon may be observed.
C. Time-series based method
At a fine-grained level, the interaction between communi-cation and committing activities can be directly measured by comparing their time-series. In fact, there is an evaluation-response mechanism in many OSS projects. That is, once a developerDsubmits a section of codes at timet1, denoted by
actionA1, s/he may receive several evaluations (such as code
reviews or problem reports) from other users (including other developers) at timet2, t3, . . . , tk via email.Dmay respond to
these evaluations by adding new section of codes at timetk+1,
denoted by action A2. Suppose that actions A1 and A2 are
successive, i.e., Ddoes not add any code in the time interval (t1, t2), and we have that t1 < t2 ≤t3 ≤, . . . ,≤tk < tk+1,
the evaluation latency and the response latency then are defined by
τE = t2−t1, (4)
τR = tk+1−tk, (5)
respectively, as shown in Fig. 3.
Using the actual incoming communication activities of each individual, but assuming that there is no co-ordination between communication and committing activities, it is possible to generate a series of simulated incoming communication activ-ities for each individual independently. In particular, for each developervi, the precise method to generate such a simulated
time-series of incoming communication activities is as follows: 1) Suppose there are totally Ui(Ui ≥ 2) incoming
com-munication activities for vi at different times, denoted
by t1, t2, . . . , tUi, respectively, as shown in Fig. 4
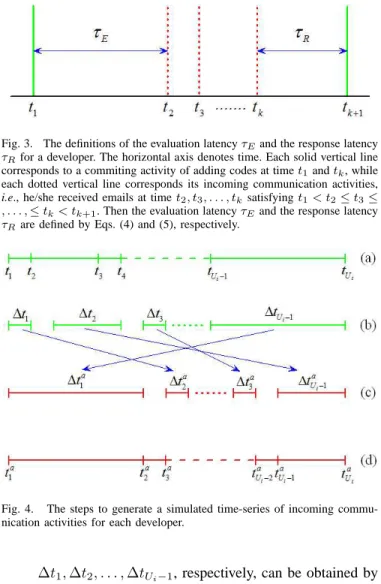
Fig. 3. The definitions of the evaluation latencyτEand the response latency
τRfor a developer. The horizontal axis denotes time. Each solid vertical line corresponds to a commiting activity of adding codes at timet1andtk, while
each dotted vertical line corresponds its incoming communication activities,
i.e., he/she received emails at timet2, t3, . . . , tksatisfyingt1< t2≤t3≤
, . . . ,≤tk< tk+1. Then the evaluation latencyτEand the response latency
τRare defined by Eqs. (4) and (5), respectively.
Fig. 4. The steps to generate a simulated time-series of incoming commu-nication activities for each developer.
∆t1,∆t2, . . . ,∆tUi−1, respectively, can be obtained by
∆ti=ti+1−ti, as shown in Fig. 4 (b).
2) Randomly rearrange the Ui − 1 time intervals and
get a new sequence of time intervals, denoted by ∆ta
1,∆t
a
2, . . . ,∆t
a
Ui−1, respectively, as shown in Fig.
4 (c). This essentially generates random orderings of “idling periods” for the developer, but ensures that his “idling” periods are exactly the same as actually observed.
3) Weld these new ordered time intervals one by one, as shown in Fig. 4 (d), and then get a new time-series ta 1, t a 2, . . . , t a Ui, satisfying that ta i =ti, i= 1, ta i =t a i−1+ ∆t a i−1, i≥2. (6) Note that the simulated time-series of incoming communica-tion activities generated by this mechanism preserves similar statistical properties as the real one, viz., the same distribution of inter-activity interval time.
By replacing the real time-series of communication activi-ties by this simulated time-series and comparing with the real time-series of committing activities, we can get two series of simulated evaluation and response latencies which are still calculated by Eqs. (4) and (5), respectively. Generally, for the real communication and committing activities, there are
several possible relationships between them, which are listed as follows and can be characterized by comparing the real and simulated evaluation and response latencies.
1) They are independent from each other. If this is the case, the distributions of real evaluation and response latencies will be statistically indistinguishable from the simulated ones.
2) They delay each other. In reality, both communication and committing activities do take time, i.e., they com-pete for the time resources of developers. In addition, developers may spend time responding to bug reports, questions, challenges etc in the emails; this might delay committing activities to a certain extent. If this is the case, the actual evaluation and response latencies will be statistically longer than the simulated ones.
3) They accelerate each other. As discussed earlier, the desire to enhance and or maintain reputations may incentivize users to respond more quickly to tasks that relate to received email correspondence. Bug finders may accelerate bug reports to gain recognition. Like-wise, programmers may be hastening to respond to bug reports, or design/coding critiques, in order to maintain their peer-reputation. If this is the case, statistically, the real evaluation and response latencies will be relatively shorter than the simulated ones.
Certainly, there are also other cases where only one kind of activities influence the other. For example, only incoming communication activities accelerate committing activities. In this case, it can be expected that, statistically, the real response latencies will be relatively shorter than while the real evalua-tion latencies will be close to the simulated ones. And other cases can be confirmed by the similar manner.
IV. RESULTS
A. Higher social status indicate faster committing rhythms
Here, we use network-based measures. As one can see, the human activity rhythms can be statistically analyzed using the cumulative inter-activity time distribution, which allows us to compare the committing rhythms of developers belong-ing to different groups. The cumulative inter-activity time distributions of the committing activities for different groups of developers characterized by their incoming degrees (Case
I) and outgoing degrees (Case II) are shown in Fig. 5 (a)
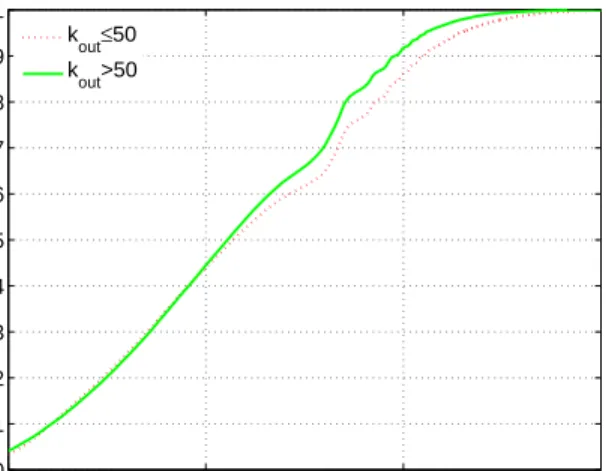
and (b), respectively. By comparison, there are more short inter-activity time intervals for the developers with higher social status, i.e., larger incoming or outgoing degrees, which indicates that, statistically, the developers with higher social status may have faster committing rhythms. More interestingly, it is found that the difference of cumulative inter-activity time distribution between the two distinct groups of developers is mainly introduced when ∆t > 1 (h) while there seems no difference between them when ∆t ≤ 1 (h), which suggests that social status can only influence the long-term, but have little effects on the short-term committing rhythms. This is reasonable because the short-term committing rhythm is more
a reflection of the developer’s programming habit, i.e., saving codes in real time when he/she commits files, which is for sure seldom influenced by social factors. Just considering the inter-activity time with length longer than one hour, the differences of committing rhythms between the developers belonging to different groups can be presented by the box-and-whisker diagrams more clearly, as shown in Fig. 6 (a) and (b), respectively.
In order to provide more credible results, simple T-tests are implemented for both cases and the statistics including the average inter-activity time length, T-value, and significance are recorded in TABLE II, wherekmeanskinfor Case I andkout
for Case II. Generally, the average inter-activity time length of the developers with larger incoming (or outgoing) degrees is much smaller than that of the developers with smaller incoming (or outgoing) degrees, and the differences in both cases are quite significant, with the relatively large T-values 20.4 and 22.3, respectively. More specifically, denote by∆tin L (or∆tout L ) and∆t in S (or∆t out
S ) the average inter-activity time
lengths of the developers with incoming (or outgoing) degree larger and smaller than 50, respectively. Then, on average, the differences of committing rhythm between the different groups of developers in two cases can be qualified by
∆tin S −∆t in L = 57.5(h), (7) ∆toutS −∆t out L = 62.6(h), (8)
respectively. These differences will be further enlarged if only the inter-activity time buckets with length longer than one hour are considered. For comparison, extra T-tests are also implemented for the two cases in this situation, and the statistics are recorded in TABLE III, where one can see that the gaps are almost doubled when only considering long-term rhythms.
TABLE II
T-TESTS FOR THE DIFFERENCES OF INTER-ACTIVITY TIME LENGTHS
BETWEEN DIFFERENT GROUPS OF DEVELOPERS INCase IANDCase II.
T-test k≤50 k >50 T-value Significance
Case I 103.0 (h) 45.5 (h) 20.4 p <10−6 Case II 111.2 (h) 48.5 (h) 22.3 p <10−6
Moreover, From Eqs. (7) and (8), one can see that, by com-parison, the social status characterized by outgoing degrees have slightly more remarkable effects than those characterized by incoming degrees on committing rhythms of developers, although these two characters are strongly correlated with each other. This phenomenon suggests that the developments of these OSS projects may be more likely determined by the strong responsibility of the developers.
B. Communication and committing activities accelerate each other
Here, we use a time-series based method. The box-and-whisker diagrams for real and simulated evaluation latencies and response latencies of all the developers are shown in Fig. 7 (a) and (c), respectively. Since both evaluation and
TABLE III
T-TESTS FOR THE DIFFERENCES OF INTER-ACTIVITY TIME LENGTH LONGER THAN ONE HOUR BETWEEN DIFFERENT GROUPS OF DEVELOPERS
INCase IANDCase II.
T-test k≤50 k >50 T-value Significance Case I 181.4 (h) 83.0 (h) 20.5 p <10−6 Case II 198.0 (h) 87.2 (h) 22.0 p <10−6
TABLE IV
T-TESTS FOR THE DIFFERENCES BETWEEN SIMULATED AND REAL
EVALUATION AND RESPONSE LATENCIES.
T-test simulated Real T-value Significance Evaluation 89.9 (h) 58.5 (h) 8.21 p <10−6
Response 97.0 (h) 57.2 (h) 9.92 p <10−6 response latencies are highly skewed, i.e., they may have some extremely large values, the boxes are flattened in these two figures. In order to present the differences of evaluation and response latencies between real and simulated cases more clearly, the y-axes are log-transformed and the corresponding results are shown in Fig. 7 (b) and (d), respectively, where one can see that both the real evaluation and response latencies are shorter than simulated ones. This phenomenon seems to suggest that these two kinds of activities may accelerate each other in reality. However, this result can be claimed only when the differences between the real evaluation and response latencies and the simulated ones are statistically significant.
The statistics of the T-tests are shown in TABLE IV. It is found that the average real response and evaluation latencies equal to 58.5 (h) and 57.2 (h), which are much shorter than the average simulated evaluation and response latencies that equal to 89.9 (h) and 97.0, respectively. The T-tests show that the differences are significant with relatively large T-values 8.21 and 9.92. According to this result and that obtained by the network based method, it is reasonable to say that, statistically, the communication activities can accelerate committing activities in reality. Note that, recent studies on human activities suggest that real distributions of inter-activity time may have relatively heavy tails [22]–[24], i.e., there may be activities separated by long periods of inactivity, which may result in more extremely long evaluation or response latencies in the real situation than in the simulated situation, as shown in Fig. 7 (a). However, since the numbers of these extremely long latencies are very small, they will hardly influence the results presented here.
V. CONCLUSION ANDDISCUSSION
In this paper, the network and time-series based methods are proposed to quantify the influence of social communications on working rhythms by analyzing the communication and committing data of 31 OSS projects in about 10 years, where some new definitions, such as evaluation and response laten-cies, and a mechanism to generate simulated communication time-series are introduced. Based on these methods, it is found that the developers with higher social status always have relatively shorter average inter-activity time and the average
real evaluation and response latencies are also shorter than the average simulated ones, which suggests that social communi-cations may accelerate committing rhythms of developers in reality. These findings can help researchers better understand the evolution mechanism of OSS systems, and then further help to design more efficient software engineering groups.
In the future, this work can be further expanded in the following several ways. First, the network and time-series methods can be used together in order to reveal whether the individuals response at different rhythms for the evaluations from others of different social status. This issue is important because it involves the efficiency and fairness and thus may determine the success of focused systems to a certain extent. Second, other microscopic multi-activities patterns need to be revealed, because more patterns will definitely provide more information about the interaction between communication and committing activities. Finally, based on these metrics, the co-evolution between different activities can be modeled.
ACKNOWLEDGMENT
The authors would like to thank all the members in our research group in the Department of Computer Science, Uni-versity of California in Davis, for the valuable discussion about the ideas and technical details presented in this paper. All authors gratefully acknowledge support from the Air Force Office of Scientific Research, award FA955-11-1-0246. QX acknowledges support from the National Natural Science Foundation of China (Grant No. 61004097).
REFERENCES
[1] John Scott, “Social network analysis”, Sociology, vol. 22, no. 1, pp. 109-127, 1988.
[2] M. E. J. Newman, S. Forrest, and J. Balthrop, “Email networks and the spread of computer viruses”, Physical Review E, vol. 66, no. 3, pp. 035101(R), 2002.
[3] Q. Xuan, F. Du, and T.-J. Wu, “Empirical analysis of Internet telephone network: From user ID to phone”, Chaos, vol. 19, no. 2, pp. 023101, 2009.
[4] L. D. F. Costa, F. A. Rodrigues, G. Travieso, and P. R. V. Boas, “Characterization of complex networks: A survey of measurements”,
Advances in Physics, vol. 56, no. 1, pp. 167-242, 2007.
[5] S. Boccaletti, V. Latora, Y. Moreno, M. Chavez, and D.-U. Hwang, “Complex networks: Structure and dynamics”, Physics Reports, vol. 424, no. 4-5, pp. 175-308, 2006.
[6] R. Albert, H. Jeong, and A.-L. Barab´asi, “Error and attack tolerance of complex networks”, Nature, vol. 406, pp. 378-382, 2000.
[7] P. Holme and B. J. Kim, “Attack vulnerability of complex networks”,
Physical Review E, vol. 65, no. 5, pp. 056109, 2002.
[8] R. E. Mirollo and S. H. Strogatz, “Synchronization of Pulse-Coupled Biological Oscillators”, SIAM Journal on Applied Mathematics, vol. 50, no. 6, pp. 1645-1662, 1990.
[9] A. Arenas, A. D.-Guilera, J. Kurths, Y. Moreno, and C. Zhoug, “Syn-chronization in complex networks”, Physics Reports, vol. 469, no. 3, pp.93?C153, 2008.
[10] Wenwu Yu, G. Chen, and J. L¨u, “On pinning synchronization of complex dynamical networks”, Automatica, vol. 45, no. 2, pp. 429?C435, 2009. [11] C. P. Ayala, D. S. Cruzes, O. Hauge, and R. Conradi, “Five facts on the adoption of open source software”, IEEE Software, vol. 28, no. 2, pp. 95-99, 2011.
[12] S. K. Sowe, I. Stamelos, and L. Angelis, “Understanding knowledge sharing activities in free/open source software projects: An empirical study”, Journal of Systems and Software, vol. 81, no. 3, pp. 431-446, 2008.
[13] A. Mockus, R. T. Fielding, and J. D. Herbsleb, “Two case studies of open source software development: Apache and Mozilla”, ACM Transactions
on Software Engineering and Methodology, vol. 11, no. 3, pp. 309-346,
2002.
[14] R. Sen, S. S. Singh, S. Borle, “Open source software success: Measures and analysis”, Decision Support Systems, vol. 52, no. 2, pp. 364-372, 2012.
[15] D. S. Pattison, C. A. Bird, and P. T. Devanbu, “Talk and work: A preliminary report”, Proceedings of the 2008 International Working
Conference on Mining Software Repositories, pp. 113-116, Leipzig,
Germany, 2008.
[16] C. Baldwin and K. Clark, Design Rules. Cambridge, MA: MIT Press, 2000.
[17] T. Gyim´othy, R. Ferenc, and I. Siket, “Empirical validation of object-oriented metrics on open source software for fault prediction”, IEEE
Transactions on Software Engineering, vol. 31, no. 10, pp. 897-910,
2005.
[18] Z. Li, L. Tan, X. Wang, S. Lu, Y. Zhou, and C. Zhai, “Have Things Changed Now?-An empirical study of bug characteristics in modern open source software”, Proceedings of the 1st Workshop on Architectural
and System Support for Improving Software Dependability, pp. 25-33,
San Jose, USA, 2006.
[19] C. Bird, A. Gourley, P. Devanbu, M. Gertz, and A. Swaminathan, “Mining email social networks”, Proceedings of the 2006 International
Working Conference on Mining Software Repositories, pp. 137-143,
Shanghai, China, 2006.
[20] http://mail-archives.apache.org/mod mbox/
[21] F. A. Haight, Handbook of the Poisson Distribution. New York: Wiley, 1967.
[22] A. L. Barab´asi, “The origin of bursts and heavy tails in human dynam-ics”, Nature, vol. 435, pp. 207-211, 2005.
[23] R. D. Malmgren, D. B. Stouffer, A. E. Motter, and L. A. N. Amaral, “A Poissonian explanation for heavy tails in e-mail communication”,
Proceedings of the National Academy of Sciences U. S. A, vol. 105, no.
47, pp. 18153-18158, 2008.
[24] Y. Wu, C. Zhou, J. Xiao, J. Kurths, and H. J. Schellnhuber, “Evidence for a bimodal distribution in human communication”, Proceedings of
the National Academy of Sciences U. S. A, vol. 107, no. 44, pp.
10−2 100 102 104 0 0.1 0.2 0.3 0.4 0.5 0.6 0.7 0.8 0.9 1
T (h)
P(
∆
t<T)
kin≤50 kin>50(a)
10 −2 100 102 104 0 0.1 0.2 0.3 0.4 0.5 0.6 0.7 0.8 0.9 1T (h)
P(
∆
t<T)
kout≤50 kout>50(b)
Fig. 5. The cumulative inter-activity time distributions of the committing activities for different groups of developers characterized by their (a) incoming degrees and (b) outgoing degrees. As one can see, here the difference of cumulative inter-activity time distribution between two distinct groups of developers is mainly introduced when∆t >1(h).
1 2 0 2 4 6 8 10
Ln(
∆
t)
kin≤50 kin>50(a)
1 2 0 2 4 6 8 10Ln(
∆
t)
kout>50 kout≤50(b)
Fig. 6. The corresponding box-and-whisker diagrams of the inter-activity time for different groups of developers characterized by their (a) incoming degrees and (b) outgoing degrees. Here, only the inter-activity time with length longer than one hour is considered, and the y-axes are logarithmically transformed in order to present the difference of the committing activities between different groups of developers more clearly.
1 2 0 0.5 1 1.5 2 2.5 3 x 10⁴
τ
E(h)
(a)
1 2 −8 −6 −4 −2 0 2 4 6 8 10Ln(
τ
E)
(b)
1 2 0 0.5 1 1.5 2 2.5 x 10⁴τ
R(h)
Real(c)
Simulated 1 2 −8 −6 −4 −2 0 2 4 6 8 10Ln(
τ
R)
Real(d)
SimulatedFig. 7. The box-and-whisker diagrams for real and simulated (a)-(b) evaluation latencies and (c)-(d) response latencies. Here, for (b) and (d), the y-axes are logarithmically transformed in order to present the differences of latencies between real and simulated cases more clearly.