HAL Id: hal-02349160
https://hal.archives-ouvertes.fr/hal-02349160
Submitted on 5 Nov 2019
HAL
is a multi-disciplinary open access
archive for the deposit and dissemination of
sci-entific research documents, whether they are
pub-lished or not. The documents may come from
teaching and research institutions in France or
abroad, or from public or private research centers.
L’archive ouverte pluridisciplinaire
HAL
, est
destinée au dépôt et à la diffusion de documents
scientifiques de niveau recherche, publiés ou non,
émanant des établissements d’enseignement et de
recherche français ou étrangers, des laboratoires
publics ou privés.
Linear Support Vector Regression with Linear
Constraints
Quentin Klopfenstein, Samuel Vaiter
To cite this version:
Quentin Klopfenstein, Samuel Vaiter. Linear Support Vector Regression with Linear Constraints.
2019. �hal-02349160�
CONSTRAINTS
QUENTIN KLOPFENSTEIN† AND SAMUEL VAITER‡
Abstract. This paper studies the addition of linear constraints to the Support Vector Regression (SVR) when the kernel is linear. Adding those constraints into the problem allows to add prior knowl-edge on the estimator obtained, such as finding probability vector or monotone data. We propose a generalization of the Sequential Minimal Optimization (SMO) algorithm for solving the optimiza-tion problem with linear constraints and prove its convergence. Then, practical performances of this estimator are shown on simulated and real datasets with different settings: non negative regression, regression onto the simplex for biomedical data and isotonic regression for weather forecast.
Key words. Support Vector Machine, Support Vector Regression, Sequential Minimal Opti-mization
AMS subject classifications. 90C25, 49J52
1. Introduction. The Support Vector Machine (SVM) [3] is a class of supervised learning algorithms that have been widely used in the past 20 years for classification tasks and regression. These algorithms rely on two main ideas: the first one is the maximum margin hyperplane which consists in finding the hyperplane that maximises the distance between the vectors that are to be classified and the hyperplane. The second idea is the kernel method that allows the SVM to be used to solve non-linear problems. The technic is to map the vectors in a higher dimensional space which is done by using a positive definite kernel, then a maximum margin hyperplane is computed in this space which gives a linear classifier in the high dimensional space. In general, it leads to a non-linear classifier in the original input space.
From SVM to Support Vector Regression. Different implementations of the
algo-rithms haven been proposed such as C-SVM, ν-SVM [34], Least-Squares SVM [37], Linear Programming SVM [12] among others. Each of these versions have their strenghs and weaknesses depending on which application they are used. They dif-fer in terms of constraints considered for the hyperplane (C-SVM and Least-Squares SVM), in terms of norm considered on the parameters (C-SVM and Linear Program-ming SVM) and in terms of optimization problem formulation (C-SVM andν-SVM). Overall, these algorithms are a great tool for classification tasks and they have been used in many different applications like facial recognition [18], image classification [7], cancer type classification [15], text categorization [19] to only cite a few examples. Even though, SVM was first developped for classification, an adaptation for regression estimation was proposed in [11] under the name Support Vector Regression (SVR). In this case, the idea of maximum margin hyperplane is slightly changed into finding a tube around the regressors. The size of the tube is controlled by a hyperparame-ter chosen by the user: . This is equivalent to using an-insensitive loss function,
|y−f(x)|= max{0,|y−f(x)| −}which only penalizes the error above the chosen
level. As for the classification version of the algorithm, aν-SVR method exists. In this ∗Submitted.
Funding: This work was partly supported by ANR GraVa ANR-18-CE40-0005, Projet ANER RAGA G048CVCRB-2018ZZ and INSERM Plan cancer 18CP134-00.
†Institut Mathématique de Bourgogne, Université de Bourgogne, Dijon, France
‡CNRS & Institut Mathématique de Bourgogne, Université de Bourgogne, Dijon, France
version, the hyperparameteris computed automatically but a new hyperparameterν has to be chosen by the user which controls asymptotically the proportions of support vectors [34]. SVR has proven to be a great tool in the field of function estimation for many different applications: predicting times series in stock trades [40], travel-time prediction [8] and for estimating the amount of cells present inside a tumor [29].
Incorporating priors. In this last example of application, the authors used SVR to
estimate a vector of proportions, however the classical SVR estimator does not take into account the information known about the space in which the estimator lives. Adding this prior information on the estimator may lead to better estimation perfor-mance. Incorporating information in the estimation process is a wide field of studies in statistical learning (we refer to Figure 2 in [22] for a quick overview in the context of SVM). A growing interest in prior knowledge incorporated as regularization terms has emerged in the last decades. Lasso [38], Ridge [16], elastic-net [42] regression are examples of regularized problem where a prior information is used to fix an ill-posed problem or an overdetermined problem. The`1regularization of the Lasso will force the estimator to be sparse and bring statistical guarantees of the Lasso estimator in high dimensional settings. Another commun way to add prior knowledge on the estimator is to add constraints known a-priori on this estimator. The most commun examples are the ones that constrain the estimator to live in a subspace such as Non Negative Least Squares Regression (NNLS) [23], isotonic regression [2]. These exam-ples belong to a more general type of constraints: linear constraints. Other types of constraints exist like constraints on the derivative of the function that is to be estimated, smoothness of the function for example. Adding those constraints on the Least Squares estimator has been widely studied [2,24,4] and similar work has been done for the Lasso estimator in [13]. Concerning the SVR, inequality and equality constraints added as prior knowledge were studied in [22]. In this paper, the authors described a method for adding linear constraints on the Linear Programming SVR [12]. This implementation of the algorithm considers the `1 norm of the parameters in the optimization problem instead of the classical `2 norm which leads to a lin-ear programming optimization problem to solve instead of a quadratic programming problem. They also described a method for using information about the derivative of the function that is estimated.
Sequential Minimal Optimization. One of the main challenges of adding these
constraints is that it often increases the difficulty of solving the optimization problem related to the estimator. For example, the Least Squares optimization problem has a closed form solution whereas the NNLS uses sophisticated algorithms [4] to approach the solution. SVM and SVR algorithms were extensively studied and used in practise because very efficient algorithms were developped to solve the underlying optimization problems. One of them is called Sequential Minimal Optimization (SMO) [32] and is based on a well known optimization technic called coordinate descent. The idea of the coordinate descent is to break the optimization problem into sub-problems selecting one coordinate at each step and minimizing the function only via this chosen coordinate. The developpement of parallel algorithms have increased the interest in these coordinate descent methods which show to be very efficient for large scale problems. One of the key settings for the coordinate descent is the choice of the coordinate at each step, the choice’s strategy will affect the efficiency of the algorithm. There exists three families of strategies for coordinate descent: cyclic [39], random [28] and greedy. The SMO algorithm is a variant of a greedy coordinate descent [41] and is the algorithm implemented in LibSVM [6]. It is very efficient to solve SVM/SVR optimization problems. In the context of linear kernel, other algorithm are used such
as dual coordinate descent [17] or trust region newton methods [25].
Priors and SMO. In one of the application of SVR cited above, information
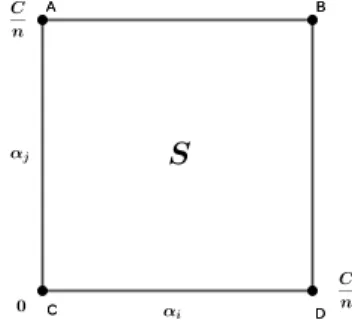
a-priori about the estimator is not used in the estimation process and is only used in a post-processing step. This application comes from the cancer research field, where regression algorithms have been used to estimate the proportions of cell populations that are present inside a tumor (see [27] for a survey). Several estimators have been proposed in the biostatistics litterature, most of them based on constrained least squares [1,33,14] but the gold standard is the estimator based on the Support Vector Regression [29]. Our work is motivated by incorporating the fact that the estimator for this application belongs to the simplex: S ={x∈Rn : Pni=1xi = 1, xi ≥0} in
the SVR problem. We believe that for this application, it will lead to better estimation performance. From an optimization point of view, our motivation is to find an efficient algorithm that is able to solve the SVR optimization problem where generic linear constraints is added to the problem as prior knowledge, including simplex prior as described. This work follows the one from [22] except that in our case, we keep the `2 norm on the parameters in the optimization problem which is the most commun version of the SVR optimization problem and we only focus on inequality and equality constraints as prior knowledge.
Contributions. In this paper, we study a linear SVR with linear constraints
opti-mization problem. We show that the dual of this new problem shares similar proper-ties with the classicalν-SVR optimization problem (Proposition 2.2). We also prove that adding linear constraints to the SVR optimization problem does not change the nature of its dual problem, in the fact that the problem stays a semi-definite positive quadratic function subject to linear constraints. We propose a generalized SMO algo-rithm that allows the resolution of the new optimization problem. We show that the updates in the SMO algorithm keep a closed form (Definition 3.5) and prove the con-vergence of the algorithm to a solution of the problem (Theorem 3.7). We illustrate on synthetic and real datasets the usefulness of our new regression estimator under different regression settings: non-negative regression, simplex regression and isotonic regression.
Outline. The article proceeds as follows: we introduce the optimization problem
coming from the classical SVR and describe the modifications brought by adding linear constraints in section 2. We then present the SMO algorithm, its generalization for solving constrained SVR and present our result on the convergence of the algorithm in section 3. In section 4, we use synthetic and real datasets on different regression settings to illustrate the practical performance of the new estimator.
Notations. We write||.||(resp.h., .i) for the euclidean norm (resp. inner product)
on vectors. We use the notationX:i (resp. Xi:) to denote the vector corresponding the theithcolumn of the matrixX (resp. ithrow of the matrixX). Throughout this paper, the design matrix will be X ∈Rn×p and y ∈Rn will be the response vector. XT will be used for the transposed matrix ofX. The vectoredenote the vector with
only ones on each of its coordinates and ej denotes the canonical vector with a one
at thejth coordinate. ∇
xif is the partial derivative ∂f ∂xi.
2. Constrained Support Vector Regression. First we introduce the opti-mzation problem related to adding linear constraints to the SVR and discuss some interesting properties about this problem.
2.1. Previous work : ν-Support Vector Regression. Theν-SVR estimator [34] is obtained solving the following quadratic optimization problem:
(SVR-P) min β,β0,ξi,ξ∗i, 1 2||β|| 2+C(ν+1 n n X i=1 (ξi+ξ∗i)) subject to yi−βTXi:−β0≤+ξi βTXi:+β0−yi≤+ξi∗ ξi, ξ∗i ≥0, ≥0.
By solving problem (SVR-P), we seek a linear functionf(x) =βTx+β
0 where β∈Rpandβ
0∈R, that is at mostdeviating from the response vector coefficientyi.
This function does not always exist which is why slack variablesξ∈Rn andξ∗∈
Rn are introduced in the optimization problem to allow some observations to break the condition given before. C andν are two hyperparameters. C∈Rcontrols the toler-ated error andν ∈[0,1]controls the number of observations that will lay inside the tube of size 2 given by the two first constraints in (SVR-P). It can be seen as an -insensitive loss function where a linear penalization is put on the observations that lay outside the tube and the observations that lay inside the tube are not penalized (see [36] for more details).
The different algorithms proposed to solve (SVR-P) often use its dual problem like in [32, 17]. The dual problem is also a quadratic optimization problem with linear constraints but its structure allows an efficient resolution as we will see in more details insection 3. The dual problem of (SVR-P)is the following optimization problem:
(SVR-D) min α,α∗ 1 2(α−α ∗)TQ(α−α∗) +yT(α−α∗) subject to 0≤αi, α∗i ≤ C n eT(α+α∗)≤Cν eT(α−α∗) = 0, whereQ=XXT ∈ R2n×2n.
The equation link between (SVR-P) and(SVR-D)is given by the following for-mula: β =− n X i=1 (αi−αi∗)Xi:.
2.2. The constrained optimization problem. We propose a constrained ver-sion of problem (SVR-P) that allows the addition of prior knowledge on the linear functionf that we seek to estimate. The constrained estimator is obtained solving the optimization problem:
(LSVR-P) min β,β0,ξi,ξ∗i, 1 2||β|| 2+C(ν+ 1 n n X i=1 (ξi+ξi∗)) subject to βTXi:+β0−yi ≤+ξi yi−βTXi:−β0≤+ξ∗i ξi, ξi∗≥0, ≥0 Aβ≤b Γβ=d, whereA∈Rk1×p,Γ∈ Rk2×p,β∈ Rp,ξ,ξ∗∈Rn andβ0,,∈R.
The algorithm that we propose in section 3 also uses the structure of the dual problem of (LSVR-P). The next proposition introduces the dual problem and some of its properties.
Proposition 2.1. If the set{β∈Rn, Aβ ≤b,Γβ =d} is not empty then,
1. Strong duality holds for (LSVR-P).
2. The dual problem of (LSVR-P)is
(LSVR-D) min α,α∗,γ,µ 1 2 (α−α∗)TQ(α−α∗) +γTAATγ+µTΓΓTµ +2 n X i=1 (αi−α∗i)γ TAX i:−2 n X i=1 (αi−α∗i)µ TΓX i:−2γTAΓTµ +yT(α−α∗) +γTb−µTd subject to 0≤α(i∗)≤C n eT(α+α∗)≤Cν eT(α−α∗) = 0 γj≥0.
3. The equation link between primal and dual is
β=−
n
X
i=1
(αi−α∗i)Xi:−ATγ+ ΓTµ.
The proof of the first statement of the proposition is given in the discussion below whereas the proofs for the two other statements are given in the Appendix A. We have thatα,α∗∈Rn,γ∈Rk1 is the vector of Lagrange multipliers associated the
the inequality constraintAβ ≤b which explains the non-negative constraints on its coefficients. µ∈Rk2 are the Lagrange multipliers associated to the equality constraint
Γβ =dwhich also explains that there is no constraints in the dual problem onµ. The objective functionf which we will write in the stacked form as:
f(θ) =θTQθ¯ +lTθ, where θ= α α∗ γ µ , l= y −y b −d ∈R2n+k1+k2, Q¯= Q −Q XAT −XΓT −Q Q −XAT XΓT AXT −AXT AAT −AΓT −ΓXT ΓXT −ΓAT ΓΓT
is a square matrix of size2n+k1+k2.
An important observation is that this objective function is always convex. The
matrix Q¯ is the product of the matrix
X −X A −Γ
and its transpose matrix. It means
that Q¯ is a Gramian matrix and it is positive semi-definite which implies that f is convex. The problem (LSVR-D) is then a quadratic programming optimization problem which meets Slater’s condition if there exists aθthat belongs to the feasible domain which we will denote byF. If there is such aθwe have strong duality holding between problem(LSVR-P)and (LSVR-D). The only condition we need to have on Aand Γis that they define a non-empty polyhedron in order to be able to solve the optimization problem.
Our second observation on problem (LSVR-D)is that the inequality constraints eT(α+α∗)≤Cν is replaced by an equality constraints in the same way that it was
suggested in [5] for the classical problem (SVR-D).
Proposition 2.2. If >0, all optimal solutions of (LSVR-D) satisfy
1. αiα∗i = 0,∀i
2. eT(α+α∗) =Cν
The proof is given inAppendix B. This observation will be important for the algorithm that we propose insection 3.
3. Generalized Sequential Minimal Optimization. In this section we pro-pose a generalization of the SMO algorithm [32] to solve problem (LSVR-D) and present our main result on the convergence of the proposed algorithm to the solu-tion of (LSVR-D). The SMO algorithm is a variant of greedy coordinate descent [41] taking into consideration non-separable constraints, which in our case are the two equality constraints. We start by describing the previous algorithm that solve
(SVR-D).
3.1. Previous work : Sequential Minimal Optimization. In this subsec-tion, we definef(α, α∗) =1
2(α−α
∗)TQ(α−α∗) +yT(α−α∗)and we note∇f ∈
R2n its gradient. From [20], we rewrite the Karush-Kuhn-Tucker (KKT) conditions in the following way:
(3.1) min
i∈Iup∇αif ≥jmax∈Ilow∇αjf
where
Iup(α) ={i∈ {1, . . . , l}:αi<
C l } Ilow(α) ={i∈ {1, . . . , l}:αi >0}.
The same condition is written for the α∗ variables replacing αi by α∗i above.
These conditions leads to an important definition for the rest of this paper.
Definition 3.1. We will say that (i, j) is a violating pair of variables if one of these two conditions is satisfied:
i∈Iup(α), j∈Ilow(α)and∇αif <∇αjf
Because the algorithm SMO does not provide in general an exact solution in a finite number of steps there is a need to relax the optimality conditions which gives a new definition.
Definition 3.2. We will say that(i, j)is aτ-violating pair of variables if one of
these two conditions is satisfied:
i∈Iup(α), j∈Ilow(α)and∇αif <∇αjf−τ
i∈Ilow(α), j∈Iup(α) and∇αif >∇αjf+τ.
The SMO algorithm will then choose at each iteration a pair of violating variables in theαblock or in the α∗ block. Once the choice is done, a subproblem of size two is solved, considering that only the two selected variables are to be minimized in problem(SVR-D). The outline of the algorithm is presented inAlgorithm 3.1.
The choice of the violating pair of variables presented in [21] was to always work with the most violating pairs of variables, which means the variables that leads to the largest gap compared to the optimality conditions given in(3.1). This choice is what makes a link with greedy coordinate descent, however greedy here is related to the largest gap with the optimality score and is not related to the largest decrease in the objective function.
The resolution of the subproblem of size two has a closed form. The idea is to use the two equality constraints to go from a problem of size two to a problem of size one. Then, the goal is to minimize a quadratic function of one variable under box constraints which is done easily. We will give more details of the resolution of these subproblems insubsection 3.3for our proposed algorithm.
The proof of convergence of SMO algorithm was given in [20] without conver-gence rate. The proof relies on showing that the sequence defined by the algorithm f(αk,(α∗)k) is a decreasing sequence and that there cannot be the same violating pair of variables infinitely many times. The linear convergence rate was proved later by Schmidt and She [35] as well as the identification of the support vectors in finite time.
3.2. Optimality conditions for the constrained SVR. In this subsection we define f as the objective function of problem(LSVR-D)and ∇f ∈R2n+k1+k2 its
gradient. The Lagrangian of optimization problem(LSVR-D)is defined by :
L=f− n X i=1 (λiαi+λ∗iα∗i) + n X i=1 βi(αi− C n) +β ∗ i(α∗i − C n) −σ( n X i=1 (αi+α∗i)−Cν)−δ n X i=1 (αi−α∗i)− k1 X j=1 ηjγj.
Algorithm 3.1 SMO algorithm Require: τ>0 Initializingα0∈ Rn,(α∗)0∈Rn inF and set k= 0 while∆> τ do i←argmin i∈Iup ∇αif j←argmax i∈Ilow ∇αjf i∗ ←argmin i∈I∗ up ∇α∗ if j ∗←argmax i∈I∗ low ∇α∗ jf ∆1← ∇αjf − ∇αif ∆2← ∇α∗ jf− ∇α∗if
∆←max(∆1,∆2) .Select the maximal violating pair
if ∆ = ∆1then
αk+1←Solution of subproblem for variablesα
i andαj
else
(α∗)k+1 ←Solution of subproblem for variables αi∗ andαj∗
k←k+ 1 returnαk,(α∗)k The αblock ∇αiL=∇αif−λi+βi−σ−δ= 0 λiαi= 0 βi(αi− C n) = 0 λi≥0 βi≥0
We will consider different possiblities of value forαi.
Case 1-αi= 0 thenβi= 0andλi≥0
∇αif−σ−δ≥0
Case 2-αi= Cn thenλi= 0andβi≥0
∇αif−σ−δ≤0
Case 3-0< αi<Cn thenβi= 0,θi = 0
∇αif−σ−δ= 0
We then consider the set of indices :
Iup(α) ={i∈ {1, . . . , n}:αi <
C n}
Ilow(α) ={i∈ {1, . . . , n}:αi>0}
The optimality conditions are satisfied if and only if
min
i∈Iup∇αif ≥jmax∈Ilow
∇αjf.
The α∗ block In this block, the conditions are very similar to the ones given for the blockα, the only difference here is that we will have two new sets of indices:
Iup∗ (α∗) ={i∈ {1, . . . , n}:α∗i <
C n} and
Ilow∗ (α) ={i∈ {1, . . . , n}:α∗i >0}
which gives the following optimality condition:
min i∈I∗ up ∇α∗ if ≥jmax∈I∗ low ∇α∗ jf. The γ block ∇γjL=∇γjf−ηj = 0ηjγj = 0ηj ≥0
We will consider different possiblities of value forγj.
Case 1-γj = 0then
∇γjf ≥0
Case 2-γj >0
∇γjf = 0
Definition 3.3. We will say thatj is aτ-violating variable for the blockγ if ∇γjf+τ <0.
The µ block
∇µjL=∇µjf = 0
Definition 3.4. We will say thatj is aτ-violating variable for the blockµ if |∇µjf|> τ.
From these conditions on each block, we build an optimization strategy that follows the idea of the SMO described insubsection 3.1. For each block of variables, we
Algorithm 3.2 Generalized SMO algorithm Require: τ >0 Initializingα0∈ Rn,(α∗)0∈Rn,γ0∈Rk1 andµ0∈ Rk2 inF and set k= 0 while∆> τ do i←argmin i∈Iup ∇αif j←argmax i∈Ilow ∇αjf i∗ ←argmin i∈I∗ up ∇α∗ if j ∗←argmax i∈I∗ low ∇α∗ jf ∆1← ∇αjf − ∇αif ∆2← ∇α∗jf− ∇α∗if ∆3← − min j∈{1,...,k1} ∇γjf ∆4← max j∈{1,...,k2} |∇µjf|
∆←max(∆1,∆2,∆3,∆4) . Select the maximal violating variables
if ∆ = ∆1then
αk+1←Solution of subproblem for variablesα
i andαj
else if ∆ = ∆2 then
(α∗)k+1 ←Solution of subproblem for variables αi∗ andαj∗
else if ∆ = ∆3 then u= argmin
i∈{1,...,k1}
∇γif
γk+1←Solution of subproblem for variableγ
u
else
u= argmax
i∈{1,...,k2}
∇µif
µk+1←Solution of subproblem for variableµ
u
k←k+ 1
returnαk,(α∗)k,γk,µk
compute what we call aviolating optimality score based on the optimality conditions given above. Once the scores are computed for each block, we select the block which has the largest score and solve an optimization subproblem in the block selected. If the blockαor the blockα∗ is selected, we will update a pair of variables by solving a minization problem of size two. However if the blockγor the blockµis selected, we will update only one variable at a time. This is justified by the fact that the variables αandα∗ have non-separable equality constraints linking them together. The rest of this section will be dedicated to the presentation of our algorithm and to giving some interesting properties such as a closed form for updates on each of the blocks and a convergence theorem.
3.3. Updates rules and convergence. The first definition describes the closed form updates for the different blocks of variables.
Definition 3.5. The update between iteratekand iteratek+ 1of the generalized
SMO algorithm has the following form:
the update will be as follows: αki+1=αki +t∗ αjk+1=αjk−t∗, where t∗ = min(max(I1,− (∇αif−∇αjf) (Qii−2Qij+Qjj)), I2) with I1 = max(−α k i, αkj − C n) andI2= min(αjk,Cn −α k i).
2. if the block α∗ is selected and (i∗, j∗) is the most violating pair of variable
then the update will be as follows:
(α∗i)k+1= (αi∗)k+t∗ (α∗j)k+1= (α∗j)k−t∗, wheret∗= min(max(I1,− (∇α∗if−∇α∗jf) (Qii−2Qij+Qjj)), I2)withI1= max(−(α ∗ i) k,(α∗ j) k− C n)andI2= min((α∗j)k, C n −(α ∗ i))k.
3. if the block γ is selected and i is the index of the most violating variable in
this block then the update will be as follows:
γik+1= max(− ∇γif
(AAT) ii
+γik,0).
4. if the block µ is selected and i is the index of the most violating variable in
this block then the update will be as follows:
µki+1=− ∇µif
(ΓΓT) ii
+µki.
This choice of updates comes from solving the optimization problem (LSVR-D)
considering that only one or two variables are updated at each step. One of the key elements of the algorithm is to make sure that at each step the iterate belongs toF. Let’s suppose that the blockαis selected as the block in which the update will happen and let(i, j)be the most violating pair of variables. The update is the resolution of a subproblem of size 2, considering that only αi and αj are the variables, the rest
remains constant. The two equality constraints in(LSVR-D),Pn
i=1αi−α
∗
i = 0and
Pn
i=1αi+α∗i =Cν, lead to the two following equalities: α k+1 i +α k+1 j =α k i +α k j. The
later yields to using a parametert for the update of the variables leading to: αki+1=αki +t,
αkj+1=αkj −t.
Updating the variable in the blockαthis way will force the iterates ofAlgorithm 3.1
to meet the two equalities constraints at each step. We findt by solving (LSVR-D)
considering that we minimize only over t. Let u∈ R2n+p+k1+k2 be the vector that
contains only zeros except at the ith coordinate where it is equal to t and at jth coordinate where it is equal to−t. Therefore, we find t by minimizing the following optimization problem: min t∈R ψ(t) =1 2 (θk+u)TQ¯(θk+u) +lT(θk+u) subject to 0≤αki+1, αkj+1≤ C n.
First we minimize the objective function without the constraints and since it is a quadratic function of one variable we just clip the solution of unconstrained problem to have the solution of the constrained problem. We will use the term "clipped update" or "clipping" when the update is projected unto the constraints space and is not the result of the unconstrainted optimization problem. As we only consider size one problem for the updates, it will mean that the update will be a bound of an interval. We will use the notation K as a term containing the terms that do not depend ont. We write that ψ(t) =1 2u TQu¯ +uTQθ¯ k+lTu+K =1 2t 2( ¯Q ii+ ¯Qjj−2 ¯Qij) +uT∇f(θk) +K =1 2t 2( ¯Q ii+ ¯Qjj−2 ¯Qij) +t(∇αif(θ k)− ∇ αjf(θ k)) +K.
It follows that the unconstrained minimum ofψ(t)istq=
−(∇αif(θk)−∇ αjf(θk))
( ¯Qii+ ¯Qjj−2 ¯Qij) .
Tak-ing the constraints into account we have that:
0≤αki +t≤ C
n,
0≤αkj −t≤ C
n, it yields tot∗= min(max(I
1, tq), I2)withI1= max(−αi, αj−Cn)andI2= min(αj,Cn−
αi). The definition of the updates for the blockα∗ relies on the same discussion.
Let’s now make an observation that will explain the definition of the updates for the blocks γand µ. Leti be the index of the variable that will be updated. Solving the problem: θik+1= argmin θi 1 2θ TQθ¯ +lTθ,
leads to the following solutionθki+1= −∇if(θk)
¯
Qii +θ
k i.
Let’s recall that the update for the blockγhas to keep the coefficient ofγpositive to stay in F hence we have to perform the following clipped update withi∈ {2n+
p+ 1, . . . ,2n+p+k1}: θik+1= max(−∇γif(θ k) ¯ Qii +θki,0).
Then noticing thatQ¯ii =AATii for this block, we obtain the update for the blockγ.
There are no constraints on the variables in the blokµ, so the update comes from the fact thatQ¯ii= ΓΓTiifori∈ {2n+p+k1+1, . . . ,2n+p+k1+k2}which corresponds to the indices of the blockµ.
From these updates we have to make sure that Qii +Qjj −2Qij 6= 0, let us
recall thatQij=hXi:, Xj:iwhich means thatQii+Qjj−2Qij =||Xi:−Xj:||2. This quantity is zero only when Xi: =Xj: coordinate wise. It would mean that the same row appears two times in the design matrix which does not bring any new information for the regression and can be avoided easily. (AAT)
ifAi: = 0which means that a row of the matrix A is zero, so there is no constraint on any variable of the optimization problem which will never happen. It is the same discussion for(ΓΓT)
ii.
The next proposition makes sure that once a variable (resp. pair of variables) is updated, it cannot be a violating variable (resp. pair of variables) at the next step. This proposition makes sure, for the two blocksαandα∗, that the updatet∗ cannot be0.
Proposition 3.6. If (i, j) (resp.i) was the pair of most violating variable (resp.
the most violating variable) in the block α or α∗ (resp. block γ or µ) at iteration k
then at iteration k+ 1,(i, j)(resp. i) cannot be violating the optimality conditions.
The proof of this proposition is left in theAppendix C.
Finally, we show that the algorithm converges to a solution of (LSVR-D) and since strong duality holds it allows us to have a solution of (LSVR-P).
Theorem 3.7. For any given τ > 0 the sequence of iterates {θk}, defined by the generalized SMO algorithm, converges to an optimal solution of the optimization
problem (LSVR-D)
The proof of this theorem relies on the same idea as the one proposed in [26] for the classical SMO algorithm and is given in Appendix D. We show that it can be extended to our algorithm with some new observations. The general idea of the proof is to see that the distance between the primal vector generated by the SMO-algorithm and the optimal solution of the primal is controled by the following expres-sion 12||βk−βopt|| ≤f(θk)−f(θopt), whereβk is thekthprimal iterate obtained via
the relationship primal-dual andθk and whereβopt is a solution of (LSVR-P). From
this observation, we show that we can find a subsequence of the SMO-algorithmθkj
that converges to someθ¯, solution of the dual problem. Using the continuity of the objective function of the dual problem, we have thatf(θkj)→f(¯θ). Finally, we show
that the sequence{f(θk)} is decreasing and bounded which implies its convergence and from the convergence monotone theorem we know that to f(θk) converges to
f(¯θ) since one of its subsequence converges. This proves that||βk−βopt|| →0 and
finishes the proof. The convergence rate for the SMO algorithm is difficult to obtain considering the greedy choice of the blocks and the greedy choice inside the blocks. A proof for the classical SMO exists but with uniformly at random choice of the block [35]. Convergence rate for greedy algorithms in optimization can be found in [30] for example but the assumption that the constraints must be separable is a major issue for our case. The study of this convergence rate is out of scope of this paper.
4. Numerical experiments. The code for the different regression settings is available on a GitHub repository1, each setting is wrapped up in a package and is
fully compatible with scikit learn [31] BaseEstimatorclass.
In order to compare the estimators, we worked with the Mean Absolute Error (MAE) and the Root Mean Squared Error (RMSE) which are given by the following expressions: MAE = 1 p p X i=1 |β∗i −βˆi|, RMSE = r 1 p||β ∗−βˆ||2, 1https://github.com/Klopfe/LSVR
where β∗ are the ground truth coefficients and βˆ are the estimated coefficients. We also used the Signal-To-Noise Ratio (SNR) to control the level noise simulated in the data. We used the following definition:
SNR = 10 log 10(E(Xβ(Xβ)
T)
Var() ).
4.1. Non Negative regression. First, the constraints are set to force the co-efficient ofβ to be positive and we compare our constrained-SVR estimator with the NNLS [23] estimator which is the result of the following optimization problem:
(NNLS) minβ
1
2||y−Xβ||
subject to βi≥0.
In this special case of non-negative regression, A = −Ip, b = 0, C = 0, d = 0,
the constrained-SVR optimization problem which we will call Non-Negative SVR (NNSVR) then becomes: (NNSVR) min β,β0,ξi,ξ∗i, 1 2||β|| 2+C(ν+1 n n X i=1 (ξi+ξ∗i)) subject to βTXi:+β0−yi≤+ξi yi−βTXi:−β0≤+ξi∗ ξi, ξ∗i ≥0, ≥0 βi≥0.
Synthetic data. We generated the design matrixX from a gaussian distribution
N(0,1) with 500 samples and 50 features. The true coefficients to be foundβ∗ were gererated taking the exponential of a gaussian distribution N(0,2) in order to have positive coefficients. Y was simply computed as the product betweenX and β∗. We wanted to test the robustness of our estimator compared to NNLS and variant of SVR estimators. To do so, we simulated noise in the data using different types of distributions, we tested gaussian noise and laplacian noise under different levels of noise. For this experiment, the noise distributions were generated to have a SNR equals to 10 and 20, for each type of noise we performed 50 repetitions. The noise was only added in the matrixY the design matrixX was left noiseless. We compared different estimators NNLS, NNSVR, the Projected-SVR (P-SVR) which is simply the projection of the classical SVR estimator unto the positive orthant and also the classical SVR estimator without constraints. The results of this experiment are in
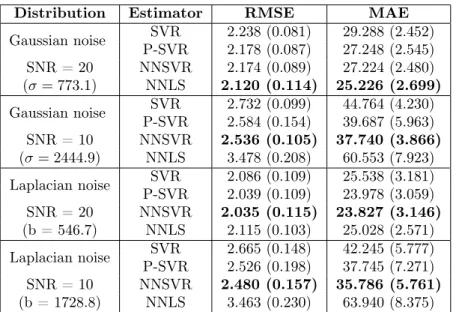
Table 4.1. We see that for a low gaussian noise level (SNR = 20) the NNLS has a lower RMSE and lower MAE. However, we see that the differences between the four compared methods are small. When the level of noise increases (SNR = 10), the NNSVR estimator is the one with the lowest RMSE and MAE. The NNLS estimator performs poorly in the presence of high level of noise in comparison to the SVR based estimator. When a laplacian noise is added to the data, the NNSVR is the estimator that has the lowest RMSE and MAE for low level of noise SNR = 20and high level of noiseSNR = 10.
4.2. Regression unto the simplex. In this subsection, we study the perfor-mance of our proposed estimator on simplex constraints Simplex Support Vector Re-gression (SSVR). In this case, A=−Ip, b= 0, Γ =e andd= 1. The optimization
Table 4.1: Results for the Support Vector Regression (SVR), Projected Support Regression (P-SVR), Negative Support Vector Regression (NNSVR) and Non-Negative Least Squares (NNLS) for simulated data withn = 500and p= 50. The mean (standard deviation) of the Root Mean Squared Error (RMSE) and the Mean Absolute Error (MAE) over 50 repetitions are reported. Different noise distribution (gaussian and laplacian) and different Signal to Noise Ratio (SNR) values were tested.
Distribution Estimator RMSE MAE
Gaussian noise SVR 2.238 (0.081) 29.288 (2.452) P-SVR 2.178 (0.087) 27.248 (2.545) SNR = 20 NNSVR 2.174 (0.089) 27.224 (2.480) (σ= 773.1) NNLS 2.120 (0.114) 25.226 (2.699) Gaussian noise SVR 2.732 (0.099) 44.764 (4.230) P-SVR 2.584 (0.154) 39.687 (5.963) SNR = 10 NNSVR 2.536 (0.105) 37.740 (3.866) (σ= 2444.9) NNLS 3.478 (0.208) 60.553 (7.923) Laplacian noise SVR 2.086 (0.109) 25.538 (3.181) P-SVR 2.039 (0.109) 23.978 (3.059) SNR = 20 NNSVR 2.035 (0.115) 23.827 (3.146) (b = 546.7) NNLS 2.115 (0.103) 25.028 (2.571) Laplacian noise SVR 2.665 (0.148) 42.245 (5.777) P-SVR 2.526 (0.198) 37.745 (7.271) SNR = 10 NNSVR 2.480 (0.157) 35.786 (5.761) (b = 1728.8) NNLS 3.463 (0.230) 63.940 (8.375) (SSVR) min β,β0,ξi,ξ∗i, 1 2||β|| 2+C(ν+1 n n X i=1 (ξi+ξ∗i)) subject to βTXi:+β0−yi≤+ξi yi−βTXi:−β0≤+ξi∗ ξi, ξ∗i ≥0, ≥0 βi ≥0 X i βi= 1.
Synthetic data. We first tested on simulated data generated by the function
make_regressionof scikit-learn. Once the design matrixX and the response vector
y were generated using this function, we had access to the ground truth that we will writeβ∗. This function was not designed to generate data with aβ∗ that belongs to
the simplex so we first projected β∗ unto the simplex and then recomputed y mul-tiplying the design matrix by the new projected βS∗. We added a centered gaussian noise in the data with the standard deviation of the gaussian was chosen such as the signal-to-noise ratio (SNR) was equal to a defined number, we used the following formula for a given SNR:
σ= r
Var(y) 10SN R/10,
whereσis the standard deviation used to simulate the noise in the data. The choice of the two hyperparametersC andν was done using 5-folds cross validation on a grid of possible pairs. The values ofC were taken evenly spaced in thelog10base between
[−3,3], we considered 10 different values. The values ofν were taken evenly spaced in the linear space between [0.05,1.0]and we also considered 10 possible values. We tested different size for the matrix X ∈ Rn×p to check the potential effects of the dimensions on the quality of the estimation and we did 50 repetitions for each point of the curves. The measure that was used to compare the different estimators is the RMSE between the trueβ and the estimatedβˆ.
We compared the RMSE of our estimator to the Simplex Ordinary Least Squares (SOLS) which is the result of the following optimization problem:
(SOLS) min β 1 2||y−Xβ|| subject to βi≥0, p X i=1 βi= 1,
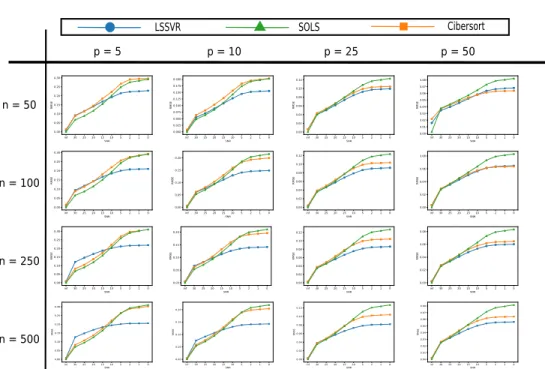
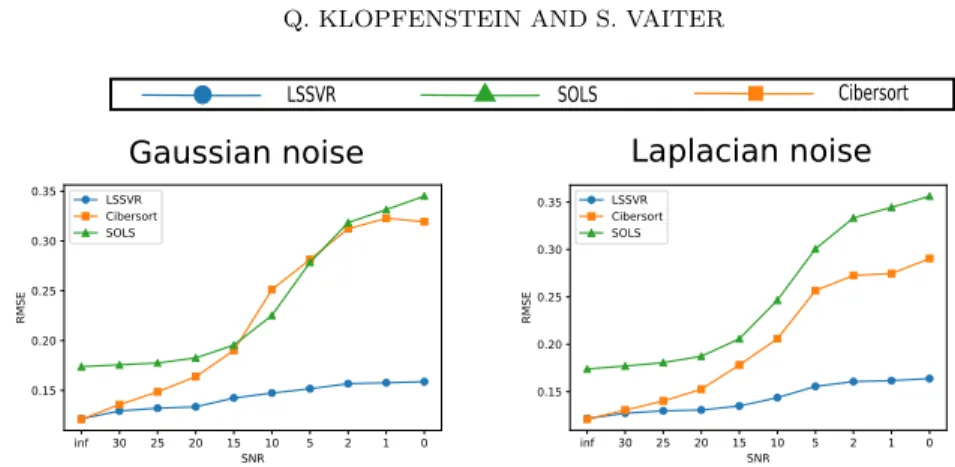
and to the estimator proposed in the biostatics litterature that is called Cibersort. This estimator is simply the result of using the classical SVR and project the obtained estimator unto the simplex. The RMSE curves as a function of the SNR are presented insubsection 4.2. We observe that the SSVR is generally the estimator with the lowest RMSE, this observation becomes clearer as the level of noise increases in the data. We notice that when there is a low level of noise and when n is not too large in comparison to p, the three compared estimator perform equally. However, there is a setting whennis large in comparison top(in this experiment forn= 250or500and p= 5) where the SSVR estimator has a higher RMSE than the Cibersort and SOLS estimator untill a certain level of noise (SNR<15). Overall, this simulation shows that there is a significant improvement in the estimation performance of the SSVR mainly when there is noise in the data.
Real dataset. In the cancer research field, regression algorithms have been used
to estimate the proportions of cell populations that are present inside a tumor. In-deed, a tumor is composed of different types of cells such as cancer cells, immune cells, healthy cells among others. Having access to the information of the propor-tions of these cells could be a key to understanding the interacpropor-tions between the cells and the cancer treatment called immunotherapy [9]. The modelization done is that the RNA extracted from the tumor is seen as a mixed signal composed of different pure signals coming from the different types of cells. This signal can be unmixed knowing the different pure RNA signal of the different types of cells. In other words, y will be the RNA signal coming from a tumor and X will be the design matrix composed of the RNA signal from the isolated cells. The number of rows represent the number of genes that we have access to and the number of columns ofX is the number of cell populations that we would like to quantify. The hypothesis is that there is a linear relationship between X and y. As said above, we want to estimate proportions which means that the estimator has to belong to the probability simplex
S ={x:xi≥0, Pixi= 1}.
Several estimators have been proposed in the biostatistics litterature most of them based on constrained least squares [33,14, 1] but the gold standard is the estimator based on the SVR.
inf 30 25 20 15 10 5 2 1 0 SNR 0.00 0.05 0.10 0.15 0.20 0.25 0.30 RMSE inf 30 25 20 15 10 5 2 1 0 SNR 0.00 0.02 0.04 0.06 0.08 RMSE inf 30 25 20 15 10 5 2 1 0 SNR 0.00 0.05 0.10 0.15 0.20 0.25 0.30 RMSE inf 30 25 20 15 10 5 2 1 0 SNR 0.00 0.01 0.02 0.03 0.04 0.05 0.06 0.07 0.08 RMSE inf 30 25 20 15 10 5 2 1 0 SNR 0.00 0.05 0.10 0.15 0.20 0.25 0.30 RMSE p = 5 p = 10 p = 25 p = 50 n = 50 n = 100 n = 250 n = 500 inf 30 25 20 15 10 5 2 1 0 SNR 0.000 0.025 0.050 0.075 0.100 0.125 0.150 0.175 0.200 RMSE inf 30 25 20 15 10 5 2 1 0 SNR 0.00 0.02 0.04 0.06 0.08 0.10 0.12 RMSE inf 30 25 20 15 10 5 2 1 0 SNR 0.00 0.01 0.02 0.03 0.04 0.05 0.06 0.07 0.08 RMSE inf 30 25 20 15 10 5 2 1 0 SNR 0.00 0.05 0.10 0.15 0.20 0.25 0.30 RMSE inf 30 25 20 15 10 5 2 1 0 SNR 0.00 0.05 0.10 0.15 0.20 RMSE inf 30 25 20 15 10 5 2 1 0 SNR 0.00 0.02 0.04 0.06 0.08 0.10 0.12 RMSE inf 30 25 20 15 10 5 2 1 0 SNR 0.00 0.02 0.04 0.06 0.08 RMSE inf 30 25 20 15 10 5 2 1 0 SNR 0.00 0.05 0.10 0.15 0.20 RMSE inf 30 25 20 15 10 5 2 1 0 SNR 0.00 0.02 0.04 0.06 0.08 0.10 0.12 RMSE inf 30 25 20 15 10 5 2 1 0 SNR 0.00 0.05 0.10 0.15 0.20 RMSE inf 30 25 20 15 10 5 2 1 0 SNR 0.00 0.02 0.04 0.06 0.08 0.10 0.12 RMSE LSSVR SOLS Cibersort
Fig. 4.1: The Root Mean Squared Error (RMSE) as a function of the Signal to Noise Ration (SNR) is presented. Different dimensions for the design matrix X and the response vectory were considered. nrepresents the number of rows ofX and pthe number of columns. For each plot, the blue line represents the RMSE for the Linear Simplex SVR (LSSVR) estimator, the green one the Simplex Ordinary Least Squares (SOLS) estimator and the orange on the Cibersort estimator. Each point of the curve is the mean RMSE of 50 repetitions. The noise in the data has a gaussian distribution.
We compared the three same estimators on a real biological dataset where the real quantities of cells to obtain were known. The dataset can be found on the GEO website under the accession code GSE111032. For this examplen= 584andp= 4and
we have access to 12 different samples that are our repetitions. Following the same idea than previous benchmark performed in this field of application, we increased the level of noise in the data and compared the RMSE of the different estimators. gaussian and laplacian distributions of noise were added to the data. The choice of the two hyperparametersCandν was done using 5-folds cross validation on a grid of possible pairs. The values ofC were taken evenly spaced in thelog10 base between[−5,−3], we considered 10 different values. The interval of C is different than the simulated data because of the difference in the range value of the dataset. The values ofν were taken evenly spaced in the linear space between[0.05,1.0]and we also considered 10 possible values.
We see that when there is no noise in the data (SNR = ∞) both Cibersort and SSVR estimator perform equally. The SOLS estimator already has a higher RMSE than the two others estimator probably due to the noise already present in the data.
2The dataset can be downloaded from theGene Expression Omnibuswebsite under the accession code GSE11103.
LSSVR SOLS Cibersort inf 30 25 20 15 10 5 2 1 0 SNR 0.15 0.20 0.25 0.30 0.35 RMSE LSSVR Cibersort SOLS Gaussian noise inf 30 25 20 15 10 5 2 1 0 SNR 0.15 0.20 0.25 0.30 0.35 RMSE LSSVR Cibersort SOLS Laplacian noise
Fig. 4.2: The Root Mean Squared Error (RMSE) as a function of the Signal to Noise Ration (SNR) is presented on a real dataset where noise was manually added. Two different noise distribution were tested: gaussian and laplacian. Each point of the curve is the mean RMSE of 12 different response vectors and we repeated the process four times for each level of noise. This would be equivalent to having 48 different repetitions.
As the level of noise increases, the SSVR estimator remains the estimator with the lowest RMSE in both gaussian and laplacian noise settings.
4.3. Isotonic regression. In this subsection, we will consider constraints that impose an order on the variables. This type of regression is usually called isotonic regression. Such constraints appear when prior knowledge are known on a certain order on the variables. This partial order on the variables can also be seen as an acyclic directed graph. More formally, we noteG= (V, E) a directed acyclic graph where V is the set of vertices andE is the set of nodes. On this graph, we define a partial order on the vertices. We will say for u, v∈V that u≤v if and only if there is a path joining u and v in G. This type of constraints seems natural in different applications such as biology, medicine, weather forecast.
The most simple example of this type of constraints might be the monotonic regression where we force the variables to be in a increasing or decreasing order. It means that with our former notations that we would impose thatβ1≤β2≤. . .≤βp
on the estimator. This type of constraints can be coded in a finite difference matrix (or more generally any incidence matrix of a graph)
A= 1 −1 0 . . . 0 0 1 −1 . .. ... .. . . .. . .. . .. 0 0 . . . 0 1 −1
and Γ = 0, b = 0, d = 0 forming linear constraints as in the scope of this paper. The Isotonic Support Vector Regression (ISVR) optimization problem is written as follows:
(ISVR) min β,β0,ξi,ξ∗i, 1 2||β|| 2+C(ν+1 n n X i=1 (ξi+ξ∗i)) subject to βTXi:+β0−yi≤+ξi yi−βTXi:−β0≤+ξi∗ ξi, ξ∗i ≥0, ≥0 β1≤β2≤. . .≤βn.
We compare our proposed ISVR estimator with the classical least squares isotonic regression (IR) [2] which is the solution of the following problem:
(IR) minβ
1
2||β−y||
2
subject to β1≤β2≤. . .≤βn.
Synthetic dataset. We first generated data from a gaussian distribution (µ= 0,
σ= 1) that we sorted and then added noise in the data following the same process as described insubsection 4.2with different SNR values (10 and 20). We tested gaussian noise and laplacian noise. We compared the estimation quality of both methods using MAE and RMSE. In this experiment, the design matrixX is the identity matrix. We performed grid search selection via cross validation for the hyperparameters C and ν. C had 5 different possible values taken on the logscale from 0 to 3, and ν had 5 different values taken between 0.05 and 1 on the linear scale. The dimension of the generated gaussian vector was 50 and we did 50 repetitions. We present inTable 4.2
the results of the experiment, the value inside a cell is the mean RMSE or MAE over the 50 repetitions and the value between brackets is the standard deviation over the repetitions. Under a low level of gaussian noise or laplacian noise, both methods are close in term of RMSE and MAE with a little advantage for the classical isotonic regression estimator. When the level of noise is important (SNR = 10), our proposed ISVR has the lowest RMSE and MAE for the two noise distribution tested.
Real dataset. Isotonic types of constraints can be found in different applications
such as biology, ranking and weather forecast for example. Focusing on global warm-ing type of data, reserchers have studied the anomaly of the average temperature over a year in comparison to the years 1961-1990. These temperature anomalies have a monotenous trend and keep increasing since 1850 untill 2015. Isotonic regression estimator was used on this dataset3in [13] and we compared our proposed ISVR
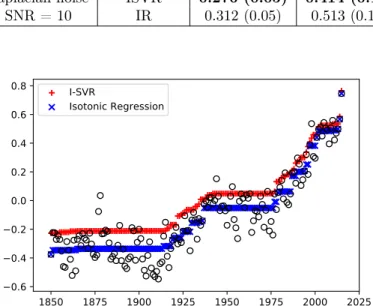
esti-mator for anomaly prediction. The hyperparameter for the ISVR were set manually for this simulation. subsection 4.3shows the result for the two estimators. The classi-cal isotonic regression estimator perform better than our proposed estimator globally which is confirmed by the RMSE and MAE values of RMSEIR = 0.0067 against
RMSEISV R= 0.083andMAEIR= 0.083againstMAEISV R= 0.116. Howevever, we
notice that in the portions where there is a significant change like between 1910-1940 and 1980-2005, the IR estimation looks like a step function whereas the ISVR estima-tion follows an increasing trend without these piecewise constant porestima-tions. Note that the bias induced by the use of constraints can be overcome with reffiting methods such as [10].
3This dataset can be downloaded from theCarbon Dioxide Information Analysis Centerat the Oak Ridge National Laboratory.
Table 4.2: Results for the Isotonic Support Vector Regression (ISVR), and the Isotonic regression (IR) for simulated data with p = 50. The mean (standard deviation) of the Root Mean Squared Error (RMSE) and the Mean Absolute Error (MAE) over 50 repetitions are reported. Different noise distribution (gaussian and laplacian) and different Signal to Noise Ratio (SNR) values were tested.
Distribution Estimator RMSE MAE
Gaussian noise ISVR 0.212 (0.02) 0.254 (0.06) SNR = 20 IR 0.203 (0.02) 0.229 (0.04) Gaussian noise ISVR 0.284 (0.04) 0.446 (0.12) SNR = 10 IR 0.311 (0.04) 0.534 (0.12) Laplacian noise ISVR 0.202 (0.03) 0.223 (0.05) SNR = 20 IR 0.203 (0.02) 0.221 (0.04) Laplacian noise ISVR 0.276 (0.05) 0.414 (0.11) SNR = 10 IR 0.312 (0.05) 0.513 (0.13) 1850 1875 1900 1925 1950 1975 2000 2025 0.6 0.4 0.2 0.0 0.2 0.4 0.6 0.8 I-SVR Isotonic Regression
Fig. 4.3: Global warming dataset. Annual temperature anomalies relative to 1961-1990 average, with estimated trend using Isotonic Support Vector Regression (ISVR) and the classical Isotonic Regression (IR) estimator.
4.4. Performance of the GSMO versus SMO. We compared the efficiency of the SMO algorithm to solve the classical SVR optimization problem and the SSVR optimization problem. To do so, we used the same data simulation process described earlier in this subsection and set the number of rows of the matrixX, n= 200and the number of columns p = 25. Two different settings were considered here, one without any noise in the data and another one with gaussian noise added such that the SNR would be equal to 30. The transparent trajectories represent the decrease of the objective function or the optimality score∆for the classical SMO in blue and for the generalized SMO in red for the 50 repetitions considered. The average trajectory is represented in dense color. Figure 4.4a and Figure 4.4b are the results for the noiseless setting and Figure 4.4c and Figure 4.4d for the setting with noise. When
0 20 40 60 80 100 1010 108 106 104 102 100 f(x)-f(x*)
(a) Dual objective function without noise
0 50 100 150 200 1010 108 106 104 102 100
Optimality score : Delta
(b) Delta optimality score without noise
0 50 100 150 200 250 300 350 400 450 1010 108 106 104 102 100 f(x)-f(x*)
(c) Dual objective function with noise
0 500 1000 1500 2000 1010 108 106 104 102 100
Optimality score: Delta
(d) Optimality score: Delta with noise
Fig. 4.4: Plots of 50 trajectories of the dual objective function value (Figure 4.4a,
Figure 4.4c) and the optimality score (Figure 4.4b, Figure 4.4d) in function of the number of iterations for the classical SMO algorithm in blue and the proposed gener-alized SMO in red. Two settings were used, one without noise and another one with additive gaussian noise.
there is not noise in the data, the generalized SMO decreases faster than the classical SMO. It is important to remind that the true vector here belongs to the simplex so without any noise it is not surprising that our proposed algorithm goes faster than the classical SMO. However, when noise is adding to the data, it takes more iterations for the generalized SMO to find the solution of the optimization problem.
5. Conclusion. In this paper, we studied the optimization problem related to SVR with linear constraints. We showed that for this optimization problem, strong duality holds and that the dual problem is convex. We presented a generalized SMO algorithm that solve the dual problem and we proved its convergence to a solution. This algorithm uses a coordinate descent strategy where a closed form of the updates were defined. The proposed algorithm is easy to implement and shows good perfor-mance in practise. We demonstrated the good perforperfor-mance of our proposed estimator on different regression settings. In presence of high level of noise, our estimator has shown to be robust and has better estimation performance in comparison to Least
Squares based estimators or projected SVR estimators.
This work leaves several open questions for future works. The question of the convergence rate of the algorithm is very natural and will have to be address in the future. Another natural question rises about the possiblity to extend our method on non-linear function estimation with linear constraints. From our point of view, it is a very challenging question because the dual optimization problem of the linearly constrained SVR loses its only dependance on the inner product between the columns of X, crossed terms appear in the objective function which makes it difficult to use the kernel trick as it would naturally be used for classical SVR.
REFERENCES
[1] A. R. Abbas, K. Wolslegel, D. Seshasayee, Z. Modrusan, and H. F. Clark,
De-convolution of blood microarray data identifies cellular activation patterns in systemic lu-pus erythematosus, PLOS ONE, 4 (2009), pp. 1–16,https://doi.org/10.1371/journal.pone. 0006098.
[2] R. E. Barlow and H. D. Brunk, The isotonic regression problem and its dual, Journal of the American Statistical Association, 67 (1972), pp. 140–147,https://doi.org/10.1080/ 01621459.1972.10481216.
[3] B. E. Boser, I. M. Guyon, and V. N. Vapnik,A training algorithm for optimal margin classifiers, in Proceedings of the Fifth Annual Workshop on Computational Learning The-ory, COLT ’92, New York, NY, USA, 1992, ACM, pp. 144–152,https://doi.org/10.1145/ 130385.130401.
[4] R. Bro and S. De Jong,A fast non-negativity-constrained least squares algorithm, Journal of Chemometrics, 11 (1997), pp. 393–401,https://doi.org/10.1002/(SICI)1099-128X(199709/ 10)11:5<393::AID-CEM483>3.0.CO;2-L.
[5] C. Chang and C. Lin,Training v-support vector regression: Theory and algorithms, Neural Comput., 14 (2002), pp. 1959–1977,https://doi.org/10.1162/089976602760128081. [6] C.-C. Chang and C.-J. Lin,LIBSVM: A library for support vector machines, ACM
Trans-actions on Intelligent Systems and Technology, 2 (2011), pp. 27:1–27:27.
[7] O. Chapelle, P. Haffner, and V. N. Vapnik,Support vector machines for histogram-based image classification, IEEE Transactions on Neural Networks, 10 (1999), pp. 1055–1064, https://doi.org/10.1109/72.788646.
[8] Chun-Hsin Wu, Jan-Ming Ho, and D. T. Lee,Travel-time prediction with support vector
regression, IEEE Transactions on Intelligent Transportation Systems, 5 (2004), pp. 276– 281,https://doi.org/10.1109/TITS.2004.837813.
[9] J. Couzin-Frankel,Cancer immunotherapy, Science, 342 (2013), pp. 1432–1433,https://doi.
org/10.1126/science.342.6165.1432.
[10] C.-A. Deledalle, N. Papadakis, J. Salmon, and S. Vaiter,Clear: Covariant least-square
refitting with applications to image restoration, SIAM Journal on Imaging Sciences, 10 (2017), pp. 243–284,https://doi.org/10.1137/16M1080318.
[11] H. Drucker, C. J. C. Burges, L. Kaufman, A. J. Smola, and V. Vapnik, Support
vector regression machines, in Advances in Neural Information Processing Systems 9, M. C. Mozer, M. I. Jordan, and T. Petsche, eds., MIT Press, 1997, pp. 155–161.
[12] T.-T. Friel and R. Harrison,Linear programming support vector machines for pattern clas-sification and regression estimation: and the sr algorithm: Improving speed and tightness of vc bounds in sv algorithms, research report, February 1998.
[13] B. R. Gaines, J. Kim, and H. Zhou,Algorithms for fitting the constrained lasso, Journal of Computational and Graphical Statistics, 27 (2018), pp. 861–871,https://doi.org/10.1080/ 10618600.2018.1473777.
[14] T. Gong, N. Hartmann, I. S. Kohane, V. Brinkmann, F. Staedtler, M. Letzkus, S. Bongiovanni, and J. D. Szustakowski, Optimal deconvolution of transcriptional
profiling data using quadratic programming with application to complex clinical blood sam-ples, PLOS ONE, 6 (2011), pp. 1–11,https://doi.org/10.1371/journal.pone.0027156. [15] D. Haussler, D. W. Bednarski, M. Schummer, N. Cristianini, N. Duffy, and T. S.
Furey,Support vector machine classification and validation of cancer tissue samples using microarray expression data, Bioinformatics, 16 (2000), pp. 906–914,https://doi.org/10. 1093/bioinformatics/16.10.906.
problems, Technometrics, 12 (1970), pp. 55–67, https://doi.org/10.1080/00401706.1970. 10488634.
[17] C.-J. Hsieh, K.-W. Chang, C.-J. Lin, S. S. Keerthi, and S. Sundararajan,A dual coordinate descent method for large-scale linear svm, in Proceedings of the 25th Inter-national Conference on Machine Learning, ICML ’08, New York, NY, USA, 2008, ACM, pp. 408–415,https://doi.org/10.1145/1390156.1390208.
[18] H. Jia and A. M. Martinez,Support vector machines in face recognition with occlusions, in 2009 IEEE Conference on Computer Vision and Pattern Recognition, June 2009, pp. 136– 141,https://doi.org/10.1109/CVPR.2009.5206862.
[19] T. Joachims,Text categorization with support vector machines: Learning with many relevant
features, in Machine Learning: ECML-98, C. Nédellec and C. Rouveirol, eds., Berlin, Heidelberg, 1998, Springer Berlin Heidelberg, pp. 137–142.
[20] S. S. Keerthi and E. G. Gilbert, Convergence of a generalized smo algorithm for svm classifier design, Mach. Learn., 46 (2002), pp. 351–360,https://doi.org/10.1023/A: 1012431217818.
[21] S. S. Keerthi, S. K. Shevade, C. Bhattacharyya, and K. R. K. Murthy,Improvements
to platt’s smo algorithm for svm classifier design, Neural Comput., 13 (2001), pp. 637–649, https://doi.org/10.1162/089976601300014493.
[22] F. Lauer and G. Bloch,Incorporating prior knowledge in support vector regression, Machine Learning, 70 (2008),https://doi.org/10.1007/s10994-007-5035-5.
[23] C. Lawson and R. Hanson, Solving Least Squares Problems, Society for Industrial and Applied Mathematics, 1995,https://doi.org/10.1137/1.9781611971217.
[24] C. K. Liew,Inequality constrained least-squares estimation, Journal of the American Statisti-cal Association, 71 (1976), pp. 746–751,https://doi.org/10.1080/01621459.1976.10481560. [25] C.-J. Lin, R. C. Weng, and S. S. Keerthi,Trust region newton methods for large-scale
logistic regression, 9 (2008), pp. 627–650.
[26] J. Lopez and J. R. Dorronsoro,Simple proof of convergence of the smo algorithm for
different svm variants, IEEE Transactions on Neural Networks and Learning Systems, 23 (2012), pp. 1142–1147,https://doi.org/10.1109/TNNLS.2012.2195198.
[27] S. Mohammadi, N. Zuckerman, A. Goldsmith, and A. Grama, A critical survey of deconvolution methods for separating cell types in complex tissues, Proceedings of the IEEE, 105 (2017), pp. 340–366,https://doi.org/10.1109/JPROC.2016.2607121.
[28] Y. Nesterov, Efficiency of coordinate descent methods on huge-scale optimization prob-lems, SIAM Journal on Optimization, 22 (2012), pp. 341–362,https://doi.org/10.1137/ 100802001.
[29] A. M. Newman, C. Liu, M. R. Green, A. J. Gentles, W. Feng, Y. Xu, C. D. Hoang, M. Diehn, and A. A. Alizadeh,Robust enumeration of cell subsets from tissue
expres-sion profiles., Nature methods, 12 (2015), pp. 453–457.
[30] J. Nutini, M. Schmidt, I. H. Laradji, M. Friedlander, and H. Koepke,Coordinate de-scent converges faster with the gauss-southwell rule than random selection, in Proceedings of the 32Nd International Conference on International Conference on Machine Learning -Volume 37, ICML’15, JMLR.org, 2015, pp. 1632–1641.
[31] F. Pedregosa, G. Varoquaux, A. Gramfort, V. Michel, B. Thirion, O. Grisel, M. Blondel, P. Prettenhofer, R. Weiss, V. Dubourg, J. Vanderplas, A. Passos, D. Cournapeau, M. Brucher, M. Perrot, and E. Duchesnay,Scikit-learn: Machine learning in Python, Journal of Machine Learning Research, 12 (2011), pp. 2825–2830. [32] J. Platt,Sequential minimal optimization: A fast algorithm for training support vector
ma-chines, (1998), p. 21.
[33] W. Qiao, G. Quon, E. Csaszar, M. Yu, Q. Morris, and P. W. Zandstra,Pert: A method for expression deconvolution of human blood samples from varied microenviron-mental and developmicroenviron-mental conditions, PLOS Computational Biology, 8 (2012), pp. 1–14, https://doi.org/10.1371/journal.pcbi.1002838.
[34] B. Schölkopf, P. Bartlett, A. Smola, and R. Williamson,Shrinking the tube: A new
support vector regression algorithm, in Proceedings of the 1998 Conference on Advances in Neural Information Processing Systems II, Cambridge, MA, USA, 1999, MIT Press, pp. 330–336.
[35] J. She,Linear convergence and support vector identifiation of sequential minimal optimization, 2017.
[36] A. J. Smola and B. Schölkopf, A tutorial on support vector regression, Statistics and Computing, 14 (2004), pp. 199–222,https://doi.org/10.1023/B:STCO.0000035301.49549. 88.
Processing Letters, 9 (1999), pp. 293–300,https://doi.org/10.1023/A:1018628609742. [38] R. Tibshirani,Regression shrinkage and selection via the lasso, Journal of the Royal Statistical
Society: Series B (Methodological), 58 (1996), pp. 267–288, https://doi.org/10.1111/j. 2517-6161.1996.tb02080.x.
[39] P. Tseng, Convergence of a block coordinate descent method for nondifferentiable
mini-mization, Journal of Optimization Theory and Applications, 109 (2001), pp. 475–494, https://doi.org/10.1023/A:1017501703105.
[40] T. Van Gestel, J. A. K. Suykens, D. . Baestaens, A. Lambrechts, G. Lanckriet, B. Vandaele, B. De Moor, and J. Vandewalle,Financial time series prediction using least squares support vector machines within the evidence framework, IEEE Transactions on Neural Networks, 12 (2001), pp. 809–821,https://doi.org/10.1109/72.935093.
[41] S. J. Wright,Coordinate descent algorithms, Mathematical Programming, 151 (2015), pp. 3– 34,https://doi.org/10.1007/s10107-015-0892-3.
[42] H. Zou and T. Hastie,Regularization and variable selection via the elastic net, Journal of the Royal Statistical Society: Series B (Statistical Methodology), 67 (2005), pp. 301–320, https://doi.org/10.1111/j.1467-9868.2005.00503.x.
Appendix A. Proof of Proposition 2.1.
Proof. We prove the part 2 and 3 of Proposition 2.1 starting by writing the
Lagrangian associated to Problem(LSVR-P): L=1 2||β|| 2+C(ν+ 1 n n X i=1 (ξi+ξi∗)) + n X i=1 αi(−−ξi−yi+βTXi:+β0) + n X i=1 α∗i(−−ξi∗+yi−βTXi:−β0)− n X i=1 λiξi+λ∗iξ ∗ i −η +γT(Aβ−b)−µT(Γβ−d) (A.1)
We will use the notationx(i∗) to denotexior x∗i. From(A.1), we write the KKT
conditions: ∇βL=β+ n X i=1 (αi−α∗i)Xi:+ATγ−ΓTµ= 0 (A.2a) ∇β0L= n X i=1 αi−α∗i = 0 (A.2b) ∇ξ(∗) i L=C n −α (∗) i −λ (∗) i = 0 (A.2c) ∇L=Cν− n X i=1 αi+α∗i −η= 0 (A.2d) α(i∗)≥0 (A.2e) η ≥0 (A.2f) λ(i∗)≥0 (A.2g) γj ≥0 (A.2h) αi(−−ξi−yi+βTXi:+β0) = 0 (A.2i) α∗i(−−ξi∗+yi−βTXi:−β0) = 0 (A.2j) λ(i∗)ξi(∗)= 0 (A.2k) η= 0 (A.2l) γj(Aβ−b)j = 0. (A.2m)
From(A.2c), we have that:
(A.3) λ(i∗)=C
n −α (∗)
i .
From(A.2e)and(A.2g), we have that:
(A.4) C
n ≥α
∗
i ≥0.
From(A.2d), we have that:
(A.5) η=Cν−
n
X
i=1
From(A.2a), (A.6) β=− n X i=1 (αi−α∗i)Xi:−ATγ+ ΓTµ. From(A.2b), (A.7) n X i=1 (αi−α∗i) = 0. From(A.2f), (A.8) Cν ≥ n X i=1 (αi+α∗i).
Using(A.3),(A.5),(A.7), we obtain:
L=1 2||β|| 2+Cν+C n n X i=1 (ξi+ξ∗i)− n X i=1 (αi+α∗i)− n X i=1 αiξi+α∗iξi∗ + n X i=1 (αi−α∗i)(−yi+βTXi:)− n X i=1 (C n −αi)ξi+ ( C n −α ∗ i)ξ∗i −(Cν− n X i=1 (αi+α∗i))+γ T(Aβ−b)−µT(Γβ−d), and L=1 2||β|| 2 − n X i=1 (αi−α∗i)yi+ n X i=1 (αi−α∗i)β TX i:+γT(Aβ−b)−µT(Γβ−d).
Replacingβ by the expression obtained in (A.6)yields to:
L=1 2h− n X i=1 (αi−α∗i)Xi:−ATγ+ ΓTµ,− n X i=1 (αi−α∗i)Xi:−ATγ+ ΓTµi − n X i=1 (αi−αi∗)yi+h− n X i=1 (αi−αi∗)Xi:−ATγ+ ΓTµ, n X i=1 (αi−α∗i)Xi:i +γT(A(− n X i=1 (αi−α∗i)Xi:−ATγ+ ΓTµ)−b) −µT(Γ(− n X i=1 (αi−αi∗)Xi:−ATγ+ ΓTµ)−d),
L=1 2 n X i=1 n X j=1 (αi−α∗i)(αj−α∗j)hXi:, Xj:i+ 1 2γ TAATγ+1 2µ TΓΓTµ + n X i=1 (αi−α∗i)γTAXi:− n X i=1 (αi−α∗i)µTΓXi:−γTAΓTµ− n X i=1 (αi−α∗i)yi − n X i=1 n X j=1 (αi−α∗i)(αj−α∗j)hXi:, Xj:i − n X i=1 (αi−α∗i)γ TAX i: + n X i=1 (αi−α∗i)µ TΓX i:− n X i=1 (αi−α∗i)γ TAX i:−γTAATγ+γTAΓTµ−γTb + n X i=1 (αi−α∗i)µ TΓX i:−µTΓΓTµ+γTAΓTµ+µTd, and finally L=−1 2(α−α ∗)TQ(α −α∗)−1 2γ TAATγ −1 2µ TΓΓTµ − n X i=1 (αi−α∗i)γ TAX i: + n X i=1 (αi−α∗i)µ TΓX i:+γTAΓTµ− n X i=1 (αi−α∗i)yi−γTb+µTd. (A.9)
Using the constraints derived from(A.2h), (A.7), (A.8), (A.4) and the expression of the Lagragian(A.9), the dual problem is as follows:
min α,α∗,γ,µ 1 2((α−α ∗)TQ(α−α∗) +γTAATγ+µTΓΓTµ+ 2 n X i=1 (αi−α∗i)γ TAX i: −2 n X i=1 (αi−α∗i)µ TΓX i:−2γTAΓTµ) + n X i=1 (αi−α∗i)yi+γTb−µTd subject to 0≤α(i∗)≤ C n n X i=1 αi+αi∗≤Cν n X i=1 αi−α∗i = 0 γj≥0. (A.10)
The equation linking the primal and the dual optimization problems is given by
(A.6)which finishes the proof.
Appendix B. Proof of Proposition 2.2.
Proof. To prove part 1., let’s recall thatαi,α∗i are the lagrange multipliers
asso-ciated to the optimization problem(LSVR-P)constraints:
(B.1) β
TX
i:+β0−yi≤+ξi
The complementary optimality conditions leads to
αi(βTXi:+β0−yi−−ξi) = 0
αi∗(yi−βTXi:−β0−−ξ∗i) = 0.
Let’s now suppose thatαi>0andα∗i >0which implies that
βTXi:+β0−yi−−ξi= 0
yi−βTXi:−β0−−ξi∗= 0.
It follows that−2=ξi+ξ∗i and ξi, ξi∗≥0 which impliesξi=ξ∗i == 0. This goes
against our condition >0.
To prove part 2., we need to remind the optimality conditions given in Appen-dix A,(A.2l)and(A.5) leads to
(Cν−
l
X
i=1
αi+α∗i)= 0.
Thus, if >0we have thatPn
i=1αi+α
∗
i =Cν.
Appendix C. Proof of Proposition 3.6.
We start by giving a lemma that will be usefull to prove the proposition for the blocksαandα∗.
Lemma C.1. If the update between iteration k andk+ 1 happens in the block α
(orα∗) and that(i, j)is the most violating pair of variables then
∇αif(θ k+1)− ∇ αjf(θ k+1) =∇ αif(θ k)− ∇ αjf(θ k) +t∗(Q ii+Qjj−2Qij)
Proof. Let’s recall that the update in the blockα(orα∗) has the following form
αki+1=αki +t∗ αjk+1=αjk−t∗,
witht∗ as defined in Definition 3.5. In a stacked form we have that ∇αif(θ k+1)− ∇ αjf(θ k+1) = (Qθk+1) i+li−(Qθk+1)j−lj = 2n+k1+k2 X s=1 Qisθks+1+li− 2n+k1+k2 X s=1 Qjsθks+1−lj =∇αif(θ k)− ∇ αjf(θ k) +t∗(Q ii−Qij) +t∗(Qjj−Qij) =∇αif(θ k)− ∇ αjf(θ k) +t∗(Q ii+Qjj −2Qij).
This lemma is helpful for the proof the blocksγ andµ.
Lemma C.2. Ifθi is the updated variable at iterationk, then the following holds:
∇if(θk+1) = ¯Qii(θik+1−θ k