Exercise Standards for Testing and Training
A Statement for Healthcare Professionals
From the American Heart Association
Gerald F. Fletcher, MD, Chair; Gary J. Balady, MD, Vice Chair; Ezra A. Amsterdam, MD;
Bernard Chaitman, MD; Robert Eckel, MD; Jerome Fleg, MD; Victor F. Froelicher, MD;
Arthur S. Leon, MD; Ileana L. Pin˜a, MD; Roxanne Rodney, MD;
Denise G. Simons-Morton, MD, PhD; Mark A. Williams, PhD; Terry Bazzarre, PhD
T
he purpose of this report is to provide revised standards and guidelines for the exercise testing and training of individuals who are free from clinical manifestations of cardiovascular disease and those with known cardiovascular disease. These guidelines are intended for physicians, nurses, exercise physiologists, specialists, technologists, and other healthcare professionals involved in exercise testing and training of these populations. This report is in accord with the “Statement on Exercise” published by the American Heart Association (AHA).1These guidelines are a revision of the 1995 standards of the AHA that addressed the issues of exercise testing and training.2An update of background, scientific rationale, and
selected references is provided, and current issues of practical importance in the clinical use of these standards are consid-ered. These guidelines are in accord with the American College of Cardiology (ACC)/AHA Guidelines for Exercise Testing.3
Exercise Testing
The Cardiovascular Response to ExerciseExercise, a common physiological stress, can elicit cardio-vascular abnormalities that are not present at rest, and it can be used to determine the adequacy of cardiac function. Because exercise is only one of many stresses to which humans can be exposed, it is more appropriate to call an exercise test exactly that and not a “stress test.” This is particularly relevant considering the increased use of nonex-ercise stress tests.
Types of Exercise
Three types of muscular contraction or exercise can be applied as a stress to the cardiovascular system: isometric
(static), isotonic (dynamic or locomotory), and resistance (a combination of isometric and isotonic).4,5Isotonic exercise,
which is defined as a muscular contraction resulting in movement, primarily provides a volume load to the left ventricle, and the response is proportional to the size of the working muscle mass and the intensity of exercise. Isometric exercise is defined as a muscular contraction without move-ment (eg, handgrip) and imposes greater pressure than vol-ume load on the left ventricle in relation to the body’s ability to supply oxygen. Cardiac output is not increased as much as in isotonic exercise because increased resistance in active muscle groups limits blood flow. Resistance exercise com-bines both isometric and isotonic exercise (such as free weight lifting).
Exercise Physiology
In the early phases of exercise in the upright position, cardiac output is increased by an augmentation in stroke volume mediated through the use of the Frank-Starling mechanism and heart rate; the increase in cardiac output in the latter phases of exercise is primarily due to an increase in heart rate. At fixed submaximal workloads below ventilatory threshold in healthy persons, steady-state conditions are usually reached within minutes after the onset of exercise; after this occurs, heart rate, cardiac output, blood pressure, and pulmo-nary ventilation are maintained at reasonably constant levels. During strenuous exertion, sympathetic discharge is maximal and parasympathetic stimulation is withdrawn, resulting in vasoconstriction in most circulatory body systems, except for that in exercising muscle and in the cerebral and coronary circulations. As exercise progresses, skeletal muscle blood flow is increased, oxygen extraction increases as much as 3-fold, total calculated peripheral resistance decreases, and
The American Heart Association makes every effort to avoid any actual or potential conflicts of interest that may arise as a result of an outside relationship or a personal, professional or business interest of a member of the writing panel. Specifically, all members of the writing group are required to complete and submit a Disclosure Questionnaire showing all such relationships that might be perceived as real or potential conflicts of interest.
This statement was approved by the American Heart Association Science Advisory and Coordinating Committee in June 2001. A single reprint is available by calling 800-242-8721 (US only) or writing the American Heart Association, Public Information, 7272 Greenville Ave, Dallas, TX 75231-4596. Ask for reprint No. 71-0210. To purchase additional reprints: up to 999 copies, call 800-611-6083 (US only) or fax 413-665-2671; 1000 or more copies, call 214-706-1466, fax 214-691-6342, or e-mail [email protected]. To make photocopies for personal or educational use, call the Copyright Clearance Center, 978-750-8400.
(Circulation. 2001;104:1694-1740.)
© 2001 American Heart Association, Inc.
Circulation is available at http://www.circulationaha.org
systolic blood pressure, mean arterial pressure, and pulse pressure usually increase. Diastolic blood pressure may remain unchanged or decrease to a minimal degree. The pulmonary vascular bed can accommodate as much as a 6-fold increase in cardiac output without a significant in-crease in pulmonary artery pressure. In normal subjects, this is not a limiting determinant of peak exercise capacity. Cardiac output can increase as much as 4- to 6-fold above basal levels during strenuous exertion in the upright position, depending on genetic endowment and level of training. In the postexercise phase, hemodynamics return to baseline within minutes of termination. Vagal reactivation is an important cardiac deceleration mechanism after exercise; it is acceler-ated in well-trained athletes but may be blunted in decondi-tioned and/or “medically ill” patients.
Maximum Oxygen Uptake
Oxygen uptake quickly increases when dynamic exercise is begun or increased. During staged exercise testing, oxygen uptake usually remains relatively stable (steady state) after the second minute of each intensity of exercise below the ventilatory threshold. Maximal oxygen consumption (V˙O2 max)
is the greatest amount of oxygen a person can take in from inspired air while performing dynamic exercise involving a large part of total muscle mass.6 It is considered the best
measure of cardiovascular fitness and exercise capacity. V˙O2 max
represents the amount of oxygen transported and used in cellular metabolism. It is convenient to express oxygen uptake in multiples of sitting/resting requirements. One met-abolic equivalent (MET) is a unit of sitting/resting oxygen uptake (⬇3.5 mL of O2 per kilogram of body weight per
minute [mL · kg⫺1
· min⫺1
]). V˙O2 maxis influenced by age, sex,
exercise habits, heredity, and cardiovascular clinical status. The ventilatory threshold is another measure of relative work effort, and it represents the point at which ventilation abruptly increases, despite linear increases in oxygen uptake and work rate. In most cases, the ventilatory threshold is highly reproducible, although it may not be achieved or readily identified in some patients, particularly those with very poor exercise capacity.7
Age
Maximum values of V˙O2 maxoccur between the ages of 15 and
30 years and decrease progressively with age. At 60 years, mean V˙O2 maxin men is approximately two-thirds of that at 20
years. The decline in V˙O2 maxaverages 8% to 10% per decade
in both sedentary and athletic populations.6
Sex
A lower V˙O2 maxin women is attributed to their smaller muscle
mass, lower hemoglobin and blood volume, and smaller stroke volume compared with men.
Exercise Habits
Physical activity has an important influence on V˙O2 max. After
3 weeks of bed rest, there is a 25% decrease in V˙O2 max in
healthy men. In moderately active young men, V˙O2 maxis⬇12
METs, whereas individuals performing aerobic training such as distance running can have a V˙O2 maxas high as 18 to 24
METs (60 to 85 mL · kg⫺1
· min⫺1
).
Heredity
There is a natural variation in V˙O2 maxthat is related to genetic
factors.8,9
Cardiovascular Clinical Status
V˙O2 max is affected by the degree of impairment caused by
disease. It is difficult to accurately predict V˙O2 maxfrom its
relation to exercise habits and age because of considerable scatter and correlations that are generally low. Table 1 depicts normal values for age. The nomogram shown in Figure 1 expresses the concept of maximal METs predicted from peak treadmill workload by reflecting it in terms of that expected for age in men, with 100% being normal.10
V˙O2 maxis equal to the product of maximum cardiac output
and maximum arteriovenous oxygen difference. Because cardiac output is equal to the product of stroke volume and heart rate and because stroke volume only increases to a certain level, V˙O2 is directly related to heart rate. The
maximum arteriovenous V˙O2difference (which increases with
exercise) during exercise has a physiological limit of 15% to 17% volume; hence, if maximum effort is achieved, V˙O2 max
can be used to estimate maximum cardiac output.
Myocardial Oxygen Uptake
Myocardial oxygen uptake is primarily determined by in-tramyocardial wall stress (ie, the product of left ventricular [LV] pressure and volume, divided by LV wall thickness), contractility, and heart rate. Other, less important factors include external work performed by the heart, the energy necessary for activation, and the basal metabolism of the myocardium.
Accurate measurement of myocardial oxygen uptake re-quires cardiac catheterization to obtain coronary arterial and
TABLE 1. Normal Values of Maximal Oxygen Uptake at Different Ages
Age, y Men Women
20 –29 mL䡠kg⫺1䡠min⫺1 43⫾7.2 36⫾6.9 METs 12 10 30–39 mL䡠kg⫺1䡠min⫺1 42⫾7.0 34⫾6.2 METs 12 10 40–49 mL䡠kg⫺1䡠min⫺1 40⫾7.2 32⫾6.2 METs 11 9 50–59 mL䡠kg⫺1䡠min⫺1 36⫾7.1 29⫾5.4 METs 10 8 60–69 mL䡠kg⫺1䡠min⫺1 33⫾7.3 27⫾4.7 METs 9 8 70–79 mL䡠kg⫺1䡠min⫺1 29⫾7.3 27⫾5.8 METs 8 8
Values are expressed as mean⫾SD. MET indicates metabolic equivalent or 3.5 mL O2䡠kg⫺1䡠min⫺1.
venous oxygen content. Myocardial oxygen uptake can be estimated during clinical exercise testing by the product of heart rate and systolic blood pressure, which is called the double product or rate-pressure product. There is a linear relation between myocardial oxygen uptake and coronary blood flow. During exercise, coronary blood flow increases as much as 5-fold above the resting value. A subject with obstructive coronary artery disease (CAD) often cannot maintain adequate coronary blood flow to the affected region and supply the metabolic demands of the myocardium during exercise; consequently, myocardial ischemia occurs. Myocar-dial ischemia usually occurs at the same rate-pressure product rather than at the same external workload (eg, exercise test stage).
Heart Rate Response
The immediate response of the cardiovascular system to exercise is an increase in heart rate due to a decrease in vagal tone. This increase is followed by an increase in sympathetic outflow to the heart and systemic blood vessels. During dynamic exercise, heart rate increases linearly with workload and V˙O2. Heart rate will reach a steady state within minutes
during low levels of exercise and at a constant work rate. As workload increases, the time necessary for the heart rate to stabilize will progressively lengthen.
The heart rate response to exercise is influenced by several factors. There is a decline in mean maximum heart rate with age11that seems to be related to neural influences. Dynamic
exercise increases heart rate more than isometric or resistance exercise. An accelerated heart rate response to standardized workloads is observed after prolonged bed rest, indicating a deconditioning response. Other factors that influence heart rate include body position, type of dynamic exercise, certain
physical conditions, state of health, blood volume, sinus node function, medications, and environment.
Arterial Blood Pressure Response
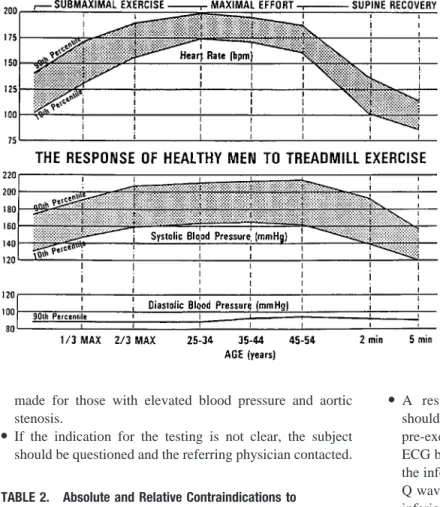
Systolic blood pressure rises with increasing dynamic work as a result of increasing cardiac output, whereas diastolic pressure usually remains about the same or moderately lower, and it may be heard to zero in some normal subjects. Normal values of maximum systolic blood pressure for men have been defined and are directly related to age.
After maximum exercise, there is usually a decline in systolic blood pressure, which normally reaches resting levels within 6 minutes and often remains lower than pre-exercise levels for several hours. When exercise is terminated abruptly, some healthy persons have precipitous drops in systolic blood pressure due to venous pooling and a delayed immediate postexercise increase in systemic vascular resis-tance to match the reduction in cardiac output. Figure 2 shows the physiological response to submaximal and maximum treadmill exercise on the basis of tests of ⬎700 apparently healthy men aged 25 to 54 years. Maximum rate-pressure product (heart rate⫻systolic blood pressure) ranges from a tenth percentile value of 25 000 to a 90th percentile value of 40 000.
Testing Procedures
Subject PreparationPreparations for exercise testing include the following. ● The subject should be instructed not to eat or smoke for 3
hours before the test. Water may be taken as needed at any time. Subjects should dress appropriately for exercise, especially with regard to footwear. No unusual physical efforts should be performed for at least 12 hours before testing.
● When exercise testing is performed for diagnostic pur-poses, withdrawal of medications may be considered be-cause some drugs (especially -blockers) attenuate the exercise responses and limit the test interpretation. There are no formal guidelines for tapering medications, but rebound phenomena may occur with abrupt discontinuation of -blockers in patients with a recent acute coronary syndrome. However, most subjects are tested while taking their usual medications. Specific questioning is important to determine which drugs have been taken so that the physician can be aware of possible electrolyte abnormali-ties and hemodynamic effects of cardioactive drugs. ● A brief history and physical examination should be
per-formed to rule out contraindications (Table 2) to testing or to detect important clinical signs such as a cardiac murmur, gallop sounds, pulmonary “wheezing,” or rales. Subjects with a history of worsening unstable angina or decompen-sated heart failure should not undergo exercise testing until their condition stabilizes. A cardiac physical examination should indicate which subjects have valvular or congenital heart disease. Because hemodynamic responses to exercise may be abnormal in such subjects, such subjects always warrant careful monitoring and, at times, may require early termination of testing. Special considerations should be
Figure 1.Nomogram based on age, METs, and activity status (sedentary vs active) that provides a percent of age-expected exercise capacity in men. For example, a 60-year-old man with a 3-MET capacity has 40% of the age-expected exercise capacity for sedentary men and 30% of that for active men.
made for those with elevated blood pressure and aortic stenosis.
● If the indication for the testing is not clear, the subject should be questioned and the referring physician contacted.
● A resting standard 12-lead electrocardiogram (ECG) should be obtained because it may differ from the resting pre-exercise ECG. The “torso” ECG distorts the standard ECG by shifting the axis to the right, increasing voltage in the inferior lead group. This may cause a disappearance of Q waves in a patient with a documented previous Q-wave inferior myocardial infarction (MI).
● Standing ECG and blood pressure should be recorded (in the sitting position with cycle ergometry) to determine vasoregulatory abnormalities and positional changes, espe-cially ST-segment depression.
● A detailed explanation of the testing procedure should be given that outlines risks and possible complications. The subject should be instructed on how to perform the test, and these instructions should include a demonstration. If mus-culoskeletal or certain orthopedic limitations are a concern, the testing protocol should be modified.
Electrocardiographic Recording
Skin Preparation
The most critical point of the electrode-amplifier recording system is the interface between electrode and skin. Removal of the superficial layer of skin significantly lowers its resistance, thus decreasing the signal-to-noise ratio. The areas for electrode application are first shaved and then rubbed with alcohol-saturated gauze. After the skin dries, it is marked with a felt-tipped pen and rubbed with a fine sandpaper or rough material. With these procedures, skin resistance should be reduced to 5000⍀or less.
Electrodes and Cables
Many electrodes are available for performing exercise testing. Silver plate or silver chloride crystal pellets are preferred because they have the lowest offset voltage. Care should be taken to assure that the electrode gel is moist.
Figure 2.Normal response to progressive tread-mill exercise in healthy subjects. bpm indicates beats per minute. Reprinted with permission from Froelicher VF.Exercise and the Heart: Clinical Concepts. Chicago, Ill: Yearbook Medical Publish-ers, Inc; 1987:102.
TABLE 2. Absolute and Relative Contraindications to Exercise Testing
Absolute
●Acute MI (within 2 days) ●High-risk unstable angina
●Uncontrolled cardiac arrhythmias causing symptoms of hemodynamic compromise
●Active endocarditis
●Symptomatic severe aortic stenosis ●Decompensated symptomatic heart failure ●Acute pulmonary embolus or pulmonary infarction
●Acute noncardiac disorder that may affect exercise performance or be aggravated by exercise (eg, infection, renal failure, thyrotoxicosis) ●Acute myocarditis or pericarditis
●Physical disability that would preclude safe and adequate test performance
●Inability to obtain consent Relative*
●Left main coronary stenosis or its equivalent ●Moderate stenotic valvular heart disease ●Electrolyte abnormalities
●Tachyarrhythmias or bradyarrhythmias
●Atrial fibrillation with uncontrolled ventricular rate ●Hypertrophic cardiomyopathy
●Mental impairment leading to inability to cooperate ●High-degree AV block
*Relative contraindications can be superseded if benefits outweigh risks of exercise.
Connecting cables between the electrodes and recorder should be light, flexible, and properly shielded. Most avail-able commercial exercise cavail-ables are constructed to lessen motion artifact. Cables generally have a life span of⬇1 year. They eventually become a source of both electrical interfer-ence and discontinuity and must be replaced.
Multiple Leads
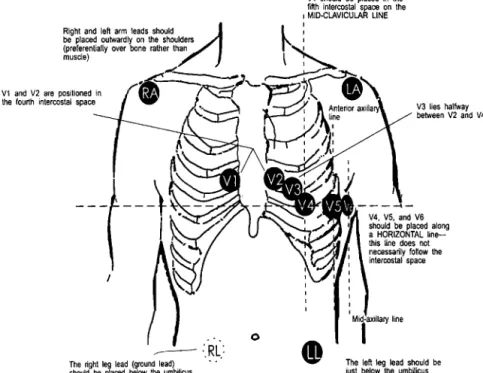
Because a high-quality standard 12-lead ECG with electrodes placed on the limbs cannot be obtained during exercise, other electrode placements have been used. Electrode placement affects ST segment slope and amplitude. Various placements do not result in comparable waveforms for analysis. For comparison with the standard resting 12-lead recording, arm and leg electrodes should be moved to the wrists and ankles, with the subject in the supine position. Differences can be minimized by placing the arm electrodes as close to the shoulders as possible, placing the leg electrodes below the umbilicus, and recording the resting ECG with the subject supine (Figure 3). Any modification of lead placement should be recorded on the tracing.
Relative Sensitivity of Leads
The lateral precordial leads (V4 through V6) are capable of
detecting 90% of all ST depression observed in multiple lead systems. ST elevation (over non–Q-wave areas) is a rare but critical change due to transmural ischemia that occurs as frequently in lead V2and aVF as in V5.
Recorders
There are many good recorders designed to capture high-quality ECG data during exercise. Many use microprocessors
to generate average waveforms and make ECG measure-ments. The physician must compare the raw analog data with computer-generated output to validate its accuracy. Computer processing is not completely reliable because of software limitations in handling noise and inadequacy of the available algorithms.
Equipment and Protocols
For details regarding exercise testing equipment and exercise testing laboratories, the reader should refer to the AHA’s “Guidelines for Clinical Exercise Testing Laboratories.”12
Figure 4 illustrates the relation of METs to stages in the various testing protocols. The treadmill and cycle ergometer are now the most commonly used dynamic exercise testing devices.
Cycle
Electrically braked cycles vary the resistance to the pedaling speed (rate-independent ergometers), thereby permitting bet-ter power output control, because it is common for subjects who are fatigued or unable to cooperate to decrease their pedaling speed. The highest values of V˙O2and heart rate are
obtained with pedaling speeds of 50 to 80 rpm. Cycles are calibrated in kiloponds (kp) or watts (W); 1 W is equivalent to⬇6 kp-meters per minute (kpm/min). Because exercise on a cycle ergometer is non–weight-bearing, kiloponds or watts can be converted to oxygen uptake in milliliters per minute. METs are obtained by dividing V˙O2in milliliters per minute
by the product of body weight (in kg)⫻3.5. The number 3.5 is the accepted value assigned to oxygen uptake while at rest and is expressed as milliliters of O2 per kilogram of body
Figure 3.Placement of 12-lead ECG electrodes. RA indicates right arm; LA, left arm; RL, right leg; and LL, left leg.
weight per minute. Figure 4 demonstrates the MET levels at given work rates (kpm/min) of a cycle protocol for a 70-kg person.
The cycle ergometer is usually less expensive, occupies less space, and is less noisy than a treadmill. Upper body motion is usually reduced, making it easier to obtain blood pressure measurements and to record the ECG. Care must be taken to prevent isometric or resistance exercise of the arms while grasping the handlebars.
A major limitation to cycle ergometer testing is the discomfort and fatigue of the quadriceps muscles. Leg fatigue in an inexperienced subject may cause him or her to stop before reaching a true V˙O2 max. Thus, V˙O2 maxis 10% to 15%
lower in cycle versus treadmill testing in those not accus-tomed to cycling.
Treadmill
The treadmill should have front and/or side rails to aid in subject stability. However, subjects should be encouraged not to tightly grasp the front or side rails because this action supports body weight and thus reduces the workload at any given stage. It may be helpful if subjects remove their hands from the rails, close their fists, and place one finger on the rails to maintain balance after they are accustomed to walking on the treadmill. The treadmill should have both variable speed and grade capability and must be accurately calibrated. Protocols
Protocols for clinical exercise testing include an initial warm-up (low load), progressive uninterrupted exercise with
increasing loads and an adequate time interval in each level, and a recovery period. For cycle ergometry, the initial power output is usually 10 or 25 W (150 kpm/min), usually followed by increases of 25 W every 2 or 3 minutes until end points are reached. If arm ergometry is substituted for cycle ergometry, a similar protocol may be used, except that initial power output and incremental increases are lower. Two-minute stages are most popular with arm ergometry.13,14
Several different treadmill protocols are in use and are defined in Figure 4 according to treadmill speed, grade, stage duration, and estimated METs. The advantages of the Bruce protocol are its use in many published studies and the value of 3-minute stages to acquire submaximal data. Its disadvan-tages are large interstage increments in work that can make estimation of V˙O2 maxless accurate and a fourth stage that can
be either run or walked, resulting in different oxygen costs. Some subjects are forced to stop exercising prematurely because of musculoskeletal discomfort or an inability to tolerate the high workload increments. Initial zero or one-half stages (1.7 miles/hour at 0% and 5% grades) can be used for subjects with compromised exercise capacities. The optimum protocol for any test should last 6 to 12 minutes and should be adjusted to the subject’s needs.
Ramp protocols start the subject at a relatively low tread-mill speed, which is gradually increased until the patient has a good stride. The ramp angle of incline is progressively increased at fixed intervals (ie, 10 to 60 seconds) starting at 0 grade, with the increase in grade calculated on the patient’s
Figure 4.Relation of METs to stages in the various testing protocols. Functional class refers to New York Heart Association class; kpm indicates kilopond-meters; MPH, miles per hour; and %GR, percent grade.
estimated functional capacity such that the protocol will be completed in 6 to 12 minutes. In this type of protocol, the rate of work increases continuously, and steady states are not reached. A limitation of ramp protocols is the requirement to estimate functional capacity from an activity scale and adjust the ramp accordingly. Occasionally underestimation or over-estimation of functional capacity will result in an endurance test or in premature exercise termination. Exercise protocols should be individualized according to the type of subject being tested. A 9-minute targeted ramp protocol that in-creases in small steps has many advantages, including more accurate estimates of MET level.15
The 6-minute walk test is a functional test that can be used to evaluate exercise capacity in patients with marked LV dysfunction or peripheral arterial occlusive disease who cannot perform cycle ergometer or treadmill exercise. Pa-tients are instructed to walk down a 100-foot corridor at their own pace, attempting to cover as much ground as possible in 6 minutes. At the end of the 6-minute interval, the total distance walked is determined and the symptoms experienced by the patient are recorded. This type of protocol uses a submaximal level of stress and thus correlates only modestly with V˙O2 max.16ECG monitoring is not routinely done with this
testing, thus limiting its diagnostic accuracy.
Exercise Test Supervision and Interpretation
Exercise testing should be conducted only by well-trained personnel with a sufficient knowledge of exercise physiology. Only technicians, physiologists, nurses, and physicians famil-iar with normal and abnormal responses during exercise can recognize or prevent adverse events. Equipment, medications, and personnel trained to provide advanced cardiopulmonary resuscitation (CPR) must be readily available. For details regarding supervision and interpretation of exercise tests, the reader should refer to the ACC/AHA/American College of Physicians’ “Clinical Competence Statement on Stress Testing.”17
Although exercise testing is considered a safe procedure, there are reports of acute MIs and deaths. Multiple surveys confirm that as many as 10 MIs or deaths or both may be expected per 10 000 tests in those with CAD.18Risk is greater
in the post-MI subject and in those being evaluated for malignant ventricular arrhythmias. A review summarizing 8 studies of estimates of sudden cardiac death during exercise testing revealed rates from 0.0 (4 studies) to 5 per 100 000 tests.18Table 3 lists 3 classes of complications secondary to
exercise tests.
Good clinical judgment should be foremost in deciding indications and contraindications for exercise testing.3
Al-though absolute contraindications are definitive, in selected cases with relative contraindications, even submaximal test-ing can provide valuable information. Table 2 lists absolute and relative contraindications to exercise testing. In any procedure with a risk of complications, the physician should be certain that the subject understands the risks and benefits of the test. Good physician-patient communication about testing is mandatory, and written informed consent should be obtained.
Exercise testing should be performed under the supervision of a physician who is appropriately trained to administer exercise tests. The physician should be responsible for ensuring that the exercise laboratory is properly equipped and that exercise testing personnel are appropriately trained. The degree of subject supervision needed during a test can be determined by the clinical status of the subject being tested. This determination is made by the physician or physician’s designated staff member, who asks pertinent questions about the subject’s medical history, performs a brief physical examination, and reviews the standard 12-lead ECG per-formed immediately before testing. The physician should interpret data derived from testing and suggest further eval-uation or therapy. The physician or senior medical profes-sional conducting the test must be trained in advanced CPR. A defibrillator and appropriate medications should also be immediately available.
The degree of supervision can be assigned to a properly trained nonphysician (ie, a nurse, physician assistant, or exercise physiologist or specialist) for testing apparently healthy younger persons (⬍40 years of age) and those with stable chest pain syndromes. A physician should be immedi-ately available during all exercise tests.
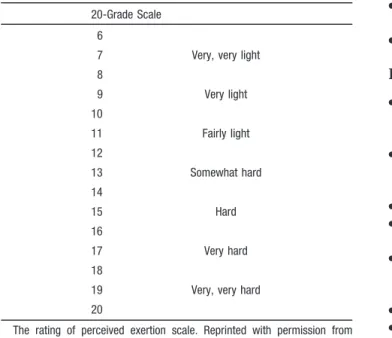
Perceived Exertion
The subjective rating of the intensity of exertion perceived by the person exercising is generally a sound indicator of relative fatigue. Rather than using heart rate alone to clinically determine intensity of exercise, the 6 to 20 Borg scale of perceived exertion19 is useful (Table 4). Special verbal and
written explanations about the rating of perceived exertion are available for subjects. Although there is some variation among subjects in their actual rating of fatigue, they seem to rate consistently from test to test. Thus, the Borg scale can assist the clinician in judging the degree of fatigue reached from one test to another and in correlating the level of fatigue during testing with that experienced during daily activities. In general, a Borg scale⬎18 indicates the patient has performed maximal exercise, and values ⬎15 to 16 suggest that the anaerobic threshold has been exceeded.
TABLE 3. Complications Secondary to Exercise Tests
Cardiac
●Bradyarrhythmias ●Tachyarrhythmias ●Acute coronary syndromes ●Heart failure
●Hypotension, syncope, and shock ●Death
Noncardiac
●Musculoskeletal trauma ●Soft-tissue injury Miscellaneous
●Severe fatigue (malaise), sometimes persisting for days; dizziness; fainting; body aches; delayed feelings of illness
Anginal Scale
Levels of anginal discomfort in those with known or sus-pected CAD are also excellent subjective end points. Table 5 details the 1 to 4 scale that is recommended.
Indications for Terminating Exercise Testing
Absolute Indications● ST-segment elevation (⬎1.0 mm) in leads without Q waves (other than V1or aVR).
● Drop in systolic blood pressure⬎10 mm Hg (persistently below baseline), despite an increase in workload, when accompanied by any other evidence of ischemia.
● Moderate-to-severe angina (grade 3 to 4); Table 5 details descriptions and grades for angina scale.
● Central nervous system symptoms (eg, ataxia, dizziness, or near syncope).
● Signs of poor perfusion (cyanosis or pallor).
● Sustained ventricular tachycardia.
● Technical difficulties monitoring the ECG or systolic blood pressure.
● Subject’s request to stop. Relative Indications
● ST or QRS changes such as excessive ST displacement (horizontal or downsloping of ⬎2 mm) or marked axis shift.
● Drop in systolic blood pressure⬎10 mm Hg (persistently below baseline). despite an increase in workload, in the absence of other evidence of ischemia.
● Increasing chest pain.
● Fatigue, shortness of breath, wheezing, leg cramps, or claudication.
● Arrhythmias other than sustained ventricular tachycardia, including multifocal ectopic, ventricular triplets, supraventric-ular tachycardia, heart block, or bradyarrhythmias.
● General appearance (see below).
● Hypertensive response (systolic blood pressure⬎250 mm Hg and/or diastolic blood pressure⬎115 mm Hg).
● Development of bundle-branch block that cannot be distin-guished from ventricular tachycardia.
Postexercise Period
Some abnormal responses occur only in recovery. If maxi-mum sensitivity is to be achieved with an exercise test, subjects should be supine in the postexercise period; how-ever, for subject comfort, many health professionals prefer the sitting position. A cool-down walk after the test can delay or eliminate the appearance of ST-segment depression; how-ever, the cool down may be indicated in some subjects, whereas abrupt cessation of exercise is the norm for exercise ECG studies. Monitoring should continue for 6 to 8 minutes after exercise or until blood pressure, heart rate, and ST segments are approximate to baseline values. Approximately 85% of subjects with abnormal responses manifest the abnor-mality during exercise or within 5 to 6 minutes of recovery. An abnormal ECG response occurring only in the recovery period is not unusual. Mechanical dysfunction and electro-physiological abnormalities in the ischemic ventricle after exercise can persist for minutes to hours. Monitoring of blood pressure should continue during recovery because abnormal responses may occur, particularly hypotension.
Interpretation
Clinical ResponsesSymptoms
Typical anginal symptoms induced by the exercise test are predictive of CAD and are even more predictive with asso-ciated ST-segment depression. It is important to obtain a careful description of the discomfort from the subject to ascertain that it is typical angina rather than nonischemic chest pain.
Subject’s Appearance
The subject’s general appearance is helpful in the clinical assessment. A decrease in skin temperature, cool and light perspiration, and peripheral cyanosis during exercise can
TABLE 4. Borg Scale for Rating Perceived Exertion
20-Grade Scale 6
7 Very, very light
8 9 Very light 10 11 Fairly light 12 13 Somewhat hard 14 15 Hard 16 17 Very hard 18
19 Very, very hard
20
The rating of perceived exertion scale. Reprinted with permission from Borg.19
TABLE 5. Four-Level Angina Scale for Exercise Tolerance Testing*
Description Level
Onset of angina, mild but recognized as the usual angina-of-effort pain or discomfort with which the subject is familiar
1 Same pain, moderately severe and definitely uncomfortable but
still tolerable
2 Severe anginal pain at a level that the subject will wish to stop
exercising
3 Unbearable chest pain; the most severe pain the subject has felt 4 *Angina criteria for stopping a symptom-limited exercise test is level 2 angina, approaching level 3. Data in Table are from Allred EN, Bleecker ER, Chaitman BR, et al. Effects of carbon monoxide on myocardial ischemia. Environ Health Perspect. 1991;91:89 –132 and Allred EN, Bleecker ER, Chaitman BR, et al. Short-term effects of carbon monoxide exposure on the exercise performance of subjects with coronary artery disease.N Engl J Med. 1989;321:1426 –1432.
indicate poor tissue perfusion due to inadequate cardiac output with secondary vasoconstriction. Such subjects should not be encouraged to attempt greater workloads.
Physical Examination
Cardiac auscultation immediately after exercise can provide information about ischemia-induced LV dysfunction. Gallop sounds or a precordial bulge can result from LV dysfunction. A new mitral regurgitant murmur suggests papillary muscle dysfunction, which may be related to transitory myocardial ischemia. It is preferable to have subjects lie supine after exercise testing and allow those who develop orthopnea to sit up. In addition, severe angina or ominous arrhythmias after exercise may be lessened by allowing the subject to sit up, because ischemia may be decreased due to lower LV wall tension.
Exercise Capacity
Maximal work capacity in normal individuals is influenced by familiarization with the exercise test equipment, level of training, and environmental conditions at the time of testing. In estimating exercise capacity, the amount of work per-formed in METs (or exercise stage achieved) should be the index measured and not the number of minutes of exercise. Serial comparison of exercise capacity in individual patients to assess significant interval change requires a careful exam-ination of the exercise protocol used during both tests, cardioactive drug therapy and time of ingestion, systemic blood pressure, and other conditions that might influence test performance. Each of these factors must be considered before attributing changes in functional capacity to progression of coronary heart disease or worsening of LV function.
A normal exercise capacity does not exclude severe LV systolic dysfunction. Mechanisms proposed to explain a normal work performance in these subjects include increased peripheral oxygen extraction, preservation of stroke volume and chronotropic reserve, ability to tolerate elevated pulmo-nary wedge pressures without dyspnea, ventricular dilation, and increased levels of plasma norepinephrine at rest and during exercise. Many subjects with decreased ejection frac-tions at rest can perform relatively normal levels of exercise, some without side effects, whereas others report increased fatigue for some time after the test.
Hemodynamic Responses
Blood Pressure During Exercise
Blood pressure is dependent on cardiac output and peripheral resistance. An inadequate rise or a fall in systolic blood pressure during exercise can occur. An inadequate rise in systolic blood pressure (⬍20 to 30 mm Hg) or a drop can result from aortic outflow obstruction, severe LV dysfunc-tion, myocardial ischemia, and certain types of drug therapy (ie,-blockers). In some subjects with CAD, higher levels of systolic blood pressure exceeding peak exercise values have been observed during the recovery phase.21In most studies,
exercise-induced hypotension in association with other mea-sures of ischemia predicts a poor prognosis, with a positive predictive value of 50% for left main or triple-vessel dis-ease.22Exercise-induced hypotension is also associated with
cardiac complications during exercise testing (for example, serious arrhythmias), seems to be alleviated by coronary artery bypass grafting (CABG), and can occur in subjects with CAD, valvular heart disease, or cardiomyopathy. Occa-sionally, subjects without clinically significant heart disease will exhibit exercise-induced hypotension during exercise related to dehydration, antihypertensive therapy, or prolonged strenuous exercise.
Heart Rate During Exercise
Relatively rapid heart rate during submaximal exercise or recovery could be due to deconditioning, prolonged bed rest, anemia, metabolic disorders, or any other condition that decreases vascular volume or peripheral resistance. This finding is relatively frequent soon after MI and CABG. Relatively low heart rate at any point during submaximal exercise could be due to exercise training, enhanced stroke volume, or drugs. The common use of -blockers, which lower heart rate, limits the interpretation of the heart rate response to exercise. Conditions that affect the sinus node can attenuate the normal response of heart rate during exercise testing. Chronotropic incompetence, which is defined as either failure to achieve 85% of the age-predicted maximal heart rate or a low chronotropic index (heart rate adjusted to MET level), is associated with an increased mortality risk in patients with known cardiovascular disease.23
Responses in Subjects With Normal Resting ECGs
P Wave
During exercise, P wave magnitude increases significantly in inferior leads. There should be no significant changes in P wave duration.
PR Segment
The PR segment shortens and slopes downward in the inferior leads during exercise. The decreasing slope has been attrib-uted to atrial repolarization (the Ta wave) and can cause false-positive ST depression in the inferior leads.
QRS Complex
The Q wave shows very small changes from the resting values; however, it does become slightly more negative at maximum exercise. Changes in median R wave amplitude are noted near maximum effort. A sharp decrease in the R wave is observed in the lateral leads (V5) at maximum exercise and
into the first minute of recovery. In the lateral and vertical leads (V5 and aVF), the S wave becomes greater in depth
(more negative), showing a greater deflection at maximum exercise, and then gradually returns to resting values in recovery. As the R wave decreases in amplitude, the S wave increases in depth.
J-Junction (J-Point) Depression
The J junction (QRS end/ST beginning) is depressed in lateral leads to a maximum depression at maximum exercise, then gradually returns toward pre-exercise values in recovery. J-junction depression is more common in older patients. Subjects with resting J-junction elevation (early repolariza-tion) may develop an isoelectric J junction with exercise; this is a normal finding. The normal ST segment vector response
both to tachycardia and exercise is a shift rightward and upward.
T Wave
A gradual decrease in T wave amplitude is observed in all leads during early exercise. At maximum exercise, the T wave begins to increase, and at 1 minute into recovery, the amplitude is equivalent to resting values in the lateral leads. U Wave
No significant changes are noted with exercise; however, U waves may be difficult to identify at ventricular rates⬎130 beats/min because of the close approximation of the T and P waves with the increased heart rate of exercise.
Abnormal Responses
ST Segment Changes
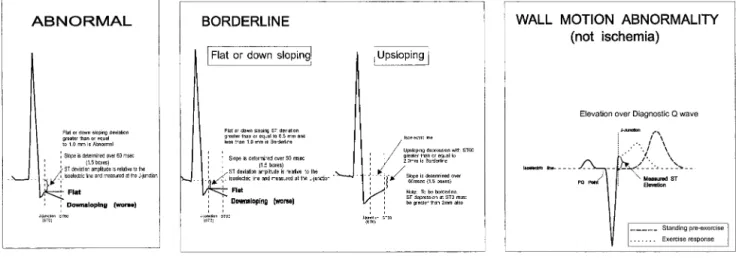
The ST level is measured relative to the P-Q junction because the U-P segment during exercise is difficult to measure. Ideally, 3 consecutive beats in the same lead with a stable baseline should be identified and the average displacement determined. The 3 key measurements are identification of the P-Q junction (isoelectric line), the J point (ie, J junction, QRS end, and ST segment beginning), and 60 or 80 ms after the J point. At ventricular rates⬎130 beats/min, 60 ms after the J junction is optimal to determine the extent of ST segment displacement in patients with an upsloping ST segment slope. When the J point relative to the P-Q junction is depressed at baseline, the net difference from the J junction determines the magnitude of exercise-induced displacement. When the J junction is elevated at rest (early repolarization) and progres-sively becomes more depressed during exercise, the magni-tude of ST-segment displacement is determined from the P-Q junction and not from the resting elevated J junction. Exercise-induced myocardial ischemia can result in 1 of the following 3 ST segment manifestations on the surface ECG: depression, elevation, or normalization (Figure 5).
ST Segment Depression
ST segment depression is the most common manifestation of exercise-induced myocardial ischemia. The ST segment de-pression represents electrical gradients caused by myocardial
ischemic segments, the extent of the ischemic zone, previous areas of myocardial necrosis, and location of the recording electrodes (Figure 5). The standard criterion for this abnormal response is horizontal or downsloping ST segment depression ofⱖ0.10 mV (1 mm) for 80 ms. However, as shown in Figure 5, other criteria have been considered. Downsloping ST segment depression is a more specific change than horizontal or upsloping depression. In the presence of marked baseline abnormalities, exercise-induced ST segment depression is less specific for myocardial ischemia. Other factors related to the probability and severity of CAD include the degree, time of appearance, duration, and number of leads with ST segment depression.
Severity of CAD is also related to the time of appearance of ischemic ST segment shifts. The lower the workload and rate-pressure product at which it occurs, the worse the prognosis and the more likely the presence of multivessel disease. The duration of ST depression in the recovery phase is also related to the severity of CAD.
ST Segment Elevation
Exercise-induced elevation may occur in an infarct territory where Q waves are present or in a noninfarct territory. The development of ⬎0.10 mV of J-point elevation that is persistently elevated (⬎0.10 mV) at 60 ms after the J point in 3 consecutive beats with a stable baseline is considered an abnormal response.
ST Segment Elevation in Post-MI Patients With Q Waves Prior MI is the most frequent cause of ST-segment elevation during exercise and seems to be related to the presence of severe hypokinetic or akinetic LV segmental wall motion. Approximately 30% of subjects with anterior MI and 15% of subjects with inferior MI tested early after MI demonstrate exercise-induced ST segment elevation in Q-wave leads. The changes may result in reciprocal ST-segment depression that simulates myocardial ischemia in other leads. However, ST-segment elevation and depression in the same test may indicate multivessel CAD. Myocardial imaging techniques will help distinguish the concomitant presence of a new myocardial ischemic zone from reciprocal changes induced by ST-segment elevation in Q-wave leads.
ST Segment Elevation in Subjects Without Prior Infarction
In subjects without previous MI (absence of Q waves on the resting ECG), ST segment elevation during exercise fre-quently localizes the site of severe transient ischemia result-ing from significant proximal disease or spasm. In patients with active variant angina (⬎2 spontaneous episodes per week), exercise-induced ST segment elevation induced by coronary vasospasm has been reported in⬇30% of subjects. A reversible thallium-201 perfusion defect usually corre-sponds to the site of exercise-induced ST elevation. Ventric-ular arrhythmias during the test are more frequent in patients who demonstrate this response.
ST Segment Normalization or Absence of Change
Another manifestation of ischemia may be normalization of or no change in the ST segment related to cancellation effects, but this is nonspecific. ECG abnormalities at rest, including T wave inversion and ST segment depression, reportedly return to normal during attacks of angina and during exercise in some subjects with ischemic heart disease, but these findings can also be observed in subjects with a persistent juvenile pattern on the resting ECG. This cancellation effect is rare but should be considered as a cause of exercise-induced ST segment “normalization.”
Diagnostic Value of R Wave Changes
Many within-subject estimates of the variability of R wave amplitude changes during exercise in normal subjects have been reported. However, the average response in normal subjects is an increase in R wave amplitude during submaxi-mal exercise, with a decline at maximum exercise. Exercise-induced changes in R wave amplitude have not improved diagnostic accuracy, despite use of several lead systems, clinical subsets of subjects, and different criteria for an abnormal response.
T Wave Changes
The morphology of the T wave is influenced by body position, respiration, hyperventilation, drug therapy, and myocardial ischemia/necrosis. In patient populations with a low CAD prevalence, normalization of inverted T waves with exercise is a nondiagnostic finding.
U Wave Changes
U wave inversion is associated with LV hypertrophy, CAD, and aortic and mitral regurgitation. These conditions are associated with abnormal LV distensibility. Exercise-induced U wave inversion in subjects with a normal resting ECG seems to be a marker of myocardial ischemia and suggests left anterior descending CAD.
ST/Heart Rate Index and Slope
Heart rate adjustment of ST segment depression seems to improve the sensitivity of the exercise test, particularly the prediction of multivessel coronary disease, but this has not been consistently observed.24,25Calculation of maximal ST/
heart rate slope in millivolts per beats per minute is performed by linear regression analysis relating the measured amount of ST segment depression in individual leads to the heart rate at the end of each stage of exercise, starting at end exercise. An
ST/heart rate slope⬎2.4 mV · beats–1
· min–1
is considered abnormal, and values⬎6 mV · beats–1
· min–1
are suggestive of 3-vessel coronary disease. The use of this measurement requires modification of the exercise protocol such that increments in heart rate are gradual, as opposed to more abrupt increases in heart rate between stages, which limit the ability to calculate statistically valid ST segment/heart rate slopes. The measurement is not accurate in the early phase after infarction. A modification of the ST segment/heart rate slope method is the ST segment/heart rate index calculation, which represents the average changes of ST segment depres-sion with heart rate throughout the course of the exercise test. The ST/heart rate index measurements are less than the ST/heart rate slope measurements, and an ST/heart rate index of 1.6 is defined as abnormal.25
Stress Testing With Imaging Modalities
The addition of various imaging techniques to exercise is particularly useful when the resting ECG has baseline abnor-malities (eg, left bundle-branch block or resting ST depres-sion ⬎1 mm) that limit the accurate interpretation of the exercise ECG. Imaging also provides information regarding the location of ischemic myocardium and the size of the “territory” at risk. Exercise or pharmacological stress imaging studies provide greater diagnostic accuracy than exercise ECG alone and are particularly useful when the results of the exercise ECG are equivocal or indeterminate. Details regard-ing stress testregard-ing usregard-ing imagregard-ing modalities are found in the “ACC/AHA Guidelines for the Clinical Application of Echo-cardiography”26and the “ACC/AHA Guidelines for Clinical
Use of Cardiac Radionuclide Imaging.”27 Exercise Echocardiography
Echocardiographic images at rest are compared with those obtained while the patient performs stationary cycling or those obtained immediately after treadmill exercise. Images must be obtained within 1 to 2 minutes (preferably ⬍1 minute) after exercise, because abnormal wall motion begins to normalize after this point. Rest and stress images are compared side by side in a cineloop display that is gated (ie, synchronized) to the QRS complex. Myocardial contractility normally increases with exercise, whereas ischemia causes hypokinesis, akinesis, or dyskinesis of the affected segments. A test is considered positive if wall motion abnormalities develop with exercise in previously normal territories or worsen in an already abnormal segment.26The overall
sensi-tivity of exercise echocardiography for detecting CAD ranges from 71% to 97%, with greater sensitivities in multivessel disease. The specificity ranges from 64% to 100%.26Patients
with a normal exercise echocardiogram have a low risk for future cardiac events, including revascularization procedures, MI, or cardiac death. Complications during exercise echocar-diography are no different from those during exercise ECG testing, because the echocardiography procedure itself has no known risks.
Exercise Nuclear Imaging
Exercise tests with nuclear imaging use myocardial perfusion imaging agents, such as thallium-201, technetium (Tc)-99m
sestamibi, or tetrofosmin, which are injected 1 minute before the end of exercise. Images are subsequently obtained at 15 minutes for thallium 201 and at 15 to 60 minutes after exercise for Tc-99m sestamibi. Tc agents can be used with a rest/stress protocol or a stress/rest protocol. Tc-99m sestamibi offers several advantages over thallium. Sestamibi has a half-life of 6 hours, compared with 73 hours for thallium, and it also has a higher photon energy. This shorter half-life enables the injection of a higher isotope dose, resulting in improved image quality with greater resolution and less attenuation. Another unique property of Tc-based agents is the lack of redistribution. As such, images may be obtained for up to 4 hours after injection. Cardiac images are usually displayed in tomographic slices from 3 different axes: the short axis, vertical long axis, and horizontal long axis. This allows visualization of the heart in 3 dimensions so that multiple myocardial segments can be viewed individually, without the overlap of segments that occurs with planar imaging.27Perfusion defects that are present during exercise
but not seen at rest indicate myocardial ischemia. Perfusion defects that are present during exercise and persist at rest suggest previous MI.
Exercise with Tc99m sestamibi imaging has shown an accuracy similar to that of exercise with thallium-201 imag-ing in the detection of myocardial ischemia. For planar imaging, the sensitivity and specificity of Tc99m sestamibi have been measured at 84% and 83%, compared with 83% and 88% for thallium; for single photon emission computer-ized tomography (SPECT) imaging, they were 90% and 93%, respectively, compared with 89% and 76% for thallium. The greater specificity of Tc99m perfusion imaging is primarily due to less soft-tissue and diaphragmatic attenuation. The overall segment agreement with Tc99m sestamibi and thallium-201 is 88% with planar and 92% with SPECT imaging.27
Pharmacological Stress Testing
Pharmacological agents can be used to increase cardiac work in lieu of exercise or cause coronary arterial vasodilation to increase myocardial blood flow. Patients unable to undergo exercise stress testing for reasons such as deconditioning, peripheral vascular disease, orthopedic disabilities, neurolog-ical disease, and concomitant illness can often benefit from pharmacological stress imaging procedures. Indications for these tests include establishing a diagnosis of CAD, deter-mining myocardial viability before revascularization, assess-ing prognosis after MI or in chronic angina, and evaluatassess-ing cardiac risk before noncardiac surgery.
Adrenergic agents such as dobutamine increase myocardial contractility, heart rate, and blood pressure. Dobutamine is infused intravenously starting at 5g · kg–1
· min–1
, increasing to 10 g · kg–1 · min–1 and, if tolerated, increased every 3
minutes thereafter by 10g · kg–1
· min–1
until a maximal dose of 40 to 50 g · kg–1
· min–1
is reached or an end point is achieved. Target heart rate is 85% of the age-predicted maximal value or 70% for submaximal stress. For myocardial perfusion imaging, the radioisotope is injected at peak dobu-tamine dose. Dobudobu-tamine infusion is then continued for 1 minute after injection. End points include new or worsening
wall motion abnormalities, adequate heart rate response, worsening arrhythmia, moderate angina, intolerable side ef-fects, and significant increase or decrease in blood pressure. Up to 1 mg of intravenous atropine may be given if an adequate heart rate is not achieved or other end points have not been reached with dobutamine infusion. ECG, heart rate, and blood pressure are monitored during each stage.26,28
Echocardiographic images are obtained throughout with ECG gating and are then displayed in a quad-screen format allowing side-by-side comparison of baseline, low-dose do-butamine, peak dodo-butamine, and recovery images. A new or worsening wall motion abnormality constitutes a positive test.26 Dobutamine stress echocardiography has a reported
sensitivity of 67% to 97%26(average, 80%)29and specificity
of 65% to 100%26(average, 84%)29for the detection of CAD.
Complications during dobutamine infusion include nausea, headache, tremor, anxiety, angina and atypical chest pain, atrial and ventricular arrhythmias, and hypertension or hypotension.28
Vasodilators such as adenosine or dipyridamole can also be used to assess coronary perfusion during nuclear imaging or, less often, during echocardiography. These agents cause maximal coronary vasodilation in normal epicardial arteries. Due to autoregulation, arteries with stenoses recruit vasodi-lator reserve to maintain flow at rest and may even be maximally dilated at rest; therefore, they do not increase flow normally when vasodilators are given. The radioisotope is injected at peak vasodilator infusion and images are obtained at 15 minutes for thallium-201 and 1 hour later for Tc99m agents. Side effects include flushing, chest pain, headache, nausea, dyspnea, and atrioventricular (AV) block, which can be reversed with aminophylline.27Due to the short half-life of
adenosine, side effects usually resolve with termination of the infusion. Vasodilator agents should not be used in patients with second- or third-degree AV block (without permanent pacemakers) and in patients with a bronchospastic disease such as asthma or severe chronic obstructive lung disease.27
Notably, nuclear perfusion imaging with vasodilator agents is preferred over exercise perfusion imaging for the diagnosis of CAD in patients with left bundle branch block on resting ECG,27,30 because septal perfusion defects can occur in
patients with normal coronary arteries and left bundle branch block.
Diagnostic Value of the Exercise Test
Sensitivity and SpecificitySensitivity and specificity define how effectively a test separates subjects with disease from healthy individuals (ie, how well a test diagnoses disease). Sensitivity is the percent-age of those individuals with a disease who will have abnormal tests. Sensitivity is influenced by disease severity, effort level, and anti-ischemic drugs. Specificity is the per-centage of those without the disease who will have normal test results, and it may be affected by drugs such as digoxin, baseline ECG patterns, and LV hypertrophy. Sensitivity and specificity are inversely related; when sensitivity is the highest, specificity is lowest and vice versa. All tests have a range of inversely related sensitivities and specificities that
can be selected by specifying a discriminant or diagnostic cut point.
The choice of a discriminant value is further complicated by the fact that some exercise test responses do not have established values that separate normal subjects from those with disease. Once a discriminant value that determines a test’s specificity and sensitivity is chosen, the population tested must be considered. If the population is skewed toward individuals with a greater severity of disease, the test will have a higher sensitivity. For instance, the exercise test has a higher sensitivity in individuals with triple-vessel disease than in those with single-vessel disease. A test can also have a lower specificity if it is used in individuals who are more likely to have false-positive results. Sensitivity and specificity of exercise-induced ST segment depression can be deter-mined by comparing the results of exercise testing and coronary angiography.31From these studies, it can be seen
that the exercise test cut point of 0.1 mV (1 mm) of horizontal or downsloping ST segment depression has⬇84% specificity for angiographically significant CAD; ie, 84% of those without significant angiographic disease had a normal exer-cise test. These studies had a mean sensitivity of 66% for significant angiographic CAD, with a range of 40% to 90% for 1-vessel disease to 3-vessel disease.
Relative Risk and Predictive Value
Relative risk and predictive value help define the diagnostic value of a test (Glossary). The predictive value of a test is greatly influenced by the prevalence of disease in the group (or individual) being tested. Bayes’ theorem states that the probability of a person having the disease after the test is performed is the product of the probability of disease before testing and the probability that the test provided a true result. For example, an exercise ECG that demonstrates ST depres-sion in a young asymptomatic person without cardiac risk factors is most likely a false-positive result. Conversely, exercise-induced ST depression in an elderly person with typical anginal symptoms is most likely a true positive result.
Women
Exercise testing has the same characteristics in women with an intermediate probability of CAD as it does for men. In calculating the probability of CAD as determined by age and symptoms, women usually reach intermediate probability 10 years later than men.3In a series of 976 symptomatic women
referred for exercise testing and coronary angiography, a low, moderate, and high risk Duke treadmill score (a method of estimating cardiovascular prognosis) was associated with CAD (⬎75% luminal narrowing) in 19.1%, 34.9%, and 89.2% of women, respectively.32The frequency of 3-vessel
disease or left main coronary disease was 3.5%, 12.4%, and 46%, respectively. In a retrospective population-based cohort study of 741 women, exercise-induced angina, ischemic ECG changes, and workload were strongly associated with all-cause mortality and cardiac events. The 2-year cardiac mor-tality rates in 976 women with low, moderate, and high risk Duke treadmill scores were 1%, 2.2%, and 3.6%, respective-ly.32Thus, in women with established CAD, exercise testing
provides diagnostic and prognostic information, particularly when scores are used.3
Intracardiac Conduction Blocks
Intraventricular Blocks
Intracardiac conduction blocks can exist before exercise or develop or disappear during exercise. Rate-dependent intra-ventricular blocks that develop during exercise often precede the appearance of chronic blocks that develop later at rest.33–35Diagnosis of myocardial ischemia from the exercise
ECG is usually impossible when left bundle branch block is present. There can be a marked degree of exercise-induced ST segment depression in addition to that found at rest in normal subjects with left bundle branch block. There is no difference in ST segment response to exercise between those with and those without myocardial ischemia. Left bundle branch block that occurs at a heart rate⬍125 beats/min in subjects with typical angina is frequently associated with CAD, whereas left bundle branch block occurring at a heart rateⱖ125 beats/min occurs more frequently in subjects with normal coronary arteries. The presence of intraventricular blocks at rest that disappear during exercise is rare. Subjects with left bundle branch block who develop a normal QRS pattern during exercise have been reported. Preexisting right bundle branch block35–39does not influence interpretation of
the exercise test, except in the anterior precordial leads (V1,
V2, and V3), where ST depression is frequently present at
baseline.
Intraventricular Blocks During Exercise
In addition to left or right bundle branch block, left anterior or posterior hemiblock and bifascicular block (a combination of right bundle branch block and left anterior or posterior hemiblock) may be induced with exercise. The presence of such blocks is primarily a rate-related phenomenon that occurs during exercise as the sinus rate increases beyond a critical point. Intraventricular blocks may be difficult to distinguish from ventricular tachycardia.
Conduction Abnormalities
AV Conduction
Shortening of the PR interval (by as much as 0.10 or 0.11 seconds) during exercise as the sinus rate increases is normal, probably because of increased sympathetic tone and vagal withdrawal, such as usually occurs in young, healthy individuals.
First-Degree AV Block
First-degree AV block occurs occasionally at the end of exercise or during the recovery phase. Medications or condi-tions that may produce prolonged AV conduction time (eg, digitalis, propranolol, verapamil, and myocarditis) predispose the individual to lengthening of the PR interval.
Second-Degree AV Block
The occurrence of Wenckebach-Mobitz type I AV block during exercise is rare. The clinical significance of exercise-induced Mobitz type II AV block is not known, but the type II block may also be a rate-related phenomenon that appears as the sinus rate is accelerated beyond a critical level.
However, it may reflect more critical underlying conduction system disease, and if second-degree AV block develops with testing, the test should be terminated.
Complete AV Block
Acquired complete AV block at rest is a relative contraindi-cation to exercise testing. Exercise testing can be conducted in subjects with congenital complete AV block if there are no coexisting significant congenital anomalies.
Sinus Arrest
Rarely, subjects develop long periods of sinus arrest imme-diately after exercise. Sinus arrest usually occurs in subjects with severe ischemic heart disease.
Preexcitation Syndromes
Exercise may provoke, abolish, or have no effect on anoma-lous AV conduction in individuals with known Wolff-Parkinson-White (WPW) syndrome.40 When exercise does
not interfere with preexisting anomalous AV conduction, significant ST depression can be observed during exercise testing. In the presence of WPW syndrome, the ST depression may not be due to ischemia but may instead be a false-positive (indeterminate) occurrence. Although exercise has been considered a predisposing factor to initiate tachyarrhythmia in WPW syndrome, there is a low preva-lence of tachyarrhythmias during or after exercise in WPW subjects.
Cardiac Arrhythmias
Exercise may induce cardiac arrhythmias under several con-ditions, including diuretic and digitalis therapy.41– 43Recent
ingestion of alcohol or caffeine may exacerbate arrhythmias. Because exercise increases myocardial oxygen demand, in the presence of CAD, exercise-induced myocardial ischemia could predispose the subject to ectopic activity. It seems that ischemia with ST depression is not as arrhythmogenic as ischemia with ST elevation. Exercise-induced arrhythmias are generated by enhanced sympathetic tone, increased myo-cardial oxygen demand, or both. The period immediately after exercise is particularly dangerous because of the high catecholamine levels that are associated with generalized vasodilation. Peripheral arterial dilation induced by exercise and reduced cardiac output, resulting from diminished venous return secondary to sudden termination of muscular activity, may lead to a reduction in coronary perfusion in early recovery while the heart rate is still elevated. The increased sympathetic tone in the myocardium may stimulate ectopic Purkinje pacemaker activity by accelerating phase 4 of the action potential, which provokes spontaneous discharge and leads to increased automaticity.
Exercise can suppress cardiac arrhythmias present at rest. This phenomenon has been attributed to the overdrive sup-pression of the ectopic impulse formation by sinus tachycardia that is caused by exercise-induced vagal with-drawal and increased sympathetic stimulation. Exercise-induced sinus tachycardia may inhibit automaticity of an ectopic focus because it “overrides” automaticity of the Purkinje tissue.
Ectopic ventricular beats are the most frequent cardiac arrhythmia during exercise, followed by supraventricular arrhythmias and fusion beats. Their prevalence is directly related to age and cardiac abnormalities. In general, ectopic ventricular beats are of concern in subjects with a family history of sudden death or a personal history of cardiomyop-athy, valvular heart disease, or severe myocardial ischemia.
Sinus arrhythmias with periods of sinus bradycardia and wandering atrial pacemaker are relatively common during early exercise and the immediate recovery phase. Atrial ectopic contractions and atrial “group” beats can occur in either normal or diseased hearts. Exercise-induced transient atrial fibrillation and flutter occur in⬍1% of individuals who undergo exercise testing.44 These arrhythmias may be
in-duced by exercise in healthy individuals or subjects with rheumatic heart disease, hyperthyroidism, WPW syndrome, or cardiomyopathy. Paroxysmal AV junctional tachycardia is observed during exercise only rarely. Exercise-induced su-praventricular arrhythmias alone are not usually related to CAD but are more often related to older age, pulmonary disease, recent alcohol ingestion, or excessive caffeine intake.
Special Cases of Exercise Testing Interpretation
Heart Failure
Recent studies have proven that exercise testing is not only safe in the population of patients with heart failure, but also adds significant clinical information to the care of these patients.45Although exercise capacity correlates poorly with
indices of resting ventricular function, the inability to perform aerobic activity is a powerful prognostic indicator. In fact, impaired exercise capacity, as measured using gas analysis (expired air), has revealed that a peak V˙O2ⱕ14 mL · kg–1·
min–1is associated with high mortality. In contrast, patients
with peak V˙O2values⬎14 mL · kg –1
· min–1
or⬎50% of the predicted value have a 1-year survival which is similar to that of the post-transplant population.46
Thus, gas exchange analysis is recommended when exer-cise testing is being used to measure exerexer-cise capacity in patients with heart failure. The protocol chosen for testing is less important when gas exchange measurements are coupled with exercise electrocardiography because these measure-ments are protocol-independent. Protocols for testing can be chosen depending on the physical status and capacity of the patient being tested. In general, protocols should be chosen that last⬇8 to 12 minutes to the peak of exercise. Shorter but more aggressive protocols may not allow sufficient time during exercise to adequately measure the full physiological response to exercise. In patients with chronic heart failure, the exercise testing procedures are similar to those of the other populations mentioned above.
Hypertension
There is evidence that an exaggerated blood pressure re-sponse with exercise testing is predictive of future hyperten-sion,47– 49may be predictive of future mortality from MI,50
and is associated with angiographic CAD.21
Cardiomyopathies
Exercise testing has been used in subjects with dilated cardiomyopathy to determine exercise capacity, assess