The effect of working capital management on profitability: The case of
Small Medium and Micro Enterprises in South Africa
Samuel Tabot ENOW
1, Pradeep BRIJLAL
2ABSTRACT:Working capital is vital in any business, especially in SMMEs, given that most of their assets are in the form of current assets. Management of working capital is vital in order to improve profitability of the business. This study investigated the effect working capital management on profitability, using fifteen South African SMMEs, listed on the Alt-X on the JSE, from 2008-2012, using a multiple regression analysis. The results show a positive relationship between number of days account receivable, number of day’s inventory and negative relationship between number of days payable and cash convention cycle. Thus minimizing working capital and decreasing the cash conversion cycle increases profitability and hence shareholder value.
Key words: working capital, cash conversion cycle, SMMEs, profitability.
INTRODUCTION
South Africa has endured many challenges of re-integration into the world market as a global economy, while at the same time positioning itself to realize the high expectation of its populace regarding a successful transition towards a more democratic order (Berry, Blottnitz, Cassim, Kesper, Rajaratnam and Seventer, 2002). Some of major challenges in South Africa include income redistribution, employment generation and economic growth. It is for this reason that Small Micro and Medium Sized Enterprise (hereafter referred to as SMMEs) were focuses upon by the South African Government in other to address the economic challenges of South Africa; particularly reducing the unemployment rate and poverty (Bruwer, 2010). According to World Business Council for sustainable development (2007), more than 90 percent of all firms outside the agricultural sector in developing countries are SMMEs, implying that SMMEs plays a vital role to addressing the problem of job creation, equity, poverty and economic growth in South Africa. SMMEs also play a vital role in economic growth by contributing to South Africa’s gross national product by either manufacturing valuable goods or through providing services to other enterprises and consumers, including foreign consumers, thereby contributing to overall performance of the economy (Berry, Blottnitz, Cassim, Kesper, Rajaratnam and Seventer, 2002)
SMMEs also play a crucial role in labour absorption; expand economies in innovative ways and market penetration. The stimulation of SMMEs must be seen as an integrated strategy to take the South African economy to a higher road (McGrath, 2005). Despite the above importance of SMMEs in South Africa, the failure rate of these businesses is alarming. According to Fatoki (2011) the failure rate of SMMEs in South Africa is between 70% to 80% in their first three years of operation. Prior research conducted in countries such as the United States of America (Koury, Smith & Mackay, 1998), Nigeria (Sunday, 2010) and Ghana (Yiadom & Agyei, 2006) reveal that the high failure rate of SMMEs is as a result of a lack of access to finances, a lack of access to equipment and tools, inadequate market conditions and the ineffective use of working capital management tools. From a
South African dispensation, Bruwer (2010) has singled out the ineffective use of financial management resources as a major cause of failure for SMMEs in the country. In turn, Nyamao, Patrick, Martin, Odondo and Simeyo (2012) express the view that SMMEs do not make effective use of working capital tools.
Working Capital deals with the firm’s short term financing that is current assets and current liabilities, therefore it is a measure of a firm’s liquidity. The goal of effective working capital management is to ensure that a company has adequate ready access to the funds necessary for day-to-day operating expenses, while at the same time making sure that the company’s assets are invested in the most productive way (Norton, Parkinson and Drake, 2011). Efficient working capital management involves planning and controlling current assets and current liabilities in a manner that eliminates the risk of inability to meet due short term obligations on the one hand and avoid excessive investment in these assets on the other hand (Eljelly, 2004). The management of working capital is particularly important in SMMEs as their assets are mostly in the form of current assets (Petersen and Rajan, 2007). Also current liabilities are identified as one of their main sources of external finance, due to SMMEs encountering difficulties in obtaining funding in the long term capital markets and have limited finance to fund supplies (Whited, 1992; Fazzari and Petersen, 1993).
Working capital management may differ between small and large businesses. Small businesses have fewer alternatives sources of external finance available, which make them more dependent on short-term finance in general and on trade credit in particular.
Considering the fact that the failure rate of SMMEs is high in the early stages of operation and one of the main reasons cited was the ineffective management of working capital, this study therefore investigates the effect of working capital management on the profitability of SMMEs. Hence the following objectives were formulated to achieve the aim of the study.
To investigate the relationship between working capital management and profitability over a period of five year using 15 South African SMMEs from Alt-X index of the JSE (Johannesburg Securities Exchange) of South Africa
To investigate the effect of the various components of working capital management profitability.
To draw conclusion on relationship between working capital management and its components on profitability.
LITERATURE REVIEW
Various studies have analyzed the relationship of working capital management and firm profitability in various markets, especially in the developed markets. The results are quite mixed, but a majority of studies conclude a negative relationship between working capital management and business profitability. The studies reviewed have used various variables to analyze the relationship, with different methodology such as linear regression and panel data regression. In this section, we have presented the chronology of major studies related to our study in order to assess and identify the research gap.
Deloof (2003) that investigated the relation between working capital management and corporate profitability for a sample of 1,009 large Belgian non-financial firms for the 1992–1996 periods, using the cash conversion cycle as a measure for working capital management. It was found that, a firm can increase its profitability by decreasing cash convention cycle.
A similar research was conducted by Padachi (2006) to examine the trend of working capital and its impact on performance on Mauritian firms. The return on total asset (ROTA) was used as a dependent variable to measure profitability and the relationship between working capital management and
corporate profitability was tested for associations. Padachi used a sample of 58 small manufacturing firms, using panel data analysis for the period 1998 –2003, in which inventories days, accounts receivables days, accounts payable days and cash conversion cycle were used as variables of working capital management. The results show a negative correlation between inventories days, accounts receivables and profitability. This implies that working capital and profitability are inversely correlated. Increasing working capital will decrease profitability.
Similarly, in attempt to investigate the relation between working capital management and profitability, Racheman and Nasr (2007) selected a sample of 94 Pakistani firms listed on Karachi Stock Exchange for a period of 6 years from 1999 – 2004 and studied the effect of different variables of working capital management which were average collection period, inventory turnover in days, average payment period, cash conversion cycle and current ratio on the net operating profitability of Pakistani firms. The researchers used debt ratio, size of the firm (measured in terms of natural logarithm of sales) and financial assets to total assets ratio were used has control variables. The regression analysis used showed a negative relationship between variables of the working capital management and profitability of the firm.In other words, decreasing cash convention cycle will increase profitability of firm. Racheman and Nasr (2007) thus conclude that managers can maximize shareholders’ value by decreasing cash convention cycle of the firm.
The study of Truel and Solano (2007) used 8 872 Spanish small to medium sized enterprises (SMEs) during a period 1996 to 2005 to investigate the empirical evidence about the effects of working capital management on profitability. The results indicated that, reducing cash convention cycle improves profitability. Also, shortening SMEs inventories and the number of days of which their accounts are outstanding will increases profitability.
Zariyawati, Annuar and Rahim (2009) investigated the relationship between working capital management and profitability of Malaysian firms, using cash conversion cycle as a measure of working capital management. The researchers used panel data of 1628 firm-year for the period of 1996-2006 from six different economic sectors which were listed in Bursa, Malaysia. Their findings revealed that the coefficient results of regression analysis provided a strong negative significant relationship between cash conversion cycle and firm profitability. Therefore, a firm’s manager can increase profitability by reducing cash convention cycle.
Falope and Ajilore (2009) studied the effects of working capital management on profitability performance for a panel made up of a sample of Nigerian quoted non- financial firms from 1996 to 2005.In the study, panel data econometrics in a pooled regression was used where time series and cross sectional observation were combined and estimated. The study concluded there exists a negative relationship between net operating profitability and the average collection period, inventory turnover days, average payment period and cash conversion cycle for a sample of fifty Nigerians firms listed in the Nigerian stock Exchange.
Gill, Biger and Mathur, (2010) extended the findings of Lazaridis and Tryfonidis’s regarding the relationship between working capital management and profitability of American firms which a sample of 88 American firms listed on New York Stock Exchange for a period of 3 years from 2005 to 2007. Cash convention cycle was used as a measure of working capital and they used gross operating profit as a measure of profitability. It was found that, there is significant relationship between the cash conversion cycle and profitability. The researchers concluded that, managers can create profits for their companies by handling correctly the cash conversion cycle and by keeping accounts receivables at an optimal level.
In other study by Ali and Hassan (2010) using a sample of 37 listed companies on OMX Stockholm stock exchange during a period of 2004 to 2008 to investigate the relationship between working capital policy and profitability of Swedish firms. Cash convention cycle and gross profit were used to measure the aggressiveness of working capital management and profitability respectively. In this
study, six regressions analysis where tested on 185 observations which showed that managers cannot increase profitability by adopting a relaxed working management capital policy.
Literature shows that profitability is increased if he cash conversion cycle and working capital are reduced. The studies in this area were conducted using large businesses. This study focused on small businesses, particularly, to establish if the results of prior research on large businesses apply to SMMEs. There is, however, limited empirical evidence available regarding the relationship of working capital management and profitability of South African SMMEs. In this context, the objective of the current study is to provide empirical evidences about the effect of working capital management on profitability for a sample of 15 medium size South African SMMEs during the period 2008–2012. This study is believed to be among the first few to trace the relationship between WCM and profitability of medium size businesses listed on the Alt-X of the JSE.
RESEARCH DESIGN
The study used data from the financial statements of 15 businesses listed on the AltX (alternative exchange) of the JSE. The AltX is a division of the JSE Limited. It is a parallel market focused on good quality, small and medium sized high growth companies. AltX provides smaller companies not yet able to list on the JSE Main Board with a clear growth path and access to capital. AltX has been developed for entrepreneurs who run a high growth small or medium size business. These businesses have typically applied to the banking sector for financial capital and have been denied credit.
Due to the nature of the research question, only secondary data were used in this study. Secondary data was obtained from AltX and the web sites of different firms. The data were retrieved from the annual audited financial statements of each firm, which was the income statement and balance sheet. The financial statements covered a period of five years from 2008 to 2012. This range was chosen because the most recent data is available.
Firms without data for number of days of inventory, number of days of account receivable, number of days of account payables, net income after tax, total asset and total equity were excluded from the study, hence the small number of businesses.
Given that the aim of this study is to investigate the effect of working capital on profitability of firms, the study l adopted the following regression equations that were also used by Sharma and Kumar (2011), Nazir and Afza (2009), Zariyawati et al. (2008), Samiloglu and Demirgunes (2008), and Terual and Solano (2007).
ROAit=β0+β1GROWTHit +β2LEVit+β3CRit+β4 SIZEit+β5INVit + ξit (1)
ROAit=β0+β1GROWTHit +β2LEVit+β3CRit+β4 SIZEit+β5ARit + ξit (2)
ROAit=β0+β1GROWTHit +β2LEVit+β3CRit+β4 SIZEit+β5APit + ξit (3)
ROAit=β0+β1GROWTHit +β2LEVit+β3CRit+β4 SIZEit+β5CCCit +ξit (4)
Profitability was measured by return on assets (ROA) which is defined as the ratio of earnings before interest and tax to total assets. ROA was used as the dependent variable which was also used by Sharma and Kumar (2011), Nazir and Afza (2009), Samiloglu and Demirgunes (2008),and Terual and Solano (2007).
In this study, the different variables that were used as a measure of working capital are: Average collection period (ACP), derived by dividing account receivable to sales multiplied by 365. It is used for evaluating collection and credit policies. Average payment period (APP) was calculated by dividing accounts payables to purchases or cost of goods sold and multiplied by 365. It is used to evaluate payment policy. Average age of inventory (AAI) also known has inventory turnover (days) which is used to measure a firm’s liquidity or activity and derived by dividing inventory by cost of
goods sold and multiplied by 365. Cash convention cycle (CCC) was calculated by adding average collection period to average age inventory and subtracting average payment period. It was used as an independent variable and a comprehensive measure of working capital. Lower CCC signifies better working capital policies and high liquidity because of lesser investment in current assets which translates to lesser need for financing current assets.
The study also used firms size (SIZE) given by natural logarithm of assets (ln total assets), sales growth (Growth) calculated as (Sales (1) - Sales (0)/Sales (0)), leverage (LEV) calculated as (total debt divided by total assets), and current ratio (CR) calculated as the ratio of current assets to current liability as control variables. These control variables were also used by Deloof (2003), Garcia-Teruel and Martinez-Solano (2007), Nazir and Afza (2009), Raheman and Nasr (2007), Shin and Soenen (1998), Wang (2002) Zariyawatiet al,(2009) and Sharma and Kumar (2011).
Due to the nature of the data which is quantitative in nature, a statistical tool like SPSS which is consistent with the research strategy was used to analyse the data. Table I shows the descriptive statistics for 15 SMMEs operating in South African from period of 2008 to 2012.
RESULTS AND DISCUSSION
The descriptive statistics (Table 1) shows that, the mean value of return on asset is 35.5% with standard deviation of 18.8%. This implies that, values of ROA can deviate on both sides by 35.5%. The number of accounts receivables is 92 days and number of days of accounts payable is 89 days. Moreover, the cash conversion cycle for these enterprises was 46 days with annual sales growth of 16.3 per cent annually on average and the current ratio is 2.6.
Table 1
.
Descriptive statistics
Descriptive
ROA No AR No AP No INV CCC SIZE GROWTH CR LEV
Mean 0.355611 92.00074 89.79113 85.05303 56.51792 1.235954 1.638253 2.600177 15.95423
Median 0.152652 46.6115 61.13073 64.75523 5.975663 0.14299 1.082316 2.230478 0.463401
S. D 1.881795 142.9988 82.21693 246.4354 150.6414 2.041102 1.811482 1.525218 117.5693
Minimum -4.33701 0.254103 21.58633 -237.718 -21.6147 -8.41143 -0.75848 0.626057 0.025186
Maximum 15.06599 627.1846 552.7143 2027.755 639.374 4.290747 7.369044 7.369044 980.9853
Pearson’s Correlation analysis was used for data to establish if there were relationship between variables such as those between working capital management and profitability. If efficient working capital management increases profitability, one should expect a negative relationship between the measures of working capital management and profitability variable. There is a negative relationship between gross profitability on the
one hand and the measures of working capital management on the other hand. This is consistent with the view that the time lag between expenditure for purchases of raw material and the collection of sales of finished goods can be too long, and that
decreasing this time lag increases profitability. Table 2 presents Pearson correlation coefficients for all variables considered.
Table 2
. Correlation analysis of the variables.
ROA NoAR NoAP NoINV CCC SIZE GROWTH CR LEV
ROA 1 NoAR -0.032 1 NoAP -0.088 -0.028 1 NoINV 0.02 -0.063 .569** 1 CCC -0.032 .965** -0.091 -0.021 1 SIZE -0.017 .351** -.354** -.505** .419** 1 GROWTH -0.066 -.248* -0.022 -0.102 -.323** -.514** 1 CR -0.133 0.205 -0.095 -0.139 0.229 0.123 .615** 1 LEV 0.916** -0.053 -0.081 0.035 -0.048 -0.049 -0.064 -0.161 1
** Correlation is significant at the 0.01 level (2-tailed). * Correlation is significant at the 0.05 level (2-tailed).
The results of correlation matrix of dependent and independent variables in order to check for multicollinearity. Given that the highest correlation coefficient is 0.965 between cash convention cycle and number of day’s accounts receivable, the data needs to be further analysed to confirm the presence of multicollinearity. Using the variance inflation factor (VIF), it was established that, the statistics are within the range. As a rule of thumb, the acceptable values of VIF should be less than 10 as cited by O’Brien (2007); Haire et al (1995); Marquardt (1970). In this study, the value of VIF ranges from 2 to 4 indicating that there is no severe case of multicollinearity as shown in the tables below.
Regression analysis was used for the purpose of identifying the important variables influencing the dependent variable. In panel data (pooled) regression, time –series and cross-sectional observations are combined and estimated.
Table 3 presents the estimation results for regression equation (1). The regression results show that there is a positive relationship between Inventory (0.046), growth (0.006), size (0.034), CR (0.008) and leverage (0.919) to return on asset. This means the higher the growth, CR, the bigger the SMMEs and the longer the number of days of inventory will result in higher profits. As with the studies of Padachi (2006); Deloof (2003); Raheman and Nasr (2007) which shows that the shorter the number of days of inventory the greater the profitability, this study presents a new insight in the South Africa context. Size and growth were considered as indicators of SMMEs performance and hence should be positively correlated to ROA as a rule of thumb. This findings were consistent with other international findings such as Magpayo (2007); Padachi (2006).
Table 3
. Results of regression equation (1)
Coefficient t-value VIF
NoINV 0.046 0.077 2.608 SIZE 0.034 0.275 6.025 GROWTH 0.006 0.045 7.203 CR 0.008 0.081 4.179 LEV 0.919 18.126 1.03 Adj R2 0.828 D-W stats 2.512
Table 4 presents the estimation results for regression equation (2). The regression estimates shows that there is a positive relationship between Inventory (0.006), growth (0.003), size (0.027), CR (0.009) and leverage (0.919) to return on asset. This implies that, increasing growth and CR will increase the size of SMMEs and the lengthening the number of days of account receivable will result in higher profits. This finding is consistent with conventional conjecture which states that increasing the number of days debtors take to settle their account will result in higher profits. Therefore, South African SMMEs can increase their profitability by lengthening the credit period to their customers. This result is consistent with the studies of Lazaridis and Tryfondis (2006); Deloof (2003); Raheman and Nasr (2007). Again Size and growth are positively correlated to ROA as a rule of thumb.
Table 4
. Results of regression equation (2)
Coefficient t-value VIF
SIZE 0.027 0.348 2.363 GROWTH 0.003 0.025 4.343 CR 0.009 0.101 3.36 LEV 0.919 18.137 1.029 NoAR 0.006 0.096 1.368 Adj R2 0.828 D-W Stats 2.511
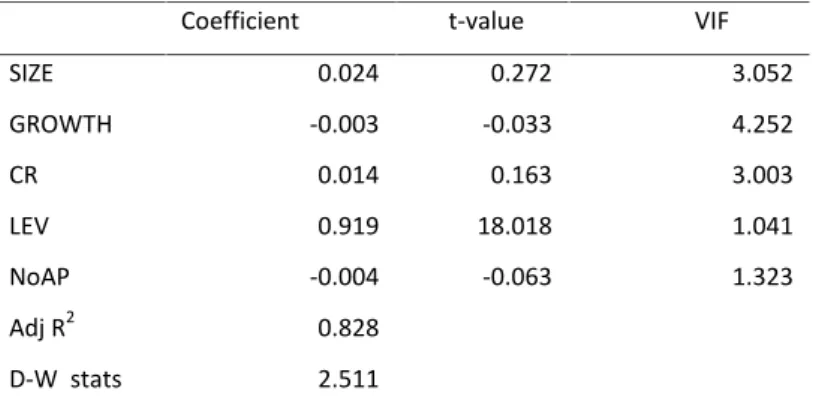
Table 5 presents the estimation results for regression equation (3). The regression estimates shows that there is a positive relationship between size (0.024), CR(0.014) and leverage(0.919) to return on asset, but a negative relationship between number of days account payable (-0.004) and return on asset. This result implies that, decreasing the time SMMEs takes to settle their creditors will increase their profitability. This result implies that paying off creditors which in most cases are suppliers earlier will enable suppliers to provide better products or services which will in turn increase the quality of products and services provided to customers and hence profitability. Sharma and Kumar (2011); Deloof (2003) justifies similar results.
Table 5
. Results of regression equation (3)
Coefficient t-value VIF
SIZE 0.024 0.272 3.052 GROWTH -0.003 -0.033 4.252 CR 0.014 0.163 3.003 LEV 0.919 18.018 1.041 NoAP -0.004 -0.063 1.323 Adj R2 0.828 D-W stats 2.511
Table 6 presents the estimation results for regression equation (4) which is the combined effect of equation (1), (2) and (3) . The regression estimates shows that there is a negative relationship between CCC (-0.004) and return on asset and positive relationship between size (0.026), CR (0.016) and leverage (0.919) to return on asset. This result shows that decreasing CCC will lead to higher profit which is consistent with the theory of corporate finance that shortening cash conversion cycle will increase profitability. This study present similar results to that of Padachi (2006); Falope and Ajilore (2011).
Table 6.
Results of regression equation (4)
Coefficient t-value VIF
SIZE 0.026 0.336 2.379 GROWTH -0.004 -0.04 4.966 CR 0.016 0.161 3.83 LEV 0.919 18.134 1.029 CCC -0.004 -0.059 1.678 Adj R 0.828 D-W stats 2.512
CONCLUSION
The purpose of this study was to investigate the effect working capital management on profitability using 15 South African SMMEs listed on the AltX of the JSE from the period 2008-2012 using a multiple regression analysis. The results shows a positive relationship between number of days account receivable, number of days inventory and negative relationship between number of days payable and cash convention cycle. From the above findings, South African managers can create value for their shareholders by decreasing the cash convention cycle. The results of this study are consistent with the study of Padachi (2006); Falope and Ajilore (2011); Deloof (2003). Further research should be conducted on a larger sample and large businesses and to establish if the working capital differs between these two size of businesses.
REFERENCES
Ali, W. U, S.H. (2010). Relationship between the profitability and working capital policy of Swedish companies. Master Thesis. Umea University.
Amarjit, G. Nahum, B., Neil M. (2010). The Relationship between Working Capital Management and Profitability.Business and Economics Journal.10
Berry, A. Blottnitz, M. Cassim, R. Kesper, A. Rajaratnam, B. and Seventer, D. (2002) “The Economics of SMME in South Africa”, Trade and Industrial Policy strategies.1-4.
Bruwer, J.P.(2010). Sustainability of South African FMCG SMME retail businesses in the Cape Peninsula. Dissertation submitted for MTech Internal Auditing. Cape Peninsula University of Technology.
Deloof, M. (2003). Does working capital management affect profitability of Belgian firms? .Journal of Business Finance and Accounting, 30: 573-588.
Eljelly, A. (2004). Liquidity-profitability tradeoff: an empirical investigation in an emerging market”.International Journal of Commerce and Management, 14: 48-61.
Falope, O.I. and Ajilore, O.T. (2009). Working capital management and corporate profitability.Research Journal of Business Management.73-84.
Fazzari, S.M. and Petersen, B. (1993), “Working capital and fixed investment: new evidence on financing constraints”, Rand Journal of Economics, (24). 328-42.
Garcia-Teruel PJ, Martinez-Solano PM, (2007). Effects of working capital management on SME profitability. International Journal of Managerial Finance, 3: 164-177.
Gill A, Biger N, Mathur N.( 2010). The relationship between working capital management and profitability: Evidence from the United States.Bus and Econ Journ,1: 1-9.
Gitman, L. J. (2003). Principles of Managerial Finance, 10th Ed. Boston. 598-599.
Lazaridis, I., & Tryfonidis, D. (2006). Relationship between Working Capital Management and Profitability of Listed Companies in the Athens Stock Exchange.Journal of Financial Management and Analysis, 19(1), 26-35.
Koury,N.T., Smith,K.V. & Mackay,P.I. (1998). Comparing working capital practices in Canada, the United states, and Australia. Purdue CIBER working papers. Paper 132.
Marquardt, D. W. (1970). Generalized inverses, ridge regression, biased linear estimation, and nonlinear estimation. Technometrics12: 591–256.
Nazir, M.S., & Afza, T. (2009). Working capital requirements and the determining factors in Pakistan. ICFAI Journal of Applied Finance,15(4), 28–38.
Norton, A., Parkinson, K.L, Drake, P.P. (2011). Corporate Finance and Portfolio Management. CFA program curriculum. Volume 4. 157.
Nyamao, N.R., Patrick, O., Martin, L., Odondo & Simeyo, O.A.J. (2012). Effect of working capital management practises on financial performance: A study of Small scale enterprises in Kisii South District, Kenya. African Journal of Business Management. 6(18): 5807-5817.
McGraths. 2005. Skills development in very small and micro enterprises.
Norton, A. Parkinson, K.L, Drake, P.P.( 2011). Corporate Finance and Portfolio Management. CFA program curriculum. (4)157.
O’brien, R. (2007). A Caution regarding rules of thumb for Variance Inflation factors. Quality &Quantity. 41: 673-690. Padachi, K. (2006).Trends in Working Capital Management and its Impact on Firms’ Performance.International Review of Business Research Papers.(2).45 -58.
Petersen, M.A. and Rajan, R.G. (1997).Trade credit: theories and evidence.Review of Financial Studies. (10) 661-91. Raheman, A. and Nasr, M. (2007). Working capital management and profitability – case of Pakistani firms.International Review of Business Research Papers.(3)279-300.
Rao, R. K. S. (1989). Fundamentals of Financial Management, 3rd Ed. Macmillan publishers, 550-644.
Samiloglu, F., & Demirgunes, K. (2008) . The effect of working capital management on firm profitability: Evidence from Turkey.The International Journal of Applied Economics and Finance,2(1), 44–50.
Saunders, M. Lewis, P. (2000), Research Methods for Business Student, Second Edition, Prentice Hall.
Saunders, M. Lewis, P. Thornhil, A. (2003), Research Methods for Business Student, Third Edition, Prentice Hall.
Shin, H. H., & Soenen, L. (1998). Efficiency of working capital management and corporate profitability.Financial Practice and Education,8(2), 37-45.
Sunday, K.J. (2011). Effective working capital management in small and medium scale Enterprises. International Journal of Business and management. 6(9):217.
Teruel, P. and Solano.p. (2007). Effects of working capital management on SME profitability. International journal of Managerial Finance, 3: 164-177.
Viyakumar, A.(2001). Working Capital Management, a comparative study. New Delhi.
Wang, W. (2002). Liquidity management, operating performance and corporate value: evidence from Japan and Taiwan. Journal of Multinational Financial Management, 12: 159-169.
Welman,C. Kruger,F. & Mitchell, B.(2004). Research Methodology.South Africa. Oxford University Press.
Whited, T.M. (1992). Debt, liquidity constraints, and corporate investment: evidence from panel data”, Journal of Finance. (47) 1425-60.
World Business council for sustainable Development .(2004). Promoting SMEs for sustainable development.Pp.2.
Yiadom, E.M. & Agyei, S.K. (2006). Working Capital Management practices of Small scale Enterprises in the central region of Ghana.Asian Journal of Business and Management Science. (4 ):29-47.
Zariyawati, M.A, Annuar, M.N., & Abdul Rahim A.S. (2009). Effect of working capital management on profitability of firms in Malaysia. Paper presented in International Symposium on Finance and Accounting (ISFA), 6–8 July,Malaysia. Retrieved from list.academic-journal.org/submissions/isfa2009_submission_13.doc (accessed on15 August 2009).