For application assistance or additional information on our products or services you can contact us at:
ILX Lightwave Corporation
31950 Frontage Road, Bozeman, MT 59715 Phone: 406-556-2481 800-459-9459 Fax: 406-586-9405
Email: sales@ilxlightwave.com
To obtain contact information for our international distributors and product repair centers or for fast access to product information, technical support, LabVIEW drivers, and our comprehensive library of technical and application information, visit our website at:
www.ilxlightwave.com
#
4
Thermistor Calibration and the
Thermistors provide an inexpensive and accurate temperature monitor for use with laser diodes. The nonlinear resistance-temperature characteristics of a Negative-Temperature Coeffi cient (NTC) thermistor may be modeled to a high degree of accuracy using the Steinhart-Hart equation, LaGrange polynomials, or other modeling techniques. Figure 1 shows a common R-T relation curve for a 10k NTC thermistor.
In 1968, Steinhart and Hart developed a model for thermistor R-T characteristics in order to make accurate temperature measure-ments for oceanic studies. Today, the most popular model for R-T characterization is the Steinhart-Hart equation.
This publication describes two methods for calibrating thermistors using the Steinhart-Hart equation; the fi rst method may be used with the ILX Lightwave Model LDT-5948 and LDT-59801 Temperature Controllers, or any
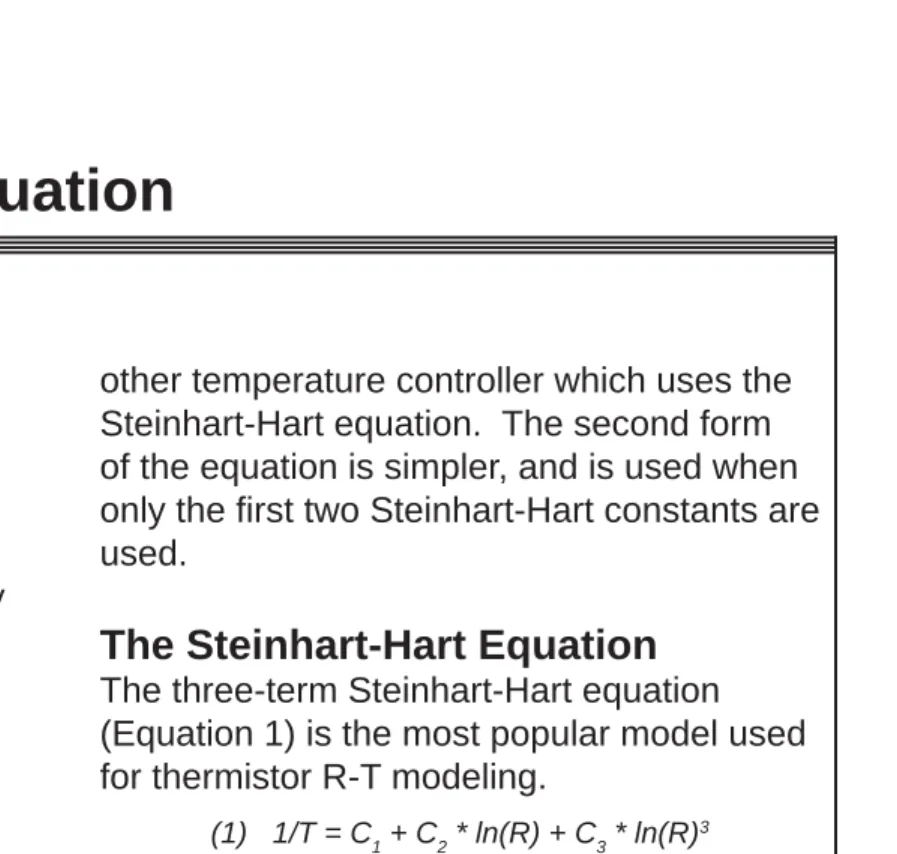
other temperature controller which uses the Steinhart-Hart equation. The second form of the equation is simpler, and is used when only the fi rst two Steinhart-Hart constants are used.
The Steinhart-Hart Equation
The three-term Steinhart-Hart equation (Equation 1) is the most popular model used for thermistor R-T modeling.
(1) 1/T = C1 + C2 * ln(R) + C3 * ln(R)3
Where T is the absolute temperature in Kelvin and R is the thermistor resistance in ohms. The terms C1, C2, and C3 are the Steinhart-Hart constants for the thermistor. The simpler, two-term form of the Steinhart-Hart equation (Equation 2) may be used in some cases .
(2) 1/T = C1’ + C2’ * ln(R)
Note that C1’ C1 and C2’ C2.
Three Methods to Calculate the
Steinhart-Hart Constants
Three methods for calculating the constants of the Steinhart-Hart equation are
summarized in Table 1. Computer programs are available electronically, free of charge, from your ILX Lightwave representative, or from the Downloads section of our website.
0 5 10 15 20 25 30 35 40 45 -20 0 20 40 60 80 100 Temperature (C) Resistance (k Ohms)
1 Three-Term Steinhart-Hart equation is also used in
ILX Lightwave Model 39xx and 37xx Laser Diode Controllers.
Figure 1. NTC R-T response curve.
Thermistor Calibration
and the Steinhart-Hart Equation
The following publications are available for download on at www.ilxlightwave.com.
White Papers
• A Standard for Measuring Transient Suppression of Laser Diode Drivers
• Degree of Polarization vs. Poincaré Sphere Coverage • Improving Splice Loss Measurement Repeatability
Technical Notes
• Attenuation Accuracy in the 7900 Fiber Optic Test System • Automatic Wavelength Compensation of Photodiode Power Measurements Using the OMM-6810B Optical Multimeter • Bandwidth of OMM-6810B Optical Multimeter Analog Output • Broadband Noise Measurements for Laser Diode Current Sources • Clamping Limit of a LDX-3525 Precision Current Source
• Control Capability of the LDC-3916371 Fine Temperature Resolution Module
• Current Draw of the LDC-3926 16-Channel High Power Laser Diode Controller
• Determining the Polarization Dependent Response of the FPM-8210 Power Meter
• Four-Wire TEC Voltage Measurement with the LDT-5900 Series Temperature Controllers
• Guide to Selecting a Bias-T Laser Diode Mount
• High Power Linearity of the OMM-6810B and OMH-6780/6790/ 6795B Detector Heads
• Large-Signal Frequency Response of the 3916338 Current Source Module
• Laser Wavelength Measuring Using a Colored Glass Filter • Long-Term Output Drift of a LDX-3620 Ultra Low-Noise Laser Diode Current Source
• Long-Term Output Stability of a LDX-3525 Precision Current Source • Long-Term Stability of an MPS-8033/55 ASE Source
• LRS-9424 Heat Sink Temperature Stability When Chamber Door Opens
• Measurement of 4-Wire Voltage Sense on an LDC-3916 Laser Diode Controller
• Measuring the Power and Wavelength of Pulsed Sources Using the OMM-6810B Optical Mutlimeter
• Measuring the Sensitivity of the OMH-6709B Optical Measurement Head
• Measuring the Wavelength of Noisy Sources Using the OMM-6810B Optical Multimeter
• Output Current Accuracy of a LDX-3525 Precision Current Source • Pin Assignment for CC-305 and CC-505 Cables
• Power and Wavelength Stability of the 79800 DFB Source Module • Power and Wavelength Stability of the MPS-8000 Series Fiber Optic Sources
• Repeatability of Wavelength and Power Measurements Using the OMM-6810B Optical Multimeter
• Stability of the OMM-6810B Optical Multimeter and OMH-6727B InGaAs Power/Wavehead
• Switching Transient of the 79800D Optical Source Shutter • Temperature Controlled Mini-DIL Mount
• Temperature Stability Using the LDT-5948
• Thermal Performance of an LDM-4616 Laser Diode Mount • Triboelectric Effects in High Precision Temperature Measurements • Tuning the LDP-3840 for Optimum Pulse Response
• Typical Long-Term Temperature Stability of a LDT-5412 Low-Cost TEC
• Typical Long-Term Temperature Stability of a LDT-5525 TEC
• Typical Output Drift of a LDX-3412 Loc-Cost Precision Current Source
• Typical Output Noise of a LDX-3412 Precision Current Source • Typical Output Stability of the LDC-3724B
• Typical Output Stability of a LDX-3100 Board-Level Current Source • Typical Pulse Overshoot of the LDP-3840/03 Precision Pulse Current Source
• Typical Temperature Stability of a LDT-5412 Low-Cost Temperature Controller
• Using Three-Wire RTDs with the LDT-5900 Series Temperature Controllers
• Voltage Drop Across High Current Laser Interconnect Cable • Voltage Drop Across High Current TEC Interconnect Cable • Voltage Limit Protection of an LDC-3916 Laser Diode Controller • Wavelength Accuracy of the 79800 DFB Source Module
Application Notes
• App Note 1: Controlling Temperatures of Diode Lasers and Detectors Thermoelectrically
• App Note 2: Selecting and Using Thermistors for Temperature Control
• App Note 3: Protecting Your Laser Diode
• App Note 4: Thermistor Calibration and the Steinhart-Hart Equation
• App Note 5: An Overview of Laser Diode Characteristics
• App Note 6: Choosing the Right Laser Diode Mount for Your Application
• App Note 8: Mode Hopping in Semiconductor Lasers
• App Note 10: Optimize Testing for Threshold Calculation Repeatability
• App Note 11: Pulsing a Laser Diode
• App Note 12: The Differences between Threshold Current Calculation Methods
• App Note 13: Testing Bond Quality by Measuring Thermal Resistance of Laser Diodes
• App Note 14: Optimizing TEC Drive Current
• App Note 17: AD590 and LM335 Sensor Calibration
• App Note 18: Basic Test Methods for Passive Fiber Optic Components
• App Note 20: PID Control Loops in Thermoelectric Temperature Controllers
• App Note 21: High Performance Temperature Control in Laser Diode Test Applications
of the other two tolerances. The three factors are related as shown in Equation 3.
(3) Ttol = Rtol /
When a thermistor is calibrated with the Steinhart-Hart model, its temperature tolerance over that range is improved to the tolerance of the model. Therefore, an inexpensive thermistor calibrated to 0.02°C will be just as accurate as an expensive (i.e. tight tolerance) thermistor that is also calibrated to 0.02°C over the same temperature range.
Net Accuracy
An LDT-5948 or 5980 or other ILX Temperature Controller may be used to independantly measure the temperature when calibrating a thermistor. However, to guarantee accuracy, the instrument’s resistance measurement must be accurately calibrated and a previously calibrated
thermistor (with the Steinhart-Hart coeffi cients entered) must be used to measure the
temperature. Also, accuracy will be reduced by the temperature resolution of the
instrument, unless the temperature is queried via GPIB.
Stability vs. Accuracy
Temperature accuracy, which is the variance from true temperature, depends primarily on the thermistor calibration. Temperature stability, which is the invariance from the set temperature, depends on the controller design and the environment of the thermistor and TE module.
If an LDT-5948 or 5980 is used, short-term temperature stability of 0.001°C or better can be achieved.
The Excel version of STEIN1.EXE is printed in the Appendix.
Table 1
Three Methods of Calculating Constants C1, C2, C3
Table 1 Notes:
1 Accuracy over 0°C to 50°C range; assuming temperature and resistance
readings are accurate to four places.
2 Using 10k thermistor and ILX Lightwave model LDT-5910B temperature controller.
3 Using 10k thermistor and ILX Lightwave model LDT-5525 temperature controller.
Discussion Regarding Temperature
Accuracy
The method of thermistor calibration will depend on the accuracy requirements for the particular application. Table 1 shows the expected accuracies using the three different methods.
Thermistor Ratings
Manufacturers specify thermistor tolerances in several ways, usually with the resistance tolerance (Rtol) or temperature tolerance (Ttol), and the temperature coeffi cient of resistance (). The rated Rtol and Ttol are typically given for 25C with additional deviation factors for other temperatures. The temperature coeffi cient of resistance () is the percentage change of resistance for a 1°C change in temperature, and may be specifi ed with one
APPENDIX -
Method 1 Excel SpreadsheetType in the equations as shown. Temperature readings are entered in Cells C3-C5; Resistance readings are entered in Cells F3-F5. The results are shown in Cells F9-F11, and are scaled so they may be entered into the LDT-5910B directly.
A B C D E F G
1
2 Enter Temperature Values Here Enter Resistance Values Here
3 T1 = T1 R1 = R1
4 T2 = T2 R2 = R2
5 T3 = T3 R3 = R3
6
7 T1K = =C3+273.15
8 T2K = =C4+273.15 Results are shown here
9 T3K = =C5+273.15 C3 = =C22*10000000 10 C2 = =C23*10000 11 A1 = =LN (F3) C1 = =C24*1000 12 A2 = =LN(F4) 13 A3 = =LN(F5) 14 15 Z = =C11-C12 16 Y = =C11-C13 17 X = =1/C7 - 1/C8 18 W = =1/C7 - 1/C9 19 V = =C11^3 - C12^3 20 U = =C11^3 - C13^3 21 22 C3a = =(C17-C15*C18/C16)/(C19-C15*C20/C16) 23 C2a = =(C17-C22*C19)/C15 24 C1a = =1/C7-C22*C11^3-C23*C11 25
Often, the thermistor manufacturer will provide R-T values, but the accuracy of these values depends on the resistance tolerance of the thermistor. When a high temperature toler-ance is required, it is recommended that these R-T values be discarded and new values be measured as described below.
For some applications, the nominal R-T data is adequate and the Steinhart-Hart constants can be calculated using “Faster Method 2,” described below.
ILX Lightwave Model 520 uncalibrated thermistors are shipped with three-term nominal constant values as follows:
C1 = 1.125 C2 = 2.347 C3 = 0.855
The two-term nominal constants, for use with the LDT-5525, are:
C1’ = 0.99 C2’ = 2.57
Procedure for Calculating
Steinhart-Hart Constants
To calculate the constants for a new
thermistor, the temperature and resistance of that thermistor will need to be measured at several different temperatures covering the expected range of operation.
The following procedure requires some method to set and control a nominal temperature and a calibrated precision thermistor to reference the temperature. For all methods, it is worth noting that the ultimate accuracy of the constants is dependent upon the accuracy of the temperature and resistance measurements.
The control temperature tolerance will decrease rapidly if the thermistor is used outside of the temperature range in which it was calibrated. Temperature and resistance values should be made at evenly spaced increments over a range greater than the intended range-of-operation for the thermistor. 1. Set a nominal temperature and allow it to
stabilize.
2. Using a precision DMM (accuracy to a minimum of four places) read the resistance of the reference thermistor and the
uncalibrated thermistor.
3. Read the resistances three times before changing to a new nominal temperature. The three readings can be averaged if using Method 1, or all readings can be used if using Method 2 or Method 3.
4. If using Method 1, repeat steps 1-3 for a total of three temperature settings. For either Method 2 or Method 3, repeat the measurement as many times as practical; these two methods use least-squares fi t to determine the constants, and will be more accurate with a greater number of measurements.
5. The “true” temperature in degrees Celsius can be determined using the constants for the precision thermistor and using the inverse of Equation 1, shown below as Equation 4.
(4) T = (C1 + C2 * ln(R) + C3 * ln(R)3) –1 – 273.15
If using Method 3, the approximated Stein-hart-Hart equation, disregard the term using the constant C3 by using Equation 5.
(5) T = (C1 + C2 * ln(R)) –1 – 273.15
Table 2
Summary of Calibration Methods *Also used in ILX Lightwave Model 37xx and 39xx Laser Diode Controllers.
In Conclusion
Thermistor calibration, though not diffi cult, can be time-consuming. Therefore, it is best to fi rst determine the requirements of the application, then pick an appropriate
calibration method. The methods discusses in this publication are summarized in Table 2.
Figure 4. Temperature error due to thermistor calibration error.
Thermistor Calibration Error in Temperature with LDT-5525
-2 -1 0 1 2 3 4 -20 -10 0 10 20 30 40 50 60 70 Temp (OC)
Thermistor Calibration Error (
OC)
Calibrated 5% Tol. 1% Tol.
Thermistor accuracy is primarily a function of the thermistor calibration and resistance measurement accuracy, whereas temperature stability depends on the controller and control environment.
For more information on thermistor selection, see ILX Lightwave Application Note #2, Selecting and Using Thermistors for Temperature Control.
Copies of the programs may be obtained from ILX Lightwave free of charge through the Downloads section on www.ilxlightwave.com.
6. Compile the data into a table with two columns: “true” temperature calculated using Equation 4, and resistance
measured from the uncalibrated thermistor. This data will be used with one of the three methods listed in Table 1 to determine the three Steinhart-Hart constants for the new thermistor.
Three Methods of Steinhart-Hart
Constant Calculation
Method 1, STEIN1.EXE
STEIN1.EXE can be run directly from the Windows environment, or the Excel spreadsheet can be used (see Appendix for program listing). The three temperature and resistance values are entered and the constant values are returned. If any of the constant values are negative there is an error and the data should be checked or
re-measured.
The constants are output in the form used by an ILX temperature controller by scaling each as shown below.
(6) C1 = C1 * 103 (7) C2 = C2 * 104 (8) C3 = C3 * 107
The program or spreadsheet performs this scaling so the output values can be entered directly into the temperature controller.
Method 2, STEIN2.EXE
STEIN2.EXE uses least-squares-fi t error reduction, so requires a greater number of temperature/resistance readings to be taken
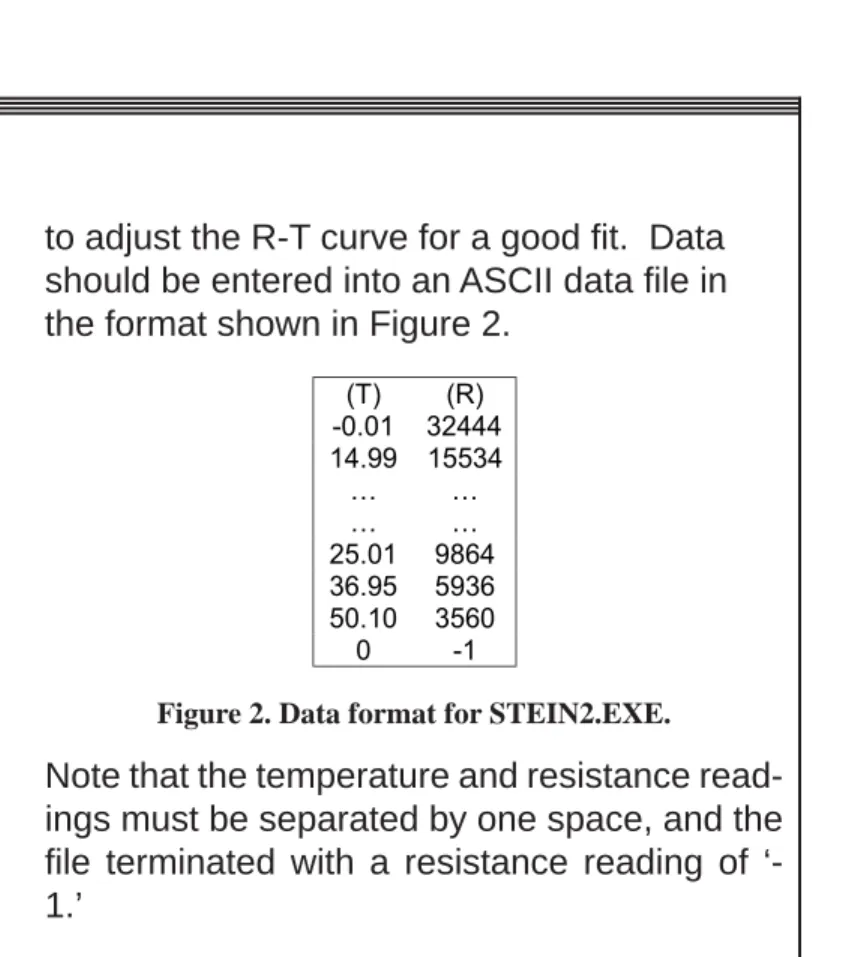
to adjust the R-T curve for a good fi t. Data should be entered into an ASCII data fi le in the format shown in Figure 2.
Note that the temperature and resistance read-ings must be separated by one space, and the fi le terminated with a resistance reading of ‘-1.’
The data fi le can be created in Excel and saved as a “.PRN” fi le to ensure the data is space delimited (the program will not function properly if the data is tab delimited). The constants will be output in the form required by the ILX Lightwave temperature controller.
Alternatively, the program called EasySTEIN2. EXE can be used. This program will prompt for the data to be input directly, rather than using a separate data fi le. As with STEIN2. EXE, the constants are output in a form that is entered directly into the temperature controller. The constant uncertainties are also calculated and displayed.
Both programs use the method described by Philip R Bevington in “Data Reduction and Error Analysis for the Physical Sciences,” McGraw-Hill, New York, 1969. Matrix inversion is used to solve N simultaneous equations, where N is the number of data pairs in the data fi le (excluding the marker). Coeffi cients C1, C2, and C3 are determined by
(T) (R) -0.01 32444 14.99 15534 … … … … 25.01 9864 36.95 5936 50.10 3560 0 -1
Figure 2. Data format for STEIN2.EXE.
minimizing 2, the measure of the fi t of the
curve to the data.
Faster Method 2
As discussed previously, some manufacturers provide nominal R-T values with the
thermistor. “Nominal” Steinhart-Hart
constant values can be calculated from the manufacturer’s R-T values with Method 2 if high temperature control tolerances are not required for a particular application.
Temperature error can be calculated using Equation (4) with the “nominal” constant values and the worst-case resistance values from the tolerance rating. Results of this exercise are shown in Figure 3 for a 1% and 5% tolerance thermistor. The error is the uncertainty in the temperature based on the resistance tolerance when deriving C1, C2, and C3; it does not include any additional error based on the uncertainty in the resistance measurement.
As shown in Figure 3, below 50°C this error is less than about 1.5°C for the 5% tolerance 10k thermistor. The error for a typical 1%
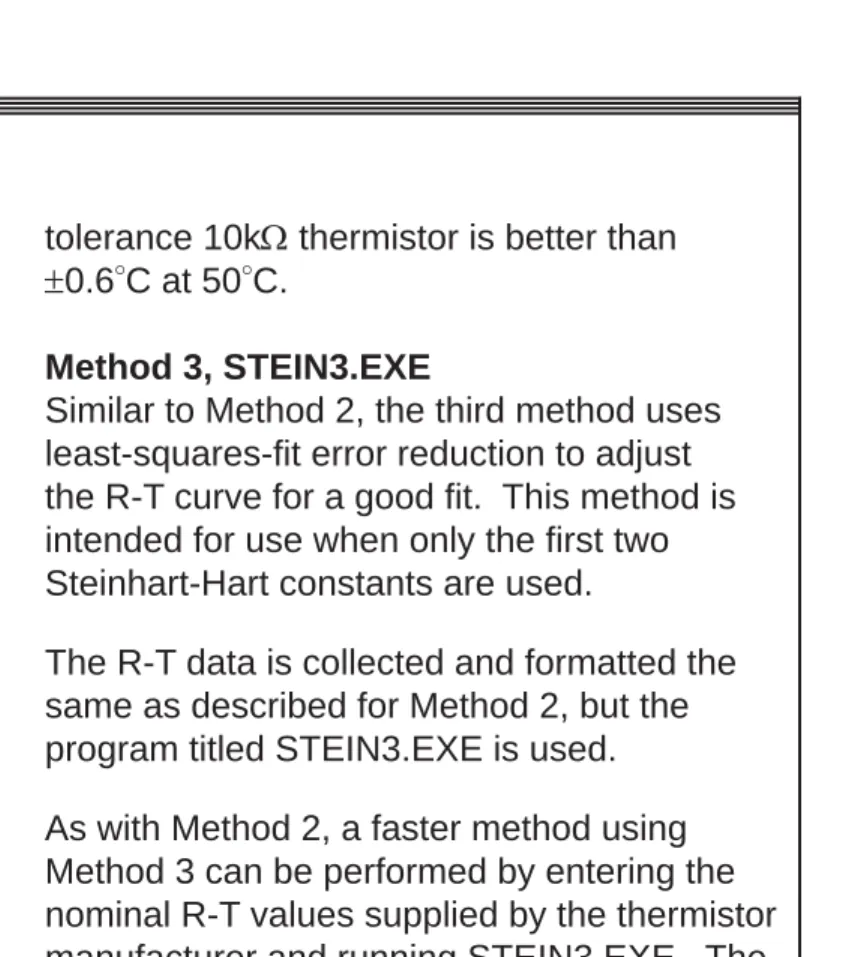
tolerance 10k thermistor is better than
0.6°C at 50°C.
Method 3, STEIN3.EXE
Similar to Method 2, the third method uses least-squares-fi t error reduction to adjust the R-T curve for a good fi t. This method is intended for use when only the fi rst two Steinhart-Hart constants are used.
The R-T data is collected and formatted the same as described for Method 2, but the program titled STEIN3.EXE is used. As with Method 2, a faster method using Method 3 can be performed by entering the nominal R-T values supplied by the thermistor manufacturer and running STEIN3.EXE. The resulting “nominal” Steinhart-Hart constant values can then be entered into the LDT-5525. Temperature error can be calculated using Equation 5 with the “nominal”
constant values and the worst-case resistance values from the tolerance rating.
As shown in Figure 4, below 50°C this error is less than about 2°C for the 5% tolerance 10k thermistor. The error for a typical 1% tolerance 10k thermistor is better than
0.8°C at 50°C.
Figure 4 also shows the error associated with the calibration for a Model 510 (10k) thermistor, used with the Model LDT-5525 Temperature Controller when using Equation 5. Again, this does not include any error in the resistance measurement.
Thermistor Calibration Error in Temperature with Eq (4)
-3 -2 -1 0 1 2 3 -20 -10 0 10 20 30 40 50 60 70 Temp (OC)
Thermistor Calibration Error (
OC)
5% Tol. 1% Tol.
Figure 3. Temperature error due to thermistor calibration error.
6. Compile the data into a table with two columns: “true” temperature calculated using Equation 4, and resistance
measured from the uncalibrated thermistor. This data will be used with one of the three methods listed in Table 1 to determine the three Steinhart-Hart constants for the new thermistor.
Three Methods of Steinhart-Hart
Constant Calculation
Method 1, STEIN1.EXE
STEIN1.EXE can be run directly from the Windows environment, or the Excel spreadsheet can be used (see Appendix for program listing). The three temperature and resistance values are entered and the constant values are returned. If any of the constant values are negative there is an error and the data should be checked or
re-measured.
The constants are output in the form used by an ILX temperature controller by scaling each as shown below.
(6) C1 = C1 * 103 (7) C2 = C2 * 104 (8) C3 = C3 * 107
The program or spreadsheet performs this scaling so the output values can be entered directly into the temperature controller.
Method 2, STEIN2.EXE
STEIN2.EXE uses least-squares-fi t error reduction, so requires a greater number of temperature/resistance readings to be taken
to adjust the R-T curve for a good fi t. Data should be entered into an ASCII data fi le in the format shown in Figure 2.
Note that the temperature and resistance read-ings must be separated by one space, and the fi le terminated with a resistance reading of ‘-1.’
The data fi le can be created in Excel and saved as a “.PRN” fi le to ensure the data is space delimited (the program will not function properly if the data is tab delimited). The constants will be output in the form required by the ILX Lightwave temperature controller.
Alternatively, the program called EasySTEIN2. EXE can be used. This program will prompt for the data to be input directly, rather than using a separate data fi le. As with STEIN2. EXE, the constants are output in a form that is entered directly into the temperature controller. The constant uncertainties are also calculated and displayed.
Both programs use the method described by Philip R Bevington in “Data Reduction and Error Analysis for the Physical Sciences,” McGraw-Hill, New York, 1969. Matrix inversion is used to solve N simultaneous equations, where N is the number of data pairs in the data fi le (excluding the marker). Coeffi cients C1, C2, and C3 are determined by
(T) (R) -0.01 32444 14.99 15534 … … … … 25.01 9864 36.95 5936 50.10 3560 0 -1
Figure 2. Data format for STEIN2.EXE.
minimizing 2, the measure of the fi t of the
curve to the data.
Faster Method 2
As discussed previously, some manufacturers provide nominal R-T values with the
thermistor. “Nominal” Steinhart-Hart
constant values can be calculated from the manufacturer’s R-T values with Method 2 if high temperature control tolerances are not required for a particular application.
Temperature error can be calculated using Equation (4) with the “nominal” constant values and the worst-case resistance values from the tolerance rating. Results of this exercise are shown in Figure 3 for a 1% and 5% tolerance thermistor. The error is the uncertainty in the temperature based on the resistance tolerance when deriving C1, C2, and C3; it does not include any additional error based on the uncertainty in the resistance measurement.
As shown in Figure 3, below 50°C this error is less than about 1.5°C for the 5% tolerance 10k thermistor. The error for a typical 1%
tolerance 10k thermistor is better than
0.6°C at 50°C.
Method 3, STEIN3.EXE
Similar to Method 2, the third method uses least-squares-fi t error reduction to adjust the R-T curve for a good fi t. This method is intended for use when only the fi rst two Steinhart-Hart constants are used.
The R-T data is collected and formatted the same as described for Method 2, but the program titled STEIN3.EXE is used. As with Method 2, a faster method using Method 3 can be performed by entering the nominal R-T values supplied by the thermistor manufacturer and running STEIN3.EXE. The resulting “nominal” Steinhart-Hart constant values can then be entered into the LDT-5525. Temperature error can be calculated using Equation 5 with the “nominal”
constant values and the worst-case resistance values from the tolerance rating.
As shown in Figure 4, below 50°C this error is less than about 2°C for the 5% tolerance 10k thermistor. The error for a typical 1% tolerance 10k thermistor is better than
0.8°C at 50°C.
Figure 4 also shows the error associated with the calibration for a Model 510 (10k) thermistor, used with the Model LDT-5525 Temperature Controller when using Equation 5. Again, this does not include any error in the resistance measurement.
Thermistor Calibration Error in Temperature with Eq (4)
-3 -2 -1 0 1 2 3 -20 -10 0 10 20 30 40 50 60 70 Temp (OC)
Thermistor Calibration Error (
OC)
5% Tol. 1% Tol.
Figure 3. Temperature error due to thermistor calibration error.
Often, the thermistor manufacturer will provide R-T values, but the accuracy of these values depends on the resistance tolerance of the thermistor. When a high temperature toler-ance is required, it is recommended that these R-T values be discarded and new values be measured as described below.
For some applications, the nominal R-T data is adequate and the Steinhart-Hart constants can be calculated using “Faster Method 2,” described below.
ILX Lightwave Model 520 uncalibrated thermistors are shipped with three-term nominal constant values as follows:
C1 = 1.125 C2 = 2.347 C3 = 0.855
The two-term nominal constants, for use with the LDT-5525, are:
C1’ = 0.99 C2’ = 2.57
Procedure for Calculating
Steinhart-Hart Constants
To calculate the constants for a new
thermistor, the temperature and resistance of that thermistor will need to be measured at several different temperatures covering the expected range of operation.
The following procedure requires some method to set and control a nominal temperature and a calibrated precision thermistor to reference the temperature. For all methods, it is worth noting that the ultimate accuracy of the constants is dependent upon the accuracy of the temperature and resistance measurements.
The control temperature tolerance will decrease rapidly if the thermistor is used outside of the temperature range in which it was calibrated. Temperature and resistance values should be made at evenly spaced increments over a range greater than the intended range-of-operation for the thermistor. 1. Set a nominal temperature and allow it to
stabilize.
2. Using a precision DMM (accuracy to a minimum of four places) read the resistance of the reference thermistor and the
uncalibrated thermistor.
3. Read the resistances three times before changing to a new nominal temperature. The three readings can be averaged if using Method 1, or all readings can be used if using Method 2 or Method 3.
4. If using Method 1, repeat steps 1-3 for a total of three temperature settings. For either Method 2 or Method 3, repeat the measurement as many times as practical; these two methods use least-squares fi t to determine the constants, and will be more accurate with a greater number of measurements.
5. The “true” temperature in degrees Celsius can be determined using the constants for the precision thermistor and using the inverse of Equation 1, shown below as Equation 4.
(4) T = (C1 + C2 * ln(R) + C3 * ln(R)3) –1 – 273.15
If using Method 3, the approximated Stein-hart-Hart equation, disregard the term using the constant C3 by using Equation 5.
(5) T = (C1 + C2 * ln(R)) –1 – 273.15
Table 2
Summary of Calibration Methods *Also used in ILX Lightwave Model 37xx and 39xx Laser Diode Controllers.
In Conclusion
Thermistor calibration, though not diffi cult, can be time-consuming. Therefore, it is best to fi rst determine the requirements of the application, then pick an appropriate
calibration method. The methods discusses in this publication are summarized in Table 2.
Figure 4. Temperature error due to thermistor calibration error.
Thermistor Calibration Error in Temperature with LDT-5525
-2 -1 0 1 2 3 4 -20 -10 0 10 20 30 40 50 60 70 Temp (OC)
Thermistor Calibration Error (
OC)
Calibrated 5% Tol. 1% Tol.
Thermistor accuracy is primarily a function of the thermistor calibration and resistance measurement accuracy, whereas temperature stability depends on the controller and control environment.
For more information on thermistor selection, see ILX Lightwave Application Note #2, Selecting and Using Thermistors for Temperature Control.
Copies of the programs may be obtained from ILX Lightwave free of charge through the Downloads section on www.ilxlightwave.com.
of the other two tolerances. The three factors are related as shown in Equation 3.
(3) Ttol = Rtol /
When a thermistor is calibrated with the Steinhart-Hart model, its temperature tolerance over that range is improved to the tolerance of the model. Therefore, an inexpensive thermistor calibrated to 0.02°C will be just as accurate as an expensive (i.e. tight tolerance) thermistor that is also calibrated to 0.02°C over the same temperature range.
Net Accuracy
An LDT-5948 or 5980 or other ILX Temperature Controller may be used to independantly measure the temperature when calibrating a thermistor. However, to guarantee accuracy, the instrument’s resistance measurement must be accurately calibrated and a previously calibrated
thermistor (with the Steinhart-Hart coeffi cients entered) must be used to measure the
temperature. Also, accuracy will be reduced by the temperature resolution of the
instrument, unless the temperature is queried via GPIB.
Stability vs. Accuracy
Temperature accuracy, which is the variance from true temperature, depends primarily on the thermistor calibration. Temperature stability, which is the invariance from the set temperature, depends on the controller design and the environment of the thermistor and TE module.
If an LDT-5948 or 5980 is used, short-term temperature stability of 0.001°C or better can be achieved.
The Excel version of STEIN1.EXE is printed in the Appendix.
Table 1
Three Methods of Calculating Constants C1, C2, C3
Table 1 Notes:
1 Accuracy over 0°C to 50°C range; assuming temperature and resistance
readings are accurate to four places.
2 Using 10k thermistor and ILX Lightwave model LDT-5910B temperature controller.
3 Using 10k thermistor and ILX Lightwave model LDT-5525 temperature controller.
Discussion Regarding Temperature
Accuracy
The method of thermistor calibration will depend on the accuracy requirements for the particular application. Table 1 shows the expected accuracies using the three different methods.
Thermistor Ratings
Manufacturers specify thermistor tolerances in several ways, usually with the resistance tolerance (Rtol) or temperature tolerance (Ttol), and the temperature coeffi cient of resistance (). The rated Rtol and Ttol are typically given for 25C with additional deviation factors for other temperatures. The temperature coeffi cient of resistance () is the percentage change of resistance for a 1°C change in temperature, and may be specifi ed with one
APPENDIX -
Method 1 Excel SpreadsheetType in the equations as shown. Temperature readings are entered in Cells C3-C5; Resistance readings are entered in Cells F3-F5. The results are shown in Cells F9-F11, and are scaled so they may be entered into the LDT-5910B directly.
A B C D E F G
1
2 Enter Temperature Values Here Enter Resistance Values Here
3 T1 = T1 R1 = R1
4 T2 = T2 R2 = R2
5 T3 = T3 R3 = R3
6
7 T1K = =C3+273.15
8 T2K = =C4+273.15 Results are shown here
9 T3K = =C5+273.15 C3 = =C22*10000000 10 C2 = =C23*10000 11 A1 = =LN (F3) C1 = =C24*1000 12 A2 = =LN(F4) 13 A3 = =LN(F5) 14 15 Z = =C11-C12 16 Y = =C11-C13 17 X = =1/C7 - 1/C8 18 W = =1/C7 - 1/C9 19 V = =C11^3 - C12^3 20 U = =C11^3 - C13^3 21 22 C3a = =(C17-C15*C18/C16)/(C19-C15*C20/C16) 23 C2a = =(C17-C22*C19)/C15 24 C1a = =1/C7-C22*C11^3-C23*C11 25
Thermistors provide an inexpensive and accurate temperature monitor for use with laser diodes. The nonlinear resistance-temperature characteristics of a Negative-Temperature Coeffi cient (NTC) thermistor may be modeled to a high degree of accuracy using the Steinhart-Hart equation, LaGrange polynomials, or other modeling techniques. Figure 1 shows a common R-T relation curve for a 10k NTC thermistor.
In 1968, Steinhart and Hart developed a model for thermistor R-T characteristics in order to make accurate temperature measure-ments for oceanic studies. Today, the most popular model for R-T characterization is the Steinhart-Hart equation.
This publication describes two methods for calibrating thermistors using the Steinhart-Hart equation; the fi rst method may be used with the ILX Lightwave Model LDT-5948 and LDT-59801 Temperature Controllers, or any
other temperature controller which uses the Steinhart-Hart equation. The second form of the equation is simpler, and is used when only the fi rst two Steinhart-Hart constants are used.
The Steinhart-Hart Equation
The three-term Steinhart-Hart equation (Equation 1) is the most popular model used for thermistor R-T modeling.
(1) 1/T = C1 + C2 * ln(R) + C3 * ln(R)3
Where T is the absolute temperature in Kelvin and R is the thermistor resistance in ohms. The terms C1, C2, and C3 are the Steinhart-Hart constants for the thermistor. The simpler, two-term form of the Steinhart-Hart equation (Equation 2) may be used in some cases .
(2) 1/T = C1’ + C2’ * ln(R)
Note that C1’ C1 and C2’ C2.
Three Methods to Calculate the
Steinhart-Hart Constants
Three methods for calculating the constants of the Steinhart-Hart equation are
summarized in Table 1. Computer programs are available electronically, free of charge, from your ILX Lightwave representative, or from the Downloads section of our website.
0 5 10 15 20 25 30 35 40 45 -20 0 20 40 60 80 100 Temperature (C) Resistance (k Ohms)
1 Three-Term Steinhart-Hart equation is also used in
ILX Lightwave Model 39xx and 37xx Laser Diode Controllers.
Figure 1. NTC R-T response curve.
Thermistor Calibration
and the Steinhart-Hart Equation
The following publications are available for download on at www.ilxlightwave.com.
White Papers
• A Standard for Measuring Transient Suppression of Laser Diode Drivers
• Degree of Polarization vs. Poincaré Sphere Coverage • Improving Splice Loss Measurement Repeatability
Technical Notes
• Attenuation Accuracy in the 7900 Fiber Optic Test System • Automatic Wavelength Compensation of Photodiode Power Measurements Using the OMM-6810B Optical Multimeter • Bandwidth of OMM-6810B Optical Multimeter Analog Output • Broadband Noise Measurements for Laser Diode Current Sources • Clamping Limit of a LDX-3525 Precision Current Source
• Control Capability of the LDC-3916371 Fine Temperature Resolution Module
• Current Draw of the LDC-3926 16-Channel High Power Laser Diode Controller
• Determining the Polarization Dependent Response of the FPM-8210 Power Meter
• Four-Wire TEC Voltage Measurement with the LDT-5900 Series Temperature Controllers
• Guide to Selecting a Bias-T Laser Diode Mount
• High Power Linearity of the OMM-6810B and OMH-6780/6790/ 6795B Detector Heads
• Large-Signal Frequency Response of the 3916338 Current Source Module
• Laser Wavelength Measuring Using a Colored Glass Filter • Long-Term Output Drift of a LDX-3620 Ultra Low-Noise Laser Diode Current Source
• Long-Term Output Stability of a LDX-3525 Precision Current Source • Long-Term Stability of an MPS-8033/55 ASE Source
• LRS-9424 Heat Sink Temperature Stability When Chamber Door Opens
• Measurement of 4-Wire Voltage Sense on an LDC-3916 Laser Diode Controller
• Measuring the Power and Wavelength of Pulsed Sources Using the OMM-6810B Optical Mutlimeter
• Measuring the Sensitivity of the OMH-6709B Optical Measurement Head
• Measuring the Wavelength of Noisy Sources Using the OMM-6810B Optical Multimeter
• Output Current Accuracy of a LDX-3525 Precision Current Source • Pin Assignment for CC-305 and CC-505 Cables
• Power and Wavelength Stability of the 79800 DFB Source Module • Power and Wavelength Stability of the MPS-8000 Series Fiber Optic Sources
• Repeatability of Wavelength and Power Measurements Using the OMM-6810B Optical Multimeter
• Stability of the OMM-6810B Optical Multimeter and OMH-6727B InGaAs Power/Wavehead
• Switching Transient of the 79800D Optical Source Shutter • Temperature Controlled Mini-DIL Mount
• Temperature Stability Using the LDT-5948
• Thermal Performance of an LDM-4616 Laser Diode Mount • Triboelectric Effects in High Precision Temperature Measurements • Tuning the LDP-3840 for Optimum Pulse Response
• Typical Long-Term Temperature Stability of a LDT-5412 Low-Cost TEC
• Typical Long-Term Temperature Stability of a LDT-5525 TEC
• Typical Output Drift of a LDX-3412 Loc-Cost Precision Current Source
• Typical Output Noise of a LDX-3412 Precision Current Source • Typical Output Stability of the LDC-3724B
• Typical Output Stability of a LDX-3100 Board-Level Current Source • Typical Pulse Overshoot of the LDP-3840/03 Precision Pulse Current Source
• Typical Temperature Stability of a LDT-5412 Low-Cost Temperature Controller
• Using Three-Wire RTDs with the LDT-5900 Series Temperature Controllers
• Voltage Drop Across High Current Laser Interconnect Cable • Voltage Drop Across High Current TEC Interconnect Cable • Voltage Limit Protection of an LDC-3916 Laser Diode Controller • Wavelength Accuracy of the 79800 DFB Source Module
Application Notes
• App Note 1: Controlling Temperatures of Diode Lasers and Detectors Thermoelectrically
• App Note 2: Selecting and Using Thermistors for Temperature Control
• App Note 3: Protecting Your Laser Diode
• App Note 4: Thermistor Calibration and the Steinhart-Hart Equation
• App Note 5: An Overview of Laser Diode Characteristics
• App Note 6: Choosing the Right Laser Diode Mount for Your Application
• App Note 8: Mode Hopping in Semiconductor Lasers
• App Note 10: Optimize Testing for Threshold Calculation Repeatability
• App Note 11: Pulsing a Laser Diode
• App Note 12: The Differences between Threshold Current Calculation Methods
• App Note 13: Testing Bond Quality by Measuring Thermal Resistance of Laser Diodes
• App Note 14: Optimizing TEC Drive Current
• App Note 17: AD590 and LM335 Sensor Calibration
• App Note 18: Basic Test Methods for Passive Fiber Optic Components
• App Note 20: PID Control Loops in Thermoelectric Temperature Controllers
• App Note 21: High Performance Temperature Control in Laser Diode Test Applications
For application assistance or additional information on our products or services you can contact us at:
ILX Lightwave Corporation
31950 Frontage Road, Bozeman, MT 59715 Phone: 406-556-2481 800-459-9459 Fax: 406-586-9405
Email: sales@ilxlightwave.com
To obtain contact information for our international distributors and product repair centers or for fast access to product information, technical support, LabVIEW drivers, and our comprehensive library of technical and application information, visit our website at:
www.ilxlightwave.com