Sede Amministrativa: Università degli Studi di Padova Dipartimento di Salute della Donna e del Bambino SDB
______________________________________________________________________
SCUOLA DI DOTTORATO DI RICERCA IN:
MEDICINA DELLO SVILUPPO E SCIENZE DELLA PROGRAMMAZIONE INDIRIZZO: EMATOONCOLOGIA, GENETICA, MALATTIE RARE E MEDICINA
PREDITTIVA CICLO XXVII
Role of the stamness transcription factor ZNF521 in
MLL-rearranged acute myeloid leukemia
Direttore della Scuola : Ch.mo Prof. Giuseppe Basso
Coordinatore d’indirizzo: Ch.mo Prof. Carlo Giaquinto
Supervisore: Dott. Giuseppe Germano
Now, here, you see, it takes all the running
you can do, to keep in the same place. If you want to get somewhere else, You must run at least twice as fast as that!”
1
TABLE OF CONTENTS
TABLE OF CONTENTS ... 1 SUMMARY ... 3 RIASSUNTO ... 5 INTRODUCTION ... 7 1. HEMATOPOIESIS ... 71.1. HSC: the paradigm of self-renewal and differentiation. ... 9
2. LEUKEMIA ... 12
2.1. Leukemia Stem Cell: an hallmark in AML ... 12
2.2 Characteristic of MLL-rearranged AML ... 15
3. MLL GENE IS REQUIRED DURING DEVELOPMENT AND HEMATOPOIESIS ... 20
3.1. MLL-rearranged AML is a leukemic stem cell disease ... 22
4. ZNF521 ... 24
AIM OF THE THESIS ... 27
MATHERIALS AND METHODS... 29
1. PATIENT SAMPLES AND CELL LINES ... 29
2. QUANTITATIVE REAL TIME PCR ... 30
3. LENTIVIRAL SHRNA VECTOR, TRANSDUCTION AND FACS-SORTING ... 31
4. PLASMIDS CONSTRUCTS, TRANSIENT TRANSFECTION AND LUCIFERASE ASSAY ... 32
5. CHROMATIN IMMUNOPRECIPITATION (CHIP) AND PCR DETECTION ... 33
6. MICROARRAY ANALYSIS ... 33
7. WESTERN BLOT AND IMMUNOFLUORESCENCE STAINING... 34
8. CELL FUNCTION ANALYSIS ... 35
8.1 Cell viability and clonogenic assay ... 35
2
8.3. Expression of CD11b and CD14, morphological analysis and cell differentiation induction . 36
9. STUDIES WITH AML PATIENT-DERIVED XENOGRAFT CELLS ... 37
10. DATA ANALYSIS ... 38
RESULTS ... 39
1. GSEA analysis of upregulated stemness genes in pediatric AML ... 39
2. ZNF521 IS ABERRANTLY OVEREXPRESSED IN PEDIATRIC MLL-REARRANGED AML ... 40
3. ZNF521 DEPLETION REDUCES CELL VIABILITY AND CAUSES CELL CYCLE ARREST WITHOUT INDUCING APOPTOSIS OF MLL-REARRANGED AML CELL LINES. ... 42
4. DEPLETION OF ZNF521 INDUCES MYELOID DIFFERENTIATION OF MLL-REARRANGED AML CELL LINES. ... 47
5. EFFECTS OF ZNF521 DEPLETION IN PATIENT-DERIVED AML XENOGRAFT CELLS. ... 50
6. GENE EXPRESSION CHANGES AFTER ZNF521 DEPLETION IN THP-1 CELLS. ... 52
7. ZNF521 GENE PROMOTER IS ACTIVATES BY MLL FUSION PROTEINS. ... 59
DISCUSSION ... 63
3
SUMMARY
Acute myeloid leukemias (AMLs) that harbor translocations involving the MLL gene on chromosome 11q23 generate fusion transcripts that give rise novel fusion proteins with potent oncogenic properties and capable to destabilize the normal transcriptional activities. MLL fusion oncoproteins have been shown to initiate leukemic transformation primarily by overexpression of a specific set of genes, including HOXA4, 5, 6, 7, 9, 10
(overall defined as “HOXA-code” genes), MEIS1 (a cofactor of “HOXA-code” proteins) and MYB. It‘s well established that the majority of these genes are involved in normal programs of self-renewal, maintenance and proliferation of hematopoietic stem cells and early progenitors. Therefore is not surprise that the deregulation of the stemness genetic programs due to MLL fusion oncogenes is a crucial step for leukemic transformation. To identify new stemness genes involved in MLL-mediated transformation we performed gene set enrichments analysis (GSEA) using public database of geneset profiles of normal hematopoietic cells in a cohort of pediatric AML previously analyzed. These analyses identified a series of genes more highly expressed in MLL-rearranged AML including the well known HOXA9, HOXA5 and MEIS1, together with an apparently novel gene: ZNF521 or zinc finger protein 521
ZNF521 encodes for a zinc finger protein and, like HOXA9, is strongly expressed by CD34+ hematopoietic stem cells and drastically decreases during differentiation. To evaluate the importance of ZNF521 in MLL-rearranged AML, we performed a series of functional and mechanistic studies to uncover the role of ZNF521 in MLL-rearranged cells. We used lentiviral vectors to silencing the ZNF521 and expression vectors to induce MLL-fusion proteins such as MLL-AF9. These studies, both in vitro and ex vivo, demonstrate that the growth inhibition, reduced clonogenicity and cell cycle arrest induced by ZNF521 depletion is mediated through enhanced myeloid differentiation. Moreover, we demonstrate that ZNF521 is a direct target of MLL-fusion oncoproteins such as MLL-AF9 and MLL-ENL.
Collectively, these findings identify ZNF521 as critical effector of MLL fusion in leukemogenesis that might be targeted to overcome the differentiation block associated
4
with MLL-rearranged AML and thus highlight ZNF521 as potential therapeutic target in treating this subtype of aggressive leukemias
5
RIASSUNTO
Il gene MLL è spesso coinvolto in traslocazioni cromosomiche che causano la formazione di nuovi trascritti di fusione in grado di codificare delle proteine chimeriche con elevate proprietà oncogeniche e di de-regolazione dell’attività trascrizionale. Le oncoproteine MLL di fusione sono capaci di iniziare la trasformazione leucemica provocando una overespressione di diversi geni, tra cui quelli più critici sono gli HOXA4-10 (che complessivamente costituiscono l’HOXA-code), MEIS1 (un cofattore delle proteine HOXA-code) e MYB. La maggior parte di questi geni sono implicati nei normali programmi di
self-renewal, mantenimento e proliferazione della popolazione cellulare ematopoietica staminale e dei progenitori. È evidente che la deregolazione dei programmi genetici associati alla staminalità, provocata dalla presenza degli oncongeni MLL di fusione, ha un ruolo cruciale nella trasformazione leucemica delle cellule ematopoietiche.
In questo studio abbiamo identificato, tramite GSEA (Gene Set Enrichment Analysis), i profili genetici delle cellule CD133+ normali ottenuti da database pubblici e, successivamente abbiamo valutato la loro espressione in una serie di leucemie acute mieloidi (LAM) pediatriche precedentemente analizzate in altri studi di espressione genica. I risultati mostrano che tutti i target noti degli oncogeni MLL di fusione (HOXA, MEIS1) sono up-regolati esclusivamente nelle LAM con traslocazioni del gene MLL. Abbiamo inoltre osservato che tra i geni maggiormente up-regolati è presente anche
ZNF521, un gene che codifica per una proteina appartenente alla famiglia delle proteine zinc-fingers. Come HOXA9, anche ZNF521 è altamente espresso nelle cellule ematopoietiche staminali CD34+ e la sua espressione diminuisce rapidamente durante il differenziamento. Per valutare l’importanza di ZNF521 nelle LAM con traslocazioni del gene MLL abbiamo eseguito una serie di studi funzionali e meccanicistici in vitro ed ex vivo con cellule primarie, utilizzando sia vettori lentivirali per il silenziamento del gene
ZNF521, sia vettori di espressione di diversi oncogeni con traslocazioni di MLL. Questi studi hanno dimostrato che il silenziamento di ZNF521, che ne determina una diminuzione di espressione ed induce le cellule a differenziare, causa un’inibizione della proliferazione cellulare, una drastica riduzione della clonogenicità e l’arresto del ciclo
6
cellulare in fase G1. Inoltre, abbiamo dimostrato che ZNF521 è tra i target diretti delle oncoproteine MLL di fusione, ed è quindi attivamente coinvolto nella trasformazione leucemica in seguito alle traslocazioni del gene MLL.
In conclusione, ZNF521 si è rivelato essere un nuovo importante effettore degli oncogeni
MLL di fusione e un fattore cruciale nel mantenimento dello stato indifferenziato delle cellule mieloidi leucemiche che presentano riarrangiamenti del gene MLL e potrebbe quindi dimostrarsi un importante nuovo target terapeutico.
7
INTRODUCTION
1. HEMATOPOIESIS
Hematopoiesis is the process that gives rise to all blood cellular components during embryonic development, and throughout adulthood to produce and replenish the hematopoietic system. It is estimated that this process provides to produce almost 1010 cells every hour for replenish continuously aged or damaged blood cells (Williams, 1995). This system of generative activity is tightly regulated by progressive restriction of cell fate potentials initiating from hematopoietic stem cells (HSCs) to lineage-restricted progenitors that produce all lineages of mature blood cells (Figure 1).
8
Figure 1: Hematopoiesis.
The figure shows the development of hematopoietic stem cells (HSC). All blood cells are derived from HSCs, which are at the basis of the adult blood cell differentiation hierarchy. HSCs can be subdivided into self-renewing HSCs and multipotent progenitors.These include common lymphoid progenitor (CLP) and common myeloid progenitor (CMP). CMP further divides to give rise to more differentiated progenitors, committed to granulocytes and macrophages (GMs), and megakaryocytes and erythroid cells (MEPs). CLP produces progenitors committed to T cells and B cells. Successive division and differentiation of these progenitors give rise to fully differentiated B- and T-cells. CMPs maturation generate neutrophils, eosinophils, basophils, monocytes, platelets and erythrocytes.
Deregulation along the developmental pathway leads to various hematological disease like anemia, immunodeficiencies or leukemia. Therefore, a deeper knowledge of the mechanisms that finely regulate this balancing is pivotal for understanding of both normal hematopoietic development and pathogenesis of hematopoietic disease.
All cellular blood components are derived during fetal and adult life through a mechanism that is conserved across vertebrates and involve two waves: the primitive wave and the definitive wave (Galloway, 2003). The primitive wave, which involves an erythroid progenitor, gives rise to erythrocytes and macrophages during early embryonic
development (Palis, 2001; Madhumita, 2013) and is predominantly marked by erythroid progenitor to produce red blood cells that facilitate tissue oxygenation during growing embryo (Orkin and Zon, 2008). The primitive wave is transitory, however, and these erythroid progenitors are not pluripotent and do not have renewal capability. By contrast, definitive hematopoiesis occurs later in development, notably at different time points in different species. In vertebrates, a definitive wave involves hematopoietic stem cells (HSCs) that originate in the aorta-gonad-mesonephros (AGM) region of the developing embryo. In humans, HSCs are produced in yolk sac and placenta from where they migrate to the fetal liver and then to the bone marrow, which is the location for HSCs in adults (Dzierzak, 2007; Cumano, 2007).
9
1.1. HSC: the paradigm of self-renewal and differentiation.
The integrity of the hematopoietic system depends on a large number of blood cell lineages being continuously replenished from a rare population of pluripotent hematopoietic stem cells (HSCs), representing a paradigm for how multi-lineage diversity can be achieved from a common stem cell through lineage commitment and subsequent differentiation (Kondo, 2003). Hematopoiesis requires a continuous production of progenitors and mature blood cells from HSCs through differentiation processes. In fact, HSCs sustain lifelong production of all blood cell types through finely balanced divisions leading to self-renewal and differentiation. Differentiation is associated with a loss of self-renewal capacity, requiring HSCs as a population to self-renew to maintain itself. The fate choice of HSCs to either self-renew or differentiate is controlled by a complex interplay between intrinsic mechanisms and extrinsic signals from the surrounding environment or stem cell niches (Moore, 2006).
Extrinsic (environmental) signals are predominantly derived from stromal cells and their products (Wineman, 1996; Blazsek, 1995). The marrow, in particular, contains specialized environments that regulate the balance of HSC self-renewal and differentiation and comprise what has been termed the stem cell niche. In fetal and adult mammals, HSCs predominantly reside in fetal liver (FL) and bone marrow (BM), respectively. However, HSCs do not originate in FL or BM, but rather migrate from other tissues to these sites during embryonic development. In mammals, most blood cells have relatively short lifespans. For this reason, HSCs continuously differentiate into multiple lineages of different blood cell types, simultaneously replicating themselves through self-renewal to prevent depletion of the stem cell pool in the BM. Nevertheless, external environmental signals must integrate with intrinsic molecular machinery to control the fate choices of individual HSCs. Such genetic mechanisms predetermine the behavior of HSCs and thus should limit the generation of HSC heterogeneity (Muller-Sieburg, 1996; Abkowitz, 1998; Chen, 2000).
The changes in gene expression over the course of hematopoietic differentiation are profound and complex. The number of differentially expressed genes is similar within hematopoiesis and across human tissues, suggesting comparable complexity. In fact, cell
10
fate specification involves the action of primary lineage determinants (transcription factors, TF) that initiate and resolve mixed lineage patterns of gene expression by activating lineage appropriate genes and repressing alternate lineage genes (Laslo, 2006). Knockouts or forced expression experiments on model organisms (e.g., mice,
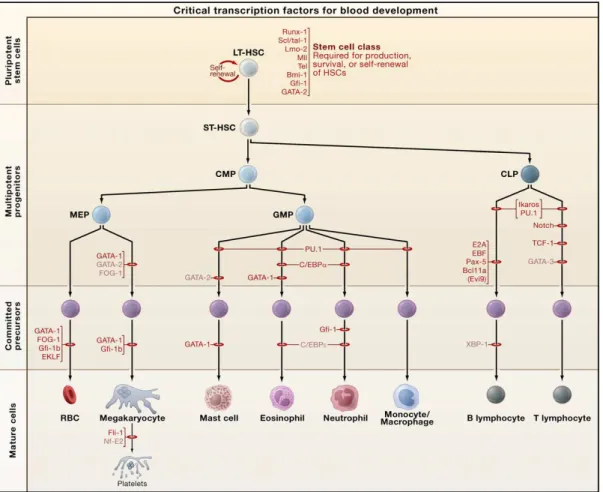
zebrafish, chicken, drosophila, xenopus) were performed to understand the functions of the critical transcription factors. In details, it is possible to see in Figure 2 the expression of the most important TF during the blood development. The knockdown of these genes leads to a block in differentiation, meaning a crucial role of the down-regulated gene, in the process of cell maturation
Figure 2: Transcription Factors during blood cell development.
Red bars indicate the stages at which hematopoietic development is blocked in the absence of a given transcription factor, as determined through conventional gene knockouts. Abbreviations: LT-HSC, long-term hematopoietic stem cell; ST-HSC, short-long-term hematopoietic stem cell; CMP, common myeloid
11
progenitor; CLP, common lymphoid progenitor; MEP, megakaryocyte/erythroid progenitor; GMP, granulocyte/macrophage progenitor; RBCs, red blood cells. Figure adapted from (Orkin and Zon, 2008)
In the last years, many studies focused on the analysis of gene regulatory networks that direct cell fate decisions within the hematopoietic system. Gene disruption studies have shown that GATA-1 is necessary for erythroid and megakaryocyte development whereas PU.1 is required for the generation of myeloid (macrophage and granulocyte) and lymphoid lineages (Scott, 1994; Orkin, 1998). Based on the findings that PU.1 and GATA-1 could inhibit each other’s molecular activities (Rekhtman, GATA-1999; Zhang, GATA-1999), it was proposed that this cross-antagonism is critical for generation of megakaryocyte/erythroid versus myeloid progenitors (Cantor, 2002).
Runx1 is a member of the runt family of transcription factors and plays an important role in definitive hematopoiesis (Wang et al., 1996). Knockout experiments in mice reveal that ablation of Runx1 means losing definitive erythroid, myeloid and lymphoid cells, indicating its importance in definitive hematopoiesis.Runx1 knockdown also leads to a decrease in the expression of cmyb, which belongs to the myb family of proto-oncogenes (Kalev-Zylinska, 2002; Burns, 2005; Gering, 2005). Further experiments on zebrafish reveal the importance of other genes during hematopoietic development. In fact in an early stage of development, cells co-expressing tal1, gata2, lmo2, fli1 and etsrp, appear to be indispensable for both endothelial and hematopoietic differentiation (Paik, 2010). A remarkable feature of transcription factors in the hematopoietic system is that the majority are involved in chromosomal translocations or with somatic mutations in human hematopoietic malignancies. Furthermore, experimental manipulation of the genes for such factors in mice often promotes malignancy; in fact hematopoietic cell fate is tightly associated with the origins of leukemias.
Although up to now, several studies have shown and unveiled many aspects concerning the molecular mechanisms regulating HSC self-renewal versus differentiation, but many other are still to be elucidate.
12
2. LEUKEMIA
Leukemia is defined as cancer of the blood forming system and characterized by proliferation of abnormal white blood cells, not fully developed and called blast or
leukemia cells in the bone marrow.
As a result, there is a loss of hematopoietic function due to the lack of mature granulocytes and monocytes as well as decreased red blood cell and platelet production. These abnormal precursor cells are capable of proliferation and cell division, but lack the capacity to differentiate (Borer, 1989). Leukemia can be divided into an acute and chronic form; acute leukemias are characterized by the clonal expansion of hematopoietic progenitor cells caused by a maturation arrest combined with enhanced proliferation resulting in a fast increase of immature blood cells. In contrast, in chronic leukemia, abnormal blood cells have a slower expansion of terminally differentiated cells that can still execute their normal function. A further division can be made depending on the lineage of the progenitor cell that is affected. When the leukemia originates from a lymphoid progenitor cell, it is named a lymphocytic or lymphoblastic leukemia, and when it originates from the myeloid lineage, it is called a myeloid or myelogenous leukemia. This identifies the 4 major types of leukemia: acute myeloid leukemia (AML), acute lymphoblastic leukemia (ALL), chronic myeloid leukemia (CML) and chronic lymphocytic leukemia (CLL). In children, chronic leukemias are very rare, ALL comprises the largest part (75-80%), and AML accounts for 15-20% of pediatric leukemias (Cordell, 1999).
2.1. Leukemia Stem Cell: an hallmark in AML
For several years uncontrolled proliferation was considered the distinguishing property of any malignant disease. The definition of a cancer stem cell (CSCs) is based on its functional properties, that is a malignant cell that has the ability to self-renewal and also to differentiate into multiple cell types to recapitulate the cell populations of the original tissue (Jondan, 2007).
13
The Cancer Stem Cell Model, also known as the Hierarchical Model proposes that tumors are hierarchically organized CSCs lying at the apex (Bonnet, 1997).In the cancer stem cell model, within the cancer population of the tumours there is a small subset of cancer cells, CSCs, which constitute a reservoir of self-sustaining cells with the exclusive ability to self-renew and maintain the tumor. Considering that. it is difficult to completely eradicate them during treatment, they have become an intriguing target for future cancer therapy.
Much of the evidence about the cancer stem-cell hypothesis has come from studies in hematologic malignancies. First experimental evidence, suggesting the existence of Leukemic stem cells (LSCs), resulted from observations made almost 40 years ago: it was demonstared by Park and collaborator in the 1971 that only 1 out of 10,000-100,000 mouse myeloma cells obtained from mouse ascites were able to form colonies in semi-solid medium (Park, 1971). Similarly, human leukemia cells from AML patients also formed colonies at very low frequency suggesting the presence of a small number of LSCs within the bulk of leukemic blasts (Sabbath, 1985; Griffin, 1986).
The first conclusive evidence for CSCs came in 1997. Bonnet and Dick isolated a subpopulation of leukemia cells that expressed surface marker CD34, but not CD38
(Bonnet, 1997). The authors established that the CD34+/CD38− subpopulation is capable of initiating tumors in NOD/SCID mice that were histologically similar to the donor.
(Bonnet, 1997; Lapidot, 1994).
It has been demonstrated that only a small number of LSCs can restore themselves and maintain the disease, whereas the majority of leukemia cells are in a more mature state unable to initiate the disease. It is also known as LSCs share analogous processes of the self-renewal and somehow differentiation of normal stem cells (Krause, 2007). In particular, it was discovered that similar signaling pathways involved in the control of self-renewal of HSCs are also key elements maintaining stemness in LSCs. These pathways include the well-known PI3K/Akt/mTOR (Fransecky, 2015), Wnt/beta-catenin (Wang, 2010; Lento, 2013), Hedgehog (Mar, 2011; Irvine, 2012), NF-kB (Kagoya, 2014; Zhou, 2015), Notch (Liu, 2013) and Bcl-2 (Domen, 2000; Lagadinou, 2013).
Although LSCs have the capacity for self-renewal and differentiation, evidence has shown that a substantial number of LSCs are found in a quiescent G0 phase (Guzman, 2001).
14
This could provide a possible reason for the failure of chemotherapeutics to eliminate LSCs as they commonly target rapidly cycling populations.
In AML, the origin of LSCs can be the result of accumulation of genetic disorders. It has been rationally postulated that LSCs arise from HSCs as the result of accumulation of oncogenic mutations, based on the observation that stem cells persist for long periods and undergo a number of cell divisions increasing the likelihood to obtain the minimum number of mutations necessary for malignant transformation (Lapidot, 1994; Bonnet, 1997; Warner, 2004). Alternatively, LSCs may also result from more differentiated progenitor cells that have reacquired the capacity for self-renewal and accumulated additional mutations for malignant transformation (Cozzio, 2003; Warner, 2004).
The intensive molecular investigation over the past two decades has shed new light on a large number of recurrent genetic lesions that have been identified to be associated with different subtypes of leukemias.
One of these aberrations can be attribute to MLL translocations. It is well documented that MLL gene rearrangements are able to transform myeloid non-self-renewing progenitor cells into LSCs in AML (Krivtsov, 2006; Passegue, 2006). In fact, generation of knock-in mouse models, as well as model of transduced BM experiments, has demonstrated how MLL fusion oncogenes are able to induce leukemic transformation in normal hematopoietic cells. First, Corral demonstrates that Mll–AF9 fusion knock-in mouse model, that constitutively expressed MLL-AF9, develops AML (Corral, 1996). Subsequently, Collins and colleagues developed a conditional knock-in model that produced Mll-Af9 by interchromosomal translocation, similar to the mechanism for translocation formation in human cells. This mouse model also had a propensity for leukemia development (Collins, 2000). A similar approach was used to develop a conditional Mll–Enl knock-in model, which also led to a rapid onset of AML (Forster, 2003). Moreover, important insights into MLL fusion-mediated leukemia development came from a study that assessed leukemogenic transformation of committed myeloid progenitors by MLL–ENL (Cozzio, 2003). A particularly important aspect of this work was the demonstration that mouse myeloid leukemias can originate not only from HSCs but also from committed myeloid progenitors that have no inherent self-renewal capabilities. As GMPs (Granulocite-Macrophage Progenitors), similar to all committed myeloid progenitors, do not possess self-renewal activity (Na Nakorn, 2002), MLL–ENL
15
expression appears to be able to re-activate at least some aspects of hematopoietic cell self-renewal. Expression of MLL–AF9 in GMPs leads to leukemogenic transformation of GMPs to LSCs (Krivtsov, 2006; Somervaille, 2006). Intriguingly,C/EBPα is a key myeloid transcription factor, which is required for the formation of granulocytic monocytic progenitors (GMPs) during normal hematopoiesis (Zhang, 2004). Ohlsson and colleagues, comparing human MLL-rearranged AML and normal progenitors gene expression profiles identified C/EBPα as a putative collaborator in MLL-rearranged AML. They found that deletion of C/EBPα rendered murine hematopoietic progenitors completely resistant to MLL-ENL–induced leukemic transformation, whereas C/EBPα was dispensable in already established AMLs. This data show that C/EBPα collaborates with MLL-ENL to activate a group of genes that, together with Hoxa9 and Meis1, are responsible for the early events that transform normal hematopoietic cells into malignant cancer cells. (Ohlsson, 2014). Therefore, these observations open important questions regarding how the deregulation of some genes and transcription factors with a role in stemness may contribute to the leukemia. Furthermore, seen that the balance of self-renewal and commitment to differentiation is dramatically deregulated in leukemic cells a better understanding at the molecular mechanism will be a fundamental source for molecular-based therapies in the future.
2.2 Characteristic of MLL-rearranged AML
Leukemias harboring rearrangements that involved the MLL (Mixed Lineage Leukemia) gene on chromosome 11q23 possesses unique biological and clinical characteristics. Genetic alterations in the MLL gene are associated with more than 70% of infant leukemias, but are less frequent in older children leukemias. Approximately 10% of adult leukemias bears MLL-translocations and MLL-related translocations are also commonly observed in secondary acute leukemias after topoisomerase inhibitor treatment (Felix CA, 1998). It is a disease characterized by an extremely dismal prognosis, in part due to its poor responses to the conventional therapeutic treatment, such as chemotherapy (Balgobind BV, 2011; Slany, 2009).
16
These aberrations juxtapose the amino-terminus of MLL with the C-terminus of the fusion partners, destroying the normal histone methyltransferase function of MLL adding the heterologous functions of the fusion partner (Figure 3).
MLL rearrangements generate a large variety of oncogenic MLL fusion proteins. To date, more than 60 different fusion partners have been identified, among which the most common ones are nuclear proteins with transcriptional activating activity (Krivtsov, 2007; Monroe, 2010; Yokoyama AL, 2010).
Wild Type (WT) MLL is a very large, 431 kDa protein with many different identified domains that mediate protein-DNA, protein-protein, or protein-RNA interactions. The MLL protein is proteolytically cleaved into an N- and a C-terminal fragment by the protease TASPASE1 (Hsieh, 2003). The MLL N-terminal fragment has a Menin binding region, 3 AT hooks, a repression domain, 4 PHD fingers, an atypical bromo-domain and a FYRN (Phenylalanine and Tyrosine Rich N-terminus) domain. The MLL C-terminal fragment has the transcriptional activation domain, a FYRC (Phenylalanine and Tyrosine Rich C-terminus domain).
The chromosomal break point region is just before PHD. Hence the fusion protein contains a portion of MLL N-terminus through the repression domain fused in frame with a C-terminal partner protein fragment. The rest of the N-terminus (from the PHD finger region to the TASPASE1 cleavage site) and the whole of MLL-C fragment is deleted in the MLL fusion protein as shown in Figure x.
Therefore, MLL fusions do not conserve the TASPASE1 cleavage site, which has been shown to cause resistance to cell cycle specific degradation (Liu, 2010).
Nevertheless, the deleted regions are frequently, but not always, represented in the reciprocal translocation product. In addition, the MLL gene is also involved in other aberrations such as partial tandem duplications (PTD) that occur in nearly 8% of AML patients with normal cytogenetic features(Figure 3).
17
Figura 3: Structure of MLL fusions and onco-MLL complex.
Intriguingly, only six frequent partner proteins (AF4, AF9, ENL, AF10, ELL, AF6) constitute the bulk (>80%) of all clinical cases of MLL leukemia (Meyer, 2009) (Table 1), whereas the remaining fusions proteins were cloned each from a few isolated, mostly adult patients. These MLL rearrangements can be classified into five groups, according to differences in cellular location and putative function (Table 1) (Krivtsov, 2007).
18
Table 1: Classification of MLL fusions. MLL rearranges with a large number of partner genes. Each rearrangement can be classified into 5 groups based on putative function and cellular location of the chimera. (Table rearranged from Krivtsov, 2007)
• The first group is characterized by fusion partner genes encoding the nuclear DNA-binding proteins AF4 (ALL1 fused gene from chromosome 4), AF9, AF10, ENL (eleven nineteen leukemia gene) and ELL (eleven nineteen lysine-rich leukemia gene). Taken all together, these aberrations account for more than 80% of MLL
translocation in leukemia patients.
• The second group involves cytoplasmic proteins such as AF6, AFX, GAS7, EEN, AF1p and Eps15. These fusion partners are found in more than 10% MLL rearranged leukemias. The common feature of this group of protein is coiled-coil oligomerization domains that are important for their transformation potential (So, 2003).
• The third group of fusion partners includes septins (SEPT2, SEPT5, SEPT6, SEPT9 and SEPT11), which are cytoplasmic proteins playing a role in mitosis and cytoskeletal structure (Hall, 2004). This group characterize only the 2% of MLL associated leukemias.
• The fourth group is characterized by the histone acetyltransferases p300 and CBP. MLL is fused with these proteins retaining histone acetyltransferase activity,
19
although TA domain, which mediates interaction of p300/CBP with wildtype MLL, does not exist in MLL fusions (Ida, 1997; Hall, 2004). These MLL fusions are also observed in 2% of MLL associated leukemias.
• The fifth group contains only MLL–partial tandem duplication (MLL–PTD). MLL–PTD results from a variable number of duplication of exons 5 to 12 that are inserted before exon 11 or 12. MLL–PTD is found in 4-7% normal karyotype AML patients and also often associated with trisomy 11 abnormality (Shiah, 2002)
Approximately 50% of pediatric AML cases with an MLL rearrangement consist of t(9;11)(p22;q23). The other 50% predominantly include t(6;11)(q27;q23), t(10;11)(p12;q23), t(11;19)(q23;p13.1) and t(11;19)(q23;p13.3) (Raimondi, 1999) as shown in Figure 4.
Figure 4: The distribution of translocation partners of MLL in pediatric AML. More than 60 different fusion partners of MLL have been identified, however t(9;11)(p22;q23) is the most common translocation that occurs in MLL-rearranged AML, accounting more than 40% of cases. Other frequent rearrangements are caused by the translocation t(10;11)(p12;q23), t(6;11)(q27;q23), t(11;19)(q23;p13) and t(1;11)(q21;q23) accounting for 13, 5, 11 and 3% of cases, respectively. Figure from (Balgobind, 2011)
20
Interestingly, over 80% of human AML containing MLL-rearrangements exhibit strong expression of
genes normally restricted to HSC including, HoxA7, HoxA9, HoxA10 and Meis1 (Afonja, 2000; Ferrando, 2003; Lawrence, 1999). Some of them, generally genes highly expressed in human AML with MLL-AF9 translocation, have been demonstrated to regulate survival and self-renewal of LSCs (Faber, 2009; Wong, 2007). Among them, HoxA9 and Meis1
represent the best-characterized MLL downstream target, which take part of a wider transcriptional program critical for self-renewal of MLL LSCs. Therefore, identification and functional characterization of target genes directly or indirectly regulated by MLL fusions, is pivotal to understand the origin of the MLL-related leukemia as well as the abnormal function of HSCs, which will be crucial in order to develop new molecular-based therapies.
3.
MLL
GENE
IS
REQUIRED
DURING
DEVELOPMENT
AND
HEMATOPOIESIS
MLL is the mammalian homolog of the Drosophila protein found in trithorax and is a member of the evolutionarily conserved trithorax group (trxG) family of proteins that positively regulate gene transcription and act antagonistically to the Polycomb group (PcG) proteins (Djabali, 1992; Gu, 1992; Ringrose, 2004). It belongs to the MLL family of SET domain containing histone methyltransferases that methylates histone H3 on lysine 4 (Milne, 2002; Shilatifard, 2012). The H3K4Me3 mark at gene promoters is associated with active transcription (Figure 5). In fact, MLL positively regulates the expression of target genes including multiple homeodomain (Hox) genes through H3K4 methylationof gene promoters (Milne, 2002). Hox genes are transcription factors that participate in the development of multiple tissues, including the hematopoietic system (Abramovich, 2005). Mouse models have conclusively shown Mll to have a crucial role in the control of
Hox gene expression and in the development of the axial skeleton and hematopoietic systems of mammals. In fact, homozygous deficiency for MLL results in early embryonic lethality at embryonic day 10.5 (E10.5), exhibiting multiple patterning defects, and
21
heterozygous deletion of MLL incurs homeotic transformation, indicating altered Hox
gene expression (Yu, 1995; Yagi, 1998; Ayton, 2001). Other experiments on Mll-deficient mice demonstrated that ESCs without Mll were unable to differentiate into any hematopoietic cell types in adult animals or in the fetal liver (Ernst, 2004a). Moreover, Ernst and colleagues, using an in vitro system, have demonstrated that the block in hematopoietic development was accompanied by global reduction in Hox gene expression and could be rescued by the reintroduction of individual Hox genes (Ernst, 2004).
In other experiments conducted in adult mice, the conditional ablation of Mll demonstrated its critical role to maintain adult hematopoietic stem cells (McMahon, 2007). Despite interaction with active transcription factors, MLL interacts also with multiple proteins that suppress gene expression, such as histone deacetylase 1 (HDAC1) and HDAC2, CYP33, PcG proteins PC2 and CTBP (Xia, 2003).
Besides its known role in embryonic development and hematopoiesis, MLL also orchestrates cell cycle progression at least through regulating the expression of cyclins and CDK inhibitors (Milne, 2005-B; Xia, 2005; Takeda, 2006; Kotake, 2009).
Figure 5: Structure of wild type MLL and the MLL complex. MLL is a very large, 431 kDa protein with many different identified domains that mediate protein-DNA, protein-protein, or protein-RNA interactions. MLL is part of a large chromatin modifying complex in which the SET domain of MLL has histone methyltransferase and histone acetyltransferase activity. During the formation of this complex, MLL
22
protein is proteolytically cleaved into an N- (MLL-N) and a C-terminal (MLL-C) fragment by the protease Taspase I. The MLL-N fragment has a Menin binding region, 3 AT hooks, a repression domain, 4 PHD fingers, and a CxxC domain. The MLL-C fragment has the transcriptional activation domain, and associates with histone acetyltransferases to ensure histone modification and methyltransferase activity. The chromosomal break point region is just before PHD.
3.1. MLL-rearranged AML is a leukemic stem cell disease
The mixed lineage leukemia is a subtype of leukemia that arises in particular in infants. It seems thus likely that the translocation occurs in uterus (Eguchi, 2006). In fact environmental factors to which the fetus is exposed in utero may have an important role in the development of MLL-rearranged AML, which seem to occur because of inappropriate non-homologous end joining of double-strand breaks (Aplan, 2006). Normal MLL associates with other factors to activate the transcription of many genes. The MLL-N is involved in target selection and is retained in the fusion proteins: for this reason it seems that MLL fusions will share many target loci with wild type MLL. This assumption has been confirmed for the clustered HOX homeobox genes that are under control of MLL as well as of MLL fusion proteins. Remarkably, it has been demonstrated that expression of an MLL fusion gene (MLL-AF9) GMPs induces a ‘‘HSC stem cell-like’’ signature that includes various HOX genes (Krivtsov, 2006). The acquisition of a stem cell signature by leukemic GMPs may contribute to self-renewal of leukemia stem cells. The
HOX factors, together with their cofactor Meis1, positively regulate the pool size of HSC and lineage-specific hematopoietic progenitors by promoting cellular proliferation as well as arresting cellular differentiation (Azcoitia, 2005; Lawrence, 2005; Wang, 2005). The dysregulation of Hox genes and Meis1 was directly linked to malignant hematopoiesis. In normal hematopoiesis, the expression pattern of the Hox genes and
Meis1 is dynamic, present at high levels in stem cells and early precursors and quickly down regulated as progenitors differentiate (Sauvageau, 1994). Therefore, a continuous ectopic HOX expression will block differentiation and create a rapidly proliferating pre-leukemic precursor pool (Figure 6). There are many other genes regulated by MLL
-23
rearrangements, but for certain, HOX deregulation is the most important factor for MLL fusion induced leukemogenesis (Milne, 2005; Zeisig, 2004; Horton, 2005; Ernst, 2004).
Figure 6: The role of HOX as well as Meis1 proteins in control of hematopoiesis. Transcription factors, as Hox genes and Meis1 control hematopoietic differentiation. Theexpression of these genes must be finely downregulated during differentiation. Therefore presence of ectopic factors, such as MLL chimeras, will deregulate expression of these genes causing a block of maturation and promoting a self-renewing of precursor cells (figure adapted from (Slany RK, 2009)).
There are accumulating evidence that suggest how the cell of origin , in which a genetic lesion occurs, can contribute to the emergence of distinct tumor subtype. In particular, Armstrong’s group demonstrates that there is a difference in MLL-AF9-mediated leukemia, depending if the cells of origin are HSCs or GMPs (Krivtsov, 2013). In particular,
24
they demonstrate how MLL-AF9 transformed HSCs are more aggressive than MLL-AF9 transformed GMPs. Functionally defined LSCs are immunophenotypically similar, but they have differences in gene expression and DNA methylation that are determined by the cell of origin. The Gene expression profile resulting from this study show how leukemia that originates from HSCs retains enhanced expression of a set of “stem cell associated” genes. Therefore, the expression of MLL-AF9 in GMPs activates a stem cell associated program, but the expression of MLL-AF9 in HSCs allows maintenance of a more extensive stem cell-derived program that influences the LSCs behavior. All these findings indicate that many genes involved in self-renewal process in normal HSCs are shared in LSCs and allow the maintenance of a stem cell profile in MLL-related leukemia. Thus, investigating genes involved in the differentiation block is a fundamental in order to understand the basis of the aggressiveness of this disease.
4. ZNF521
The Zinc Finger Protein (ZNF521) (also known as early hematopoietic zinc finger protein (EHZF); EVI3 or Zfp521 in mouse) is a transcription factor with 30 Krüppel-like zinc finger (ZF) domains and contains an N-terminal 12-amino acid motif that interacts with the nucleosome remodelling and histone deacetylation (NuRD) complex, which is conserved among other ZF transcriptional repressors, including FOG-1, FOG2, BCL11A and SALL family members (Bond, 2004; Lin, 2004), Initially, ZNF521 was identified in a comparative analysis of the transcriptional profile between human CD34+ hematopoietic progenitors and mature peripheral blood leukocytes (Bond HM, 2004). This analysis has revealed that ZNF521 is abundantly expressed in human CD34+ progenitors and then declines rapidly during cytokine-driven differentiation (Bond, 2004). However, it has been shown that ZNF521 is also widely expressed all along the body including brain, muscle, heart, kidney, spleen, lymph nodes, placenta, thymus, fetal liver and bones (Bond, 2004). In particular, it is highly expressed in mesenchymal condensations, in prehypertrophic chondrocytes in the growth plate as well as in osteoblasts and osteocytes during endochondral bone development (Hesse, 2010; Liu TM, 2013). In all these cell types, it
25
appears to control cell differentiation, as well as the function of mature cells by modulating the activity of specific transcription factors. Previous studies in hematopoietic cells have shown that ZNF521 negatively regulates Early-B Cell Factor 1 (EBF1) activity via its C-terminal domain, thus influencing B cell differentiation (Mega, 2011). It has been also shown that ZNF521 through its NuRD interaction suppresses the GATA-1 activity during erythropoiesis (Hong, 2005). Being that GATA-1 a master regulator of erythroid cell maturation by activating erythroid-specific genes and repressing genes associated with the undifferentiated state, the activity of ZNF521 may be critical for the differentiation of hematopoietic progenitors.
Recently studies, have also demonstrated that other transcription factors such as PU.1 and HOXC13, can synergistically cooperate to regulate ZNF521 expression (Yu, 2016). Yu and colleagues demonstrate that transgenic mice over-expressing Hoxc13 and Pu.1 also have increased Zfp521 expression in the fetal liver, the site of B-cell differentiation during development.
Thus, in a hematopoietic context these observations lead to speculate that ZNF521 could play a critical and specific role in human hematopoiesis. This latter, it is also corroborate by the observations that ZNF521 expression is frequently deregulated in hematopoietic malignant cells. Early studies have shown that ZNF521 mRNA is highly expressed in several AML samples (FAB M2, M3 and M4) as well as CMLs (Bullinger, 2004; Bond, 2004). Intriguingly, in a study conducted on 363 adult acute leukemia was found that
MLL rearrangements associate with high levels of ZNF521 (Kohlmann, 2005). Moreover, it has been described in a case of B cell-progenitor ALL, a translocation resulting in the fusion of PAX5 gene with ZNF521 gene (Mullighan, 2007) and most recently was identified ZNF521/Zfp521 as a partner to develop B-lineage ALL positive for both E2A-PBX1 and E2A-HLF chimeric gene product (Sera, 2016).
Collectively, these findings demonstrate that a deregulated expression of ZNF521 may contribute to leukemic transformation
27
AIM OF THE THESIS
MLL-fusion proteins are potent inducers of oncogenic transformation, and their expression is considered to be the main oncogenic driving force in approximately 10% of AML patients. These oncogenic fusion proteins activate specific set of genes, of which the overexpression of hoxa9 and MEIS1 has demonstrated to play a synergistic causative role in MLL leukemogenesis. Since that both HOXA9 and MEIS1 play an important role in the HSC self-renewal/proliferation, we asked whether others transcriptional regulators of HSCs might have relevance in MLL-induced leukemia.
By gene set enrichment analysis (GSEA) we compared the publically datasets for genes normally upregulated in HSCs (CD133+) to our pediatric AML patients. The use of GSEA analysis allowed us to identify ZNF521 as a new gene among the well-known genes such as HOXA9 and MEIS1 in AML patients carrying MLL rearrangements. ZNF521 encodes for a transcription factor that in normal and malignant hematopoiesis has initiate to be studied and its misexpression expression have been causally linked to acute leukemia. The aim of the present study was to establish whether the identified ZNF521 gene is required in MLL leukemogenesis. In order to achieve this, we investigated the role of ZNF521 in MLL-rearranged AML, through the study of the knockdown of ZNF521 in a series of human MLL-rearranged cell lines and patient-derived xenograft cells. We analyzed the contribution of ZNF521 to leukemogenesis by a series of functional and mechanistic studies and investigated the ZNF521-dependent molecular pathway using as model THP-1 AML cell line.
29
MATHERIALS AND METHODS
1. PATIENT SAMPLES AND CELL LINES
All of the pediatric AML patient samples were obtained at the time of diagnosis from the University-Hospital of Padua and stratified according to the AIEOP AML 2002/01 protocol AML 2002/01 (Pession, 2013). Patient characteristics are listed in Table 1.
Non-MLL-rearranged (n = 34) MLL-rearranged (n = 16)
normal karyotype 13 (38%) t(10;11)(MLL-AF10) 5 (31%) t(15;17)(PML-RARα) 6 (18%) t(9;11)(MLL-AF9) 5 (31%) inv16(CBFB-MYH11) 3 (9%) t(6;11)(MLL-AF6) 3 (19%) t(8;21)(AML1-ETO) 8 (23%) 11q23 others * 3 (19%) FLT3-ITD + 4 (12%)
Table 1: Genotype features of the 50 childhood AML patients analyzed for ZNF521 expression by
qRT-PCR analysis.
*t(11;19)(MLL-ENL) n=1; t(11;19)(MLL-ELL) n=1; t(X;11)(MLL-SEPTIN6) n=1
Seven BM samples from healthy donors were obtained as control. All human myeloid cell lines (THP-1, NOMO-1, OCI-AML4, ML2, HL60, K562, Kasumi-1, NB4, U-937, SEM and REH) were obtained from DSMZ (Braunschweig, Germany) and 293T cells were obtained from ATCC (Manassas, VA, USA). All cell lines were maintained under standard conditions suggested by the manufacturer.
30
2. QUANTITATIVE REAL TIME PCR
Total RNA was extracted with Trizol reagent (Invitrogen) and reverse transcribed into cDNA using the Superscript III First-Strand Synthesis System (Life Technology). The mRNA levels of ZNF521, PU.1, C/EBPα, HOXA9 and MEIS1 were measured by quantitative RT-PCR (qRT-RT-PCR) with SYBR green on an AB 7900HT real time system (Applied Biosystem) using the comparative Ct method and the GAPDH gene expression as internal control
(Schmittgen, 2008). The primer sequences for quantitative qRT-PCR are listed in Table 2.
Sequence of the primers used in this study
Primers for qRT-PCR
Gene name
Forward 5’ → 3’ Reverse 5’→ 3’
GAPDH AGGGCTGCTTTTAACTCTGGT CCCCACTTGATTTTGGAGGGA ZNF521 ACTGAAGTTTGGCAGGAGAG TGGGATATTCAGGTTCATGTT PU.1 AGAAGACCTGGTGCCCTA CCAGTAATGGTCGTCATGGC C/EBPα AACATCGCGGTGCGCAAGAG TTCGCGCTCAGCTGTTCCA HOXA9 AAAACAATGCTGAGAATGAGAGC TATAGGGGCACCGCTTTTT MEIS1 TGATCAGCAGGCAAAGATTG CATACTCCCTGGCATACTTTG
Primers for ZNF521 promoter^
Gene name Forward 5’ → 3’ Reverse 5’→ 3’ ZNF521 P1 AGCTGCTAGCACATTAAACTATACCAAAGA AATCCA AGCTAAGCTTAAAACTATACTCAGTTCCCAGT TCC ZNF521 P2 AGCTGCTAGCTCCATGTGACGTTCTTAAATG C AGCTGCTAGCTTAGCCACTGCAGAAAGGTAA A ZNF521 P3 AGCTGCTAGCTGACGTTCTCATTGTAGCTG GT AGCTAAGCTTATGAAGCCAAAGCCATCATC ZNF521 P4 AGCTGCTAGCTCCAGGCAGTTTACAGGTTA GA AGCTGCTAGCCTGTACGTAATCACTGAGGAA ATCAT ZNF521 P3.1 AGCTGCTAGCTGACGTTCTCATTGTAGCTG GT AGCTAAGCTTATGAAGCCAAAGCCATCATC ZNF521 P3.2 AGCTGCTAGCAAGTTGCTGCATTCTGCTCA AGCTAAGCTTTTTCCTTTCGTGTGGTAGCC ZNF521 P3.3 AGCTGCTAGCTATCACACATAACTTGGGAC CAC AGCTCTCGAGGTGGAAATTAAGAGATTCAGA ATACG
31
Primers for ChIP analysis
Gene name
Forward 5’ → 3’ Reverse 5’→ 3’
HOXA9 AATGCGATTTGGCTGCTTTTTTATGGC TCAAATCTGGCCTTGCCTCTG ZNF521
p3.3
ACACATAACTTGGGACCACAC GTCTAACCTGTAAACTGCCTGGA
shRNA sequences in Mission shRNA pLKO.1-puro-CMV-TurboGFP
shZNF52 1_9004 GTACCGGATCACTTGAAGATCCACTTAACTCGAGTTAAGTGGATCTTCAAGTGATTTTTTTG shZNF52 1_9710 CCGGACAAGTTGCAGCAGCATATTTCTCGAGAAATATGCTGCTGCAACTTGTTTTTTG shScram GGACAAGTTGCAGCAGCATATTTCTCGAGAAATATGCTGCTGCAACTTGTTTTTT
Table 2: List of Primers used in this study. ^The restriction enzyme sites are underlined.
3. LENTIVIRAL SHRNA VECTOR, TRANSDUCTION AND FACS-SORTING
For knockdown studies, two shRNAs against ZNF521 and a control scrambled shRNA (shScram) were used (Mission pLKO.1-puro-CMV-TurboGFP system, Cat Number TCRN0000229710 and TCRN0000229004, Sigma-Aldrich) (see Table M2 for shRNA sequences). Lentiviral cell transduction was performed as described previously (Indraccolo, 2002). After culture in fresh medium and 96 hours after infection, GFP-positive cells were sorted using a MoFlo XDP cell sorter (Beckman Coulter) and used for further experiments. Alternatively, cells were gated for GFP expression and subjected to flow cytometry analyses. ZNF521 knockdown efficiency was measured by qRT-PCR and western blot analyses.
32
4. PLASMIDS CONSTRUCTS, TRANSIENT TRANSFECTION AND
LUCIFERASE ASSAY
pMSCV-neo-Flag-MLL-AF9, MSCV-PML-RARA-IRES-GFP, MSCV-AML1-ETO-GFP, pCMVMLL-3xFlag and pCMVMLL-ENL-3xFlag have been previously described (Abdul-Nabi, 2010; Liu, 2007; Tan, 2011). Flag-tagged proteins were previously verified by Western blot with anti-Flag M2 antibody (Sigma), as well as the GFP-tagged proteins by expression of green fluorescence protein (GFP) in vitro.
Wild-type ZNF521 promoter from -4493 to + 65 relative to the transcription start site (TSS) was divided in four genome fragments [P1 3810 to 4993), P2 2560 to 3970), P3 (-1060 to 2729) and P4, +62 to -1260)] and each one was isolated from a genomic DNA obtained from a pool of buffy coat by PCR amplification using primer pairs containing specific restriction sites. All PCR products were purified, sequenced and cloned in TOPO TA cloning kit (Invitrogen). P1 and P3 plasmids were XhoI/HindIII-digested and the fragments were recloned into XhoI/HindIII sites downstream of the luciferase gene of the pGL42.8 luciferase vector (Promega) to generate ZNF521P1-luc and ZNF521P3-luc
constructs, respectively. Similarly, P2 and P4 plasmids were NheI/XhoI-digested and the fragments inserted into NheI/XhoI sites of pGL42.8 vector to generate ZNF521P2-luc and
ZNF521P4-luc constructs, respectively. The genome fragment P3 (-1060 to 2729) was subdivided in three smaller parts [P3.1 2101 to -2729), P3.2 1533 to -2143) and P3.3 (-1060 to -1610)] and each part was PCR amplified from genomic DNA using primers containing specific restriction sites and cloned in TOPO TA vector. P3.1 and P3.2 plasmids were XhoI/HindIII-digested and the fragments were recloned into XhoI/HindIII sites of pGL42.8 vector to generate ZNF521P3.1-luc and ZNF521P3.2-luc constructs. P3.3 plasmid was NheI/XhoI-digested and the fragment recloned into NheI/XhoI-digested pGL42.8 to generate ZNF521P3.3 construct. (Primers used for genomic DNA amplification are listed in Table M2).
For luciferase assay, 293T cells were cotransfected with 0.5 µg of the reporter plasmid, 1
µg of expression plasmid or empty vector and 0.5 µg of Renilla luciferase reporter vector (Promega) as internal control for normalization of transfection efficiency, for a total of 2
33
transfection using a Dual-Luciferase reporter assay system (Promega) and the Victor3 TM 1420 Multilabel Counter (PerkinElmer). Data are presented as the mean ratio for triplicate experiments.
5. CHROMATIN IMMUNOPRECIPITATION (CHIP) AND PCR DETECTION
ChIP assay was performed using the Imprint Chromatin Immunoprecipitation kit (Sigma), according to the manufacturer's protocol with minor modifications. Briefly, 293T cells (3.5 × 10⁶ cells) were transfected with 10 µg of Flag-MLL-AF9 or Flag-MLL-ENL expression plasmids. 48 hours post transfection, were cross-linked with 1% formaldehyde (Sigma) for 15 minute at room temperature. Subsequently, the lysed cells were isolated and sonicated on ice to shear DNA into fragments of 200 bp to 1 kb. Then, the chromatin complexes were incubated into pre-treated Stripwells (Sigma) with anti-Flag M2 monoclonal antibody (Sigma), or normal mouse IgG (Sigma) as indicated. The input DNA was isolated from sonicated lysates before immunoprecipitation as a positive control. Purified DNA was then resuspended in TE buffer (10 mM Tris-HCL and 1 mM EDTA, pH 8.0) for PCR. ChIP assay from 2 x10⁶ of MLL-AF9-expressing NOMO-1 cells or HL60 cells was performed as above reported using a N-terminal MLL monoclonal antibody (Santa Cruz Biotechnology) or a C-terminal MLL polyclonal antibody (Sigma) or a mouse IgG (Sigma) as indicated. Purified ChIP DNA was amplified by regular PCR. Primers amplifying the ZNF521 promoter region and the HOXA9 promoter region used for the ChIP PCR are listed in Table 2.
6. MICROARRAY ANALYSIS
Total RNA from sorted THP-1 cells transduced with shRNAs was isolated using Trizol as above reported and processed for microarray analysis using the Affymetrix GeneChip
34
3’IVT express Kit (Affimetrix) after RNA quality control using Agilent 2100 Bioanalyzer (Agilent). Gene expression profile was performed using a Human Genome U133 2.0 Plus chip (Affymetrix), as previously described (Bresolin, 2010). The data were RMA-normalized using R software (http://www.r-project.org/) with BioConductor package (www.bioconductor.org). Shrinkage t test was used to identify differentially expressed genes between shScram and shRNA ZNF521 THP-1 cells selected with a local FDR <0.05 (FDR). Hierarchical clustering analyses were performed using Euclidian distance and Ward’s methods. Gene set enrichment analysis (GSEA) was performed using GSEA version 2.0 software (Broad Institute; http://www.broadinstitute.org/gsea) with genes ranked by difference of class and statistical significance by 1000 gene set permutations. Gene set permutation was used to enable direct comparisons between shScram and shRNA ZNF521 results (<7 replicates). Median of probes was used to collapse multiple probe sets to a single value per gene for each sample. Gene sets with a FDR <0.05 were declared to be statistically significant. The microarray gene expression data have been submitted in NCBI’s Gene Expression Omnibus (GEO, http://www.ncbi.nlm.nih.gov/geo/) under accession GSE79110
7. WESTERN BLOT AND IMMUNOFLUORESCENCE STAINING
Western blot and immunofluorescence were performed using standard procedures. The antibody against ZNF521 was from Novus Biologicals (72009). Gamma-Tubulin (T6557), Actin (A5316), Flag M2 (F3165) antibodies were from Sigma Aldrich. For immunofluorescence analysis, antibody against CDKN1A/p21 (2947S) was from Cell Signaling and antibody against CDKN1B/p27 (610241) was from BD Biosciences.
For immunofluorescence analysis, 5 × 10⁴ FACS-sorted cells were harvested 7 days after transduction and cytocentrifuged onto slides at 500 rpm for 5 minutes (Cytospin 4 cytocentrifuge, Thermo Scientific). Cells were fixed in 4% formaldehyde for 15 minutes, permeabilized with PBS containing 0.1% Triton X-100 (Sigma) for 10 minutes, and blocked with 5% BSA in PBS for 30 minutes at room temperature, followed by incubation
35
with primary antibodies in 1% BSA-PBS overnight at 4°C. The following day, slides were washed with PBS and incubated with the secondary antibody Alexa Fluor 594 Goat Anti-mouse IgG (H+L) (1:2000, Life Technologies) for 1 hour at room temperature. Nuclei were stained with 4′,6-diamidino-2-phenylindole (DAPI, 1:10000; Sigma) for 13 minutes. A minimum of 50 cells/sample was scored in three different fields in at least three independent cytospin preparations. Cells were visualized and counted by a confocal microscope (Vico, Eclipse Ti80, Nikon) equipped with a digital camera. Images were captured with ImageProPlus software (Media Cybernetics).
8. CELL FUNCTION ANALYSIS
8.1 Cell viability and clonogenic assay
Viability assay was performed using the colormetric diphenyltetrazolium bromide (MTT) Cell Proliferation Kit I (Sigma) and measured via Victor 3 Microplate reader (PerkinElmer). Briefly, FACS-sorted GFP positive cells (5 × 10⁴) from cell lines and/or ex vivo primary patient-derived cells were collected 4 days after transduction and seeded (in triplicates) in 96-well culture plate. At a designated time point, cell viability was measured by adding 10 µl of MTT solution (5 mg/ml) to each well. After 3 hours of incubation, the absorbance (OD) of each well was measured at 570 nm using a microplate reader (Victor 3; PerkinElmer). Cell proliferation was calculated by the following formula: (mean OD ZNF521-shRNA wells)/(mean OD shScram-control wells) × 100%. For the clonogenic assay, 2 × 10³ cells at day 4 of transduction were FACS-sorted and then resuspended and seeded in methylcellulose medium (MethoCult H4534; Stem Cell Technologies). After 14 days, colonies were counted under 20x magnification with a stereoscope after exposure to MTT (Sigma) for 3 hours at 37° C.
36
8.2. Cell cycle, apoptosis assay
Cell-cycle analysis was performed by flow cytometric analysis of propidium iodide-stained cells at 7 days after shRNA transduction. Briefly, 2.5 × 10⁵ cells were washed in PBS and then fixed in 70% ethanol and put at -20°C overnight. The samples were rehydrated in cold PBS, treated with lysis buffer containing RNase and 0.1% Triton X-100 (Sigma) and stained with propidium iodide (PI). Cell cycle distribution was measured on gated GFP-positive cells. Analyses were performed using the Cytomics FC500 flow cytometer (Beckman Coulter, Brea, CA) and MultiCycle Cell Cycle Analysis Software (Phoenix Flow Systems, San Diego, CA). A minimum total of 10.000 gated events were collected for each sample. Cell death was measured at day 4 and day 7 after transduction using AnnexinV-Fluos staining kit (Invitrogen) and analyzed by flow cytometry. Briefly, 2.5 × 10⁵ cells were resuspended in 100 µl of 1x annexinV-binding buffer and incubated with 1 µl of allophycocyanin-conjugated annexinV (Invitrogen) and 1 µl of DAPI (1:10000, Sigma) for 15 minutes at room temperature. The apoptotic cells (AnnexinV+/DAPI-) were determined on gated GFP-positive cells as described above.
8.3. Expression of CD11b and CD14, morphological analysis and cell
differentiation induction
PE-conjugated anti-CD11b (BD Biosciences) and Phycoerythrin-Cyanin (PC7) anti-CD14 (Beckman Coulter) were used to analyze myeloid differentiation. Briefly, on day 7, 2 × 10⁵ transduced cells were harvested, washed and labeled with conjugated antibodies in PBS for 15 minutes in the dark. Then, cells were washed and analyzed by flow cytometry of gated GFP-expressing cells as previously reported. The expression of the cell surface markers was analyzed with a Cytomics FC500 flow cytometer (Beckman Coulter, Brea, CA). Cell morphology was determined on cytospin preparations. Four days after transduction, GFP positive cells were FACS-sorted and placed in culture. Three days later (7 days post-transduction), 0.5 × 10⁵ cells were harvested and washed in PBS buffer and
37
spun onto slides for 5 minutes at 500 rpm using a Shandon CytoSpin4 cytocentrifuge and the slides were stained with a Wright-Giemsa stain. Images were taken at 40x magnification using a Nikon microscope (Vico, Eclipse Ti80, Nikon) and acquired with ImageProPlus software (Media Cybernetics). For the differentiation induction with ATRA (1µM; Sigma) or Securinine (15 µM; Sigma), after 3 days of treatment cells were collected and analyzed for cell morphology, level of ZNF521 transcripts and protein expression as previously described.
9. STUDIES WITH AML PATIENT-DERIVED XENOGRAFT CELLS
Primary MLL-AF9-expressing cells were obtained from BM samples of diagnosed AML pediatric patients stored in the BioBank of the laboratory of Pediatric Hematology of the University Hospital of Padua, (Italy) according to the guidelines of the local ethics committee. Initial AML xenografts were established by tail vein injection with 8 × 10⁶ primary cells suspended in 300 μl of PBS in 6- to 8-week-old NSG mice, which were purchased from Charles River (Wilmington, MA, USA). All animal experiments were performed in accordance with institutional guidelines and established protocols (Agnusdei, 2014). Engraftment was monitored by weekly blood collections and flow cytometry analysis with antihuman CD45 (BD Biosciences). The engraftment rate was defined by the number of days required for the transplanted human CD45+ cells to reach at least 20% in the peripheral blood. Human leukemic cells from the spleens of engrafted mice were collected and cultivated in RPMI supplemented with 10% Human serum (Euroclone), antibiotics, and cytokines SCF, FLT-3L and TPO (40 ng/ml for each), IL-3 and IL-6 (20 ng/ml for each). (All cytokines were obtained from Inalco, Milan, Italy).For ex vivo experiments, two independent biological replicates were performed.
38
10. DATA ANALYSIS
Data are presented as mean ± SD. Each experiment was performed at least 3 times, except where stated otherwise. The differences were examined using 2-tailed t test, Mann–Whitney U-test or kruskal-Wallis one-way analysis of variance followed Dunn’s test as appropriate (GraphPad Prism; GraphPad). Results were considered significant at
39
RESULTS
1.
GSEA analysis of upregulated stemness genes in pediatric AMLOne of the most important features of AML carrying MLL rearrangements is that to show an up-regulation of stem cell-associated genes including HOXA and MEIS1. In order to identify other uncharacterized stemness genes, we interrogated public signatures based on CD133+ cell populations isolated from normal/healthy versus gene expression profiles of 82 pediatric AML samples (61 with normal MLL and 21 with MLL rearrangements) previously analyzed. As shown in Figure X, among the canonical upregulated genes, whose overexpression are hallmarks of MLL-rearranged AML, we observed the ZNF521
gene. Interestingly, ZNF521, which encodes a transcription factor, is a marker of HSC (Matsubara, 2009) with potential role in the regulation of HSC homeostasis, but with unknown function in MLL-mediated leukemogenesis.
40
Figure 7. Gene Set Enrichment Analysis (GSEA). Heat map displaying the Jaatinen hematopoietic stem cell_upregulated gene in CD133+ versus CD133- normal cells in 82 AML pediatric samples including 21 MLL-rearranged. among the top five most differentially expressed genes (red box), ZNF521 appears among the genes most upregulated in aml samples with MLL rearrangements (gray lanes) than AML sample without MLL rearrangements (yellow lanes).
2. ZNF521
IS ABERRANTLY OVEREXPRESSED IN PEDIATRIC
MLL
-REARRANGED AML
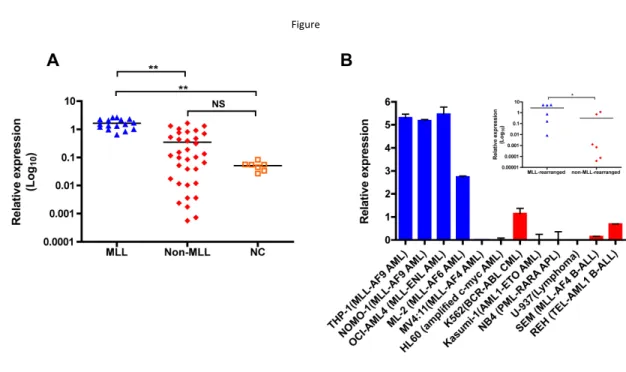
Previously, by use of microarray analysis, we found a frequent ZNF521 overexpression in pediatric AML with MLL rearrangements (Pigazzi, 2011). To validate these data and analyze the relationship between ZNF521 expression and distinct MLL-fusion genes, we performed quantitative real-time PCR (qRT-PCR) in an independent cohort of 50 pediatric AML patients (16 MLL-rearranged and 34 non-MLL-rearranged; Table 1) and 7 normal bone marrow (BM) controls. We found that ZNF521 was expressed at significantly higher
41
level in AML patients with MLL rearrangements compared to non-rearranged AML and normal controls (P<0.001, Figure 8).
Figure
Figure 8. ZNF521 is aberrantly overexpressed in MLL-rearranged AML. (A) qRT-PCR for the expression of ZNF521 in 16 MLL-rearranged AML (MLL), 34 non-MLL-rearranged AML (Non-MLL) and 7 normal control (NC). The results are normalized to GAPDH and analyzed by 2−ΔCt method. NS, not significant, **P<0.001, kruskal-Wallis test. (B) qRT-PCR analysis of ZNF521 expression in a representative panel of human leukemic cell lines normalized to GAPDH and analyzed by 2−ΔCt method. Data are represented as mean ± SD of three independent experiments. y axis is linear. Inset, dot plots of mean ZNF521 mRNA levels in MLL15 rearranged and non-MLL-rearranged cell lines from data presented in (B). *P<0.05, Mann–Whitney U-test.
The analysis of ZNF521 expression between the most frequent MLL rearrangements detected in pediatric AML did not reveal significant difference based on MLL fusion partners (data not shown). In addition, we analyzed the expression of ZNF521 in 6 MLL -rearranged and 6 non-MLL-rearranged human leukemic cell lines. Similarly, leukemic cell lines with MLL rearrangements, with the exception of those carrying MLL-AF4 fusion
42
transcripts, showed significantly higher ZNF521 mRNA levels compared to cell lines with other abnormalities (P<0.05, Figure RB). Thus, our data indicate that ZNF521 is likely involved in MLL-mediated transformation in AML.
3.
ZNF521
DEPLETION REDUCES CELL VIABILITY AND CAUSES CELL
CYCLE ARREST WITHOUT INDUCING APOPTOSIS OF
MLL
-REARRANGED
AML CELL LINES.
To determine whether ZNF521 is functionally important in MLL-rearranged AML, we first examined the effects of ZNF521 knockdown on the cell proliferation using a panel of human MLL-rearranged AML cell lines, including, THP-1, NOMO-1 (both expressing MLL-AF9), ML-2 (expressing MLL-AF6) and OCI-AML4 (expressing MLL-ENL). To suppress
ZNF521, we used GFP-tagged lentiviral vectors expressing anti-ZNF521 shRNAs (ZNF004 and ZNF710) or a non-targeting shRNA sequence (shScram). After assessing transduction efficiency by flow cytometry (range 30-80%) (Figure 9 and data not shown), GFP-positive cells were sorted and maintained under standard cell culture conditions for subsequent analysis.
43
Figure 9. Flow cytometry analysis and gating strategy of shRNA transduced human MLL-rearranged AML
cell lines. Transduced cell lines were GFP-sorted at day 4 and analyzed or maintained in culture for further evaluation. Otherwise transduced cells were analyzed after being gated for the GFP+ cells. Representative flow cytometry dot plots of gated GFP+ cells after transduction with GFP lentiviral expressing shRNA against ZNF521 (ZNF004 and ZNF710) or expressing non-targeting shRNA sequence (shScram) are presented. The selected area indicates the sorting gates and includes the percentage of cells in each sorting gate. Gates were set to collect GFP high and GFP low-expressing cells. SSC, side scatter.
44
As expected, in all four cell lines downregulation of ZNF521 varied between 60% and 75% compared to ZNF521 mRNA expression in shScram-transduced cells, and this correlated with a decrease in ZNF521 protein amount (Figure 10).
Figure 10. shRNA-mediated knockdown of ZNF521 in MLL-rearranged AML cell lines. (A) ZNF521 mRNA levels evaluated by qRT-PCR on GFP+ sorted cells after 4 days of transduction with shScram and ZNF521 shRNAs (ZNF004 and ZNF710). The results are relative to shScram-transduced cells, normalized to GAPDH and analyzed by 2−ΔΔCt method