Title 1
Comparative performance and external validation of the multivariable PREDICT Prostate tool for 2
non-metastatic prostate cancer: A study in 69,206 men from Prostate Cancer data Base Sweden 3
(PCBaSe) 4
Authors 5
David Thurtle, Ola Bratt, Pär Stattin, Paul Pharoah* & Vincent Gnanapragasam* 6
7
David Thurtle, Academic Urology Group, University of Cambridge 8
Ola Bratt, Department of Urology, Institute of Clinical Science, Sahlgrenska Academy, University of 9
Gothenburg, and Sahlgrenska University Hospital, Region Västra Götaland, Gothenburg, Sweden 10
Par Stattin, Department of Surgical Sciences, Uppsala University, Sweden 11
Paul Pharoah, Department of Cancer Epidemiology, University of Cambridge 12
Vincent Gnanapragasam, Academic Urology Group, University of Cambridge 13
14
David Thurtle, Academic Urology Group, University of Cambridge, Norman Bleehan Offices, 15
Addenbrookes Hospital, Hills Road, Cambridge, CB2 0QQ 16 [email protected] 17 +441223256251 18 19 20
Title 21
Comparative performance and external validation of the multivariable PREDICT Prostate tool for 22
non-metastatic prostate cancer: A study in 69,206 men from Prostate Cancer data Base Sweden 23
(PCBaSe) 24
Authors 25
David Thurtle, Ola Bratt, Pär Stattin, Paul Pharoah* & Vincent Gnanapragasam* 26 27 *Equal contribution 28 Abstract 29 Background 30
PREDICT Prostate is an endorsed prognostic model that provides individualised long-term prostate 31
cancer-specific and overall survival estimates. The model, derived from UK data, estimates potential 32
treatment benefit on overall survival. In this study we externally validated the model in a large 33
independent dataset, and compared performance to existing models and within treatment groups. 34
Methods 35
Men with non-metastatic prostate cancer and PSA <100 ng/ml diagnosed between 2000 and 2010 in 36
the nationwide population-based Prostate Cancer data Base Sweden(PCBaSe) were included. Data 37
on age, PSA, clinical stage, grade group, biopsy involvement, primary treatment and comorbidity 38
were retrieved. 69,206 men were included with 13.9 years median follow-up. 15-year survival 39
estimates were calculated using PREDICT Prostate for prostate cancer-specific mortality(PCSM) and 40
all-cause mortality(ACM). Discrimination was assessed using Harrell s concordance c-index in R. 41
Calibration was evaluated using cumulative available follow-up in Stata (TX, USA). 42
Results 43
Overall discrimination of PREDICT Prostate was good with c-indices of 0.85(95% CI 0.85-0.86) for 44
PCSM and 0.79(95% CI 0.79-0.80) for ACM. Overall calibration of the model was excellent with 45
25,925 deaths predicted and 25,849 deaths observed. Within the conservative management and 46
radical treatment groups c-indices for 15-year PCSM were 0.81 and 0.78 respectively. Calibration 47
also remained good within treatment groups. The discrimination of PREDICT Prostate significantly 48
outperformed the EAU, NCCN and CAPRA score for both PCSM and ACM within this cohort overall. 49
A key limitation is the use of retrospective cohort data. 50
Conclusions 51
This large external validation demonstrates that PREDICT Prostate is a robust and generalisable 52
model to aid clinical decision making. 53
Abstract word count 54
252 (MS Word) 55
Manuscript word count 56
2721 (MS Word) 57
Keywords 59 Prostate Cancer 60 Prognosis 61
Prostate cancer-specific mortality 62 PCSM 63 Survival 64 Overall mortality 65 Competing Risks 66 Decision-aid 67 68 69
Background 70
Prostate cancer represents a growing burden on health care globally, with increasing numbers and 71
proportions of men presenting with non-metastatic prostate cancer (PCa) (1). Alongside this, there 72
has been increased confidence in the use of conservative management (active surveillance and 73
watchful waiting) (2). Understanding disease prognosis to guide treatment decision-making is 74
therefore of great importance. However, until recently no high-quality individualised model for 75
survival existed. 76
Using data from over 10,000 UK men, we have previously published an individualised prognostic 77
model for cancer-specific and overall survival called PREDICT Prostate’ (3). PREDICT Prostate
78
(available online(4)) provides cancer-specific and overall percentage survival estimates for up to 15 79
years and has been endorsed by the National Institute for Health and Care Excellence (NICE)(5). To 80
maximise usability, it uses routinely-available clinico-pathological data (age, PSA, grade, stage, 81
biopsy involvement, treatment type and comorbidity). It represents real-world data from a non-82
screened, primary diagnostic cohort, including a significant number of men treated conservatively. 83
Crucially, the model also allows adjustment for competing mortalities by incorporating both cancer-84
specific and non-cancer survival outcomes to contextualise the diagnosis as part of a decision-aid. 85
Internal validation and accuracy within a small external population were promising during model 86
development (3). However, external validation in independent cohorts, ideally in a different location, 87
is vital to demonstrate generalisability and accuracy of a multivariable prognostic model (6). 88
The Prostate Cancer database Sweden (PCBaSe) is one of the largest and most comprehensive 89
prostate cancer cohorts world-wide and is well-suited for external validation of PREDICT Prostate (7). 90
The aim of this study was to validate PREDICT Prostate and compare performance to existing 91
models. 92
Methods 93
Source of data
94
Data from PCBaSE 3.0 were used, according to a pre-specified project outline (Additional File 2). 95
PCBaSe was created by the combination of the National Prostate Cancer Register of Sweden with 96
other national healthcare and demographic databases (8). The capture rate of this register is 98% of 97
all incident prostate cancer cases compared to the Swedish Cancer Registry to which registration is 98
mandated by law (9). Cause of death information is updated from the Cause of Death Registry which 99
captures all deaths in Sweden. The agreement between recorded cause of death and reviewed 100
medical records has been reported at 86% (95% CI: 85-87%)(10). 101
102
Participants and predictors
103
We included men within PCBaSe diagnosed with PCa between January 1st 2000 and 31st December 104
2010, with no evidence of metastatic disease and prostate specific antigen (PSA) <100ng/ml. Cases 105
were censored at death, migration or 31st December 2016, whichever event occurred first. Data 106
were available for 82,936 men. Outcome events were PCa death or an cause death from which 107
non-PCa death was derived. Intact data were required for variables mandatory within the model: 108
age, PSA, T-stage, histological grade-group, primary treatment type and comorbidity. This led to the 109
exclusion of 13,730 (16.6%) cases, leaving a final analysable dataset of 69,206 (Table 1). Missing data 110
were most abundant for histological grade group (n=8117), as primary and secondary Gleason grade 111
were not always registered. Data were also missing on PSA (n=2124), T-stage (n=1364), age (n=4) 112
and primary treatment (n=3960). Some men had missing data for more than one variable. All 113
variables were determined at the time of diagnosis. Biopsy characteristics are an optional variable in 114
the PREDICT Prostate model, therefore missing data on proportion of positive cores ([PPC] = number 115
of cores with any cancer/number of cores taken) were tolerated. We also re-tested the value of PPC 116
to predict PCa death in a subgroup with intact biopsy information (n=44,163) using the same method 117
as previously (3). Primary treatment was defined as the radical treatment received up to 12 months 118
after the date of diagnosis, or conservative management. The same definition of comorbidity was 119
used as in the model development: the combination of both Charlson Comorbidity Index of 1 or 120
greater (excluding PCa) and a hospital admission in the 2 years preceding PCa diagnosis(3). Up to 121
2008, the treatment strategies of active surveillance and watchful waiting were reported as 122
conservative management. After 2008 these strategies were registered as separate entities. We 123
used conservative management as a treatment strategy also for men diagnosed after 2008, although 124
a small, well-defined active surveillance group was separately analysed. 125
126
Outcome
127
The model estimates prostate cancer-specific mortality (PCSM), non-PCa mortality (NPCM) and 128
overall, or all-cause mortality (ACM), counted from the time of diagnosis. It provides estimates 129
following conservative management and radical treatment (by either radical prostatectomy or 130
radiotherapy). 131
Statistical analysis methods
132
Beta coefficients for each prognostic factor in the model were applied to derive prognostic indices 133
for PCSM and NPCM for each patient. These were used in combination with the model s baseline 134
hazard functions and time-at-risk to create individual estimates of unadjusted PCSM and NPCM over 135
15 years. These estimates were adjusted for the competing risks between the two causes of death 136
to generate ACM estimates. To assess discrimination, 15-year estimates were generated Harrell s 137
concordance index (c-index) was then applied using the Hmisc package in R (11). Discrimination 138
using PREDICT Prostate was compared to the EAU and NCCN stratification systems, and the UCSF 139
CAPRA score (12-14). Sub-classification of stage T2 was not available; therefore T2 was assumed to 140
be T2a for the sake of these classifications. When PPC was unknown, it was assumed to be <34% in 141
the CAPRA model. Adjusted predictions of cumulative PCSM, NPCM and ACM were generated using 142
available follow-up for assessment of model calibration. Calibration was assessed using a Chi-square 143
goodness of fit (GOF) across quintiles of risk using the method of May and Hosmer(15). Calibration 144
was also assessed within treatment sub-groups. All data analyses were performed in Stata , 145
unless otherwise stated above. 146
Results 147
Participants 148
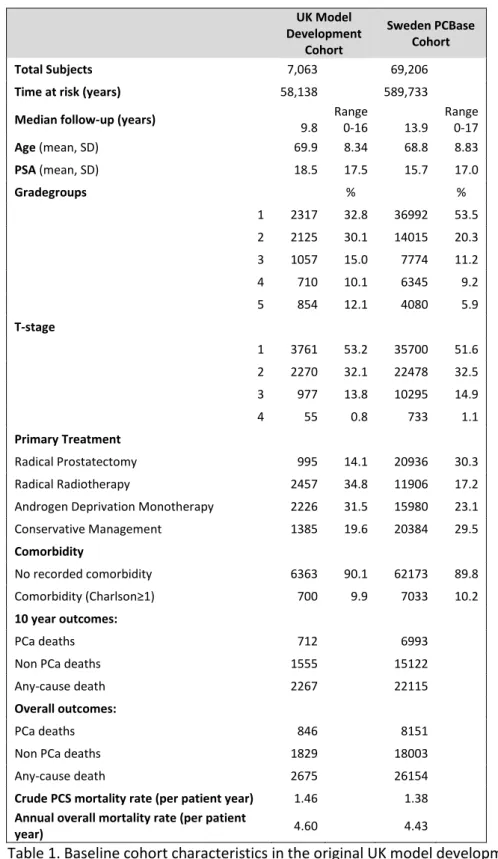
69,206 men were included with 13.9 years median follow-up. The Swedish population attributes at 149
baseline are compared to the UK model development cohort in Table 1. Patient characteristics were 150
similar in both cohorts, with a larger proportion of grade group 1 disease in the Swedish cohort. A 151
larger proportion of men underwent surgery as opposed to radiotherapy in the Swedish cohort, and 152
smaller proportion were treated with primary androgen deprivation therapy in this time period. 153
Breakdown of the patients by risk groups is reported in Additional File 1: Table S1. 154
155
Model performance
156
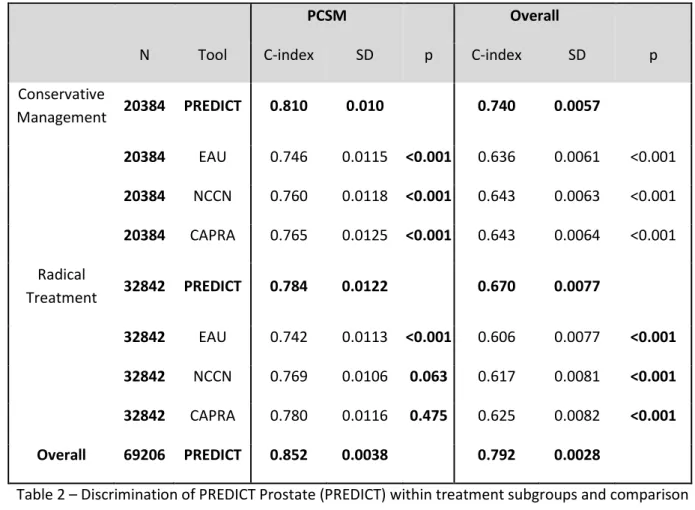
Overall discrimination of PREDICT Prostate was very good with C-indices 0.85 (95% CI 0.85-0.86) for 157
PCSM and 0.79 (95% CI 0.79-0.79) for ACM (Table 2). Overall calibration of the model was excellent 158
with 25,925 deaths predicted and 25,849 deaths observed in PCBaSe. This equates to an overall 159
observed:expected (O:E) ratio of 1:1.003. Calibration across quintiles of risk is shown in Figure 1 and 160
Additional File 1: Table S2. Although the O:E ratio for any-cause death was very close to 1, expected 161
numbers of PCa deaths were slightly higher than observed (O:E 0.897) , and expected numbers of 162
non-PCa deaths were lower than observed (O:E 1.060), particularly in the highest risk quintiles 163 which. 164 165 Treatment Subgroups 166
Overall, 20,384 men underwent conservative management and 32,842 received radical treatment. 167
Within these groups c-indices remained good, with c-index for 15-year PCSM 0.81 (95%CI 0.80-0.82) 168
for conservative management and 0.78 (95% CI 0.77-0.80) for radical treatment (Table 2). 169
Among men on well-defined active surveillance, C-indices were further improved at 0.88 for PCSM 170
and 0.75 for ACM (Additional File 1: Table S3). Calibration also remained good within treatment 171
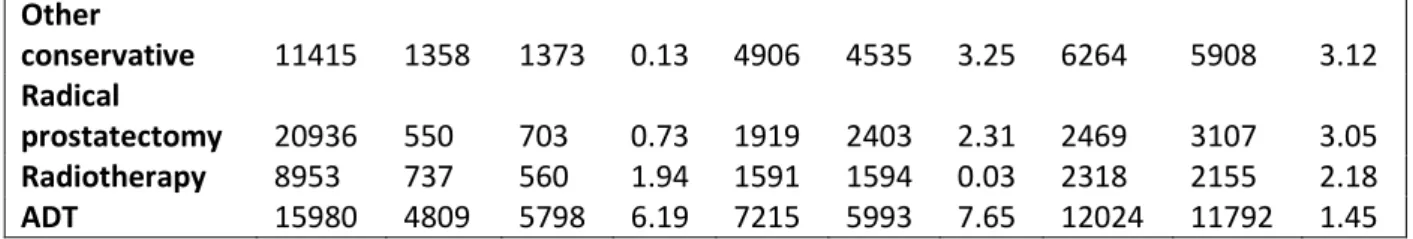
groups with differences between observed and predicted numbers of overall deaths 1.4%, 2.2% and 172
3.1% among men who received active surveillance, radiotherapy, and prostatectomy, respectively 173
(Table 3). The model overestimated PCSM and underestimate NPCM within the subgroup which 174
received androgen deprivation monotherapy by as much as 8% but remained within 2% for overall 175
death (Table 3). 176
Comparison to existing models
177
PREDICT Prostate significantly outperformed the comparator models when predicting ACM, both 178
overall and within every major treatment sub-group (Table 2 + Additional File 1: Table S3). 179
Discriminatory performance was significantly better for PCSM overall (Additional File 1: Table S4). 180
Across all treatment sub-groups, the model outperformed the 3-stratum EAU risk categories. 181
Improvements in discrimination failed to reach significance for PCSM in some comparisons with the 182
NCCN and CAPRA score, but in only one incidence was the c-index better for one of these 183
comparator models (CAPRA score for PCSM among RP patients, Additional File 1: Table S3). 184
Biopsy parameter sub-analysis
185
Biopsy parameterisation using percentage of positive cores (PPC) was re-explored within a group of 186
44,163 men who had this information registered (Additional File 1). Inclusion of biopsy 187
characteristics did not significantly alter the discriminatory performance of the model (Additional 188
File 1: Table S4 & Table S5); either using a dichotomous 50% percentage of cores cut-off or PPC as a 189
continuous variable. Inclusion of biopsy information did improve calibration across lower-risk 190
quintiles of risk for PCSM. Calibration for any-cause death however was unchanged regardless of 191
inclusion of biopsy information (Additional File 1: Table S6 & Figure S1). 192
193 194 195
Discussion 196
197
In this large external validation cohort we demonstrated that PREDICT Prostate is a robust and 198
generalisable long-term prognostic model. In analysis of an independent cohort, ten times larger 199
than the original cohort, discriminatory accuracy and calibration was good. This also remained true 200
within treatment groups, particularly in men managed conservatively or by radical therapy. 201
Conveying information to an individual about their disease prognosis within their own context of 202
competing mortality has historically been an imprecise exercise with little objective data available. 203
Most current prognostication is based on stratification groups of the cancer itself and discussions 204
with clinicians who may be conflicted towards a particular treatment (16-18). PREDICT Prostate was 205
conceived to address this gap in clinical need and standardise the decision-making process (3) and 206
has shown promise to positively influence clinical decision-making(19). It is built around long-term 207
actual survival data and has been designed to address all AJCC criteria (6). 208
In the model development study, C-indices were 0.84 for PCSM and 0.77 for ACM within the UK 209
validation cohort (3). In the original study external validity was also assessed within a Singaporean 210
cohort. However, this cohort was small (n=2,546) and follow-up was quite short (5.1 years). Here we 211
show in a cohort of >69,000 men with longer median follow-up that our c-indices were actually 212
improved to 0.85 for PCSM and 0.79 for ACM with excellent calibration. We did note a marginal 213
overestimation of PCSM, which was contrary to the slight underestimation we had observed in the 214
Singapore external validation in the original paper (3). Given that the model is very well calibrated 215
for ACM, this apparent overestimation of PCSM and (corresponding underestimation of NPCM) is 216
likely to be a result of differences in cause of death classification, reporting or recording practices. 217
ACM is the key outcome of interest, and a more unequivocal endpoint, against which this model 218
performs very well. 219
When compared to existing models, PREDICT Prostate consistently out-performed the three-stratum 220
risk classification system used in the EAU, D Amico and NICE stratification criteria (13, 17, 20). We 221
recognise that comparisons against these risk stratification criteria are limited, and that they are not 222
designed to be prognostic nomograms, however, they are widely used in clinical practice to inform 223
treatment decisions. Benefits of PREDICT were also seen against the NCCN and CAPRA scores, which 224
add more granularity but ultimately retain a grouping system rather than individual estimates (13, 225
14). For the outcome of PCSM, the CAPRA score did perform similarly well for some treatment 226
groups, particularly in men treated with prostatectomy. This is unsurprising, as the model was 227
originally built around prostatectomy patients (21). It should be noted, that PREDICT Prostate is not 228
a treatment-specific tool, therefore by assessing discrimination within treatment sub-groups its 229
discriminatory performance will inevitably be reduced. Nonetheless, PREDICT Prostate performed 230
significantly better in predicting ACM and PCSM in most treatment groups. We also confirmed that 231
adding in biopsy data to the model improved the performance though this effect was marginal in 232
addition to the other variables already included. Using PPC as a continuous variable maximises use 233
of prognostic information, and this parameterisation did lead to marginally superior discrimination 234
for ACM. 235
The primary utility of PREDICT Prostate will be in men for whom conservative management and 236
radical treatment might both be appropriate options, for whom the decision is most difficult. 237
Abundant literature demonstrates that decision aids contribute to more knowledgeable and 238
informed patients and that they can improve clinician-patient communication (22, 23). Therefore, 239
the model may have wide potential applications in informing patient, clinician and multi-disciplinary 240
team decision-making to reduce both over and under-treatment. Formal clinical impact assessments 241
are also crucial to show face and functional validity and these are underway with PREDICT Prostate
242
(24) Future research endeavours could assess what impact the use of the model might have on 243
actual treatment practices and compare this model with prognostic biomarkers, or radiological 244
prognosticators. Over time, additional parameters can be incorporated into this base model, or the 245
model itself be updated, should new variables be shown to have independent prognostic effects 246
(25). 247
More recent efforts in prognostic tools have sought to utilise novel genomic or biological markers to 248
generate prognostic estimates. However, most established genomic tools such as Prolaris CCP and 249
Oncotype DX GPS have predominantly been tested against shorter-term outcomes or in treatment 250
specific cohorts (26, 27). Where they have been assessed against PCSM, concordance has been very 251
similar to our model - for example the Decipher genomic classifier alongside CAPRA showed an AUC 252
of 0.78 (95%CI 0.68-0.87) for 10-year PCSM following prostatectomy (28). Direct comparison with 253
PREDICT Prostate is not possible without a head to head or combined study, but the value of such 254
expensive tests do need to be re-assessed in the context of optimised clinical multivariable models 255
(29). In this context we would welcome collaborations or independent studies on the value of 256
adding genomic classifiers to future iterations of PREDICT Prostate. 257
This study has numerous strengths, given the large sample size, long follow-up and high 258
completeness of data in PCBaSe(30). However, we recognise limitations inherent to using registry 259
data. 17% men were excluded due to missing data and we cannot exclude this introducing some 260
bias. A large proportion of men within this validation dataset had low grade disease, such that PCa 261
mortality rates were relatively low which may affect discriminatory performance. Men diagnosed 262
within the inclusion period may also not be representative of contemporary practice with changes in 263
PCa diagnosis and treatment. For instance, we recognise that primary hormone therapy is now rarely 264
used in the context of non-metastatic PCa, hence we included subgroup analyses within other 265
treatment groups. We also appreciate that multi-modal therapies are increasingly used in higher risk 266
cases, which we were not able to assess in this study due to the inclusion dates, and data availability 267
limitations of our datasets. Another particular concern is the lack of information from magnetic 268
resonance imaging (MRI). However, the current focus for MRI is on tumour-detection rather than 269
prognostication and it is unknown if MRI lesion characteristics (Likert or PIRAD scoring) have any 270
bearing on survival. Our model also cannot account for subsequent transitions to different 271
treatments. However, in our UK dataset, conversions to active treatment were less than 6% across 272
total follow-up (3). We also recognise the lack of T-stage sub-classification, which is a key parameter 273
in 2 of the existing models we made comparisons to. However, it is accepted that T-stage is often 274
inaccurately assigned in localised disease (31). We also recognise that other endpoints of interest 275
exist, particularly development of metastases and commencement of hormone therapy. The model 276
is untested against these endpoints, but calibrated against the more robust endpoint of death. 277
A key issue going forward is the validation of this model in non-Caucasian and screened populations. 278
Although the original paper re-tested the model in Singaporean men, PREDICT Prostate remains 279
untested in men of African descent or other ethnicities. Independent validations within screened 280
populations, and within other prospectively collected or randomised datasets, would also be helpful 281
and should be encouraged. Finally, we recognise that other nomograms are available, against which 282
direct comparisons would be very insightful. These were not possible within the design of this study, 283
or the limitations of this data, particularly with regards to comorbidity. 284
Conclusions 285
This large external validation demonstrates the robustness of PREDICT Prostate. PREDICT Prostate,
286
available as a free-to-use web tool (4), has the potential to significantly improve shared decision-287
making for PCa management, particularly the choice between conservative management and radical 288
treatment. Further, independent external validations are encouraged, especially in populations of 289
different ethnicities. 290
Abbreviations 292
ACM All cause mortality 293
AJCC American Joint Committee on Cancer 294
AUC Area under the curve 295
CAPRA University of California San Francisco cancer of the prostate risk assessment score 296
c-index concordance index 297
EAU European Association of Urology 298
NCCN National Comprehensive Cancer Network 299
NICE National Institute for Health and Care Excellence (UK) 300
NPCM Non-prostate cancer mortality 301
O:E ratio Observed: expected ratio 302
PCa Prostate cancer 303
PCBaSe Prostate cancer database Sweden 304
PCSM Prostate cancer specific mortality 305
PIRADS Prostate imaging reporting and data system 306
PPC Proportion of positive cores 307
PSA Prostate-specific antigen 308 T-stage Tumour-stage 309 UK United Kingdom 310 95% CI 95% Confidence Interval 311 312 Declarations 313
Ethics approval and consent to participate 314
Release of these data were approved by the Prostate Cancer data Base Sweden committee after 315 peer-review. 316 Consent to publish 317 N/A 318
Availability of data and materials 319
The datasets used in the current study can be made available at a remote server with export of 320
aggregated data only. The application will be considered by the Prostate Cancer data Base Sweden 321
reference group and The Research Ethics Board in Uppsala, please contact author PS. 322
Competing interests 323
The authors have read the BMC Medicine editorial policy on competing interests and declare they 324
have no relevant conflicts of interest to declare. 325
Funding 326
This work was supported by a Research Scholarship from The Urology Foundation and Infrastructure 327
support from Cancer Research UK Cambridge Institute and the Cambridge Biomedical Campus. The 328
work within the PCBaSe was funded by Swedish Research Council and The Swedish Cancer Society. 329
A thors contrib tions
330
DT, PP and VJG conceived, designed and analysed the study collaboratively. OB and PS reviewed the 331
project design, oversaw collection, curation and release of data. All authors were involved in critical 332
review of the results and have contributed to, read and approved the final manuscript. 333
Acknowledgements 334
Collection of data in the National Prostate Cancer Register of Sweden was made possible by the 335
continuous work of the NPCR steering group: Pär Stattin (chairman), Ingela Franck Lissbrant ( deputy 336
chair,) Camilla Thellenberg, Magnus Törnblom, Stefan Carlsson, Marie Hjälm-Eriksson, David 337
Robinson, Mats Andén, Jonas Hugosson, , Maria Nyberg, Ola Bratt, Olof Akre, Per Fransson, Eva 338
Johansson, Johan Stranne, Fredrik Sandin and Karin Hellström. 339
340
References 341
1. NPCA. National Prostate Cancer Audit - Annual Report 2017. 2017. 342
2. Greenberg DC, Lophatananon A, Wright KA, Muir KR, Gnanapragasam VJ. Trends and 343
outcome from radical therapy for primary non-metastatic prostate cancer in a UK population. PLoS 344
One. 2015;10(3):e0119494. 345
3. Thurtle DR, Greenberg DC, Lee LS, Huang HH, Pharoah PD, Gnanapragasam VJ. Individual 346
prognosis at diagnosis in nonmetastatic prostate cancer: Development and external validation of the 347
PREDICT Prostate multivariable model. PLoS Med. 2019;16(3):e1002758. 348
4. Predict Prostate Homepage [Available from: https://prostate.predict.nhs.uk/. 349
5. NICE. Endorsed resource - Predict Prostate. Prostate Cancer: diagnosis and management. 350
May 2019. 351
6. Kattan MW, Hess KR, Amin MB, Lu Y, Moons KG, Gershenwald JE, et al. American Joint 352
Committee on Cancer acceptance criteria for inclusion of risk models for individualized prognosis in 353
the practice of precision medicine. CA Cancer J Clin. 2016;66(5):370-4. 354
7. Moons KG, Altman DG, Vergouwe Y, Royston P. Prognosis and prognostic research: 355
application and impact of prognostic models in clinical practice. BMJ. 2009;338:b606. 356
8. Van Hemelrijck M, Wigertz A, Sandin F, Garmo H, Hellström K, Fransson P, et al. Cohort 357
Profile: the National Prostate Cancer Register of Sweden and Prostate Cancer data Base Sweden 2.0. 358
Int J Epidemiol. 2013;42(4):956-67. 359
9. Tomic K, Berglund A, Robinson D, Hjälm-Eriksson M, Carlsson S, Lambe M, et al. Capture rate 360
and representativity of The National Prostate Cancer Register of Sweden. Acta Oncol. 361
2015;54(2):158-63. 362
10. Fall K, Strömberg F, Rosell J, Andrèn O, Varenhorst E, Group S-ERPC. Reliability of death 363
certificates in prostate cancer patients. Scand J Urol Nephrol. 2008;42(4):352-7. 364
11. Harrell F Package Hmisc In Dupont C editor CRAN p -6. 365
12. Heidenreich A, Bastian PJ, Bellmunt J, Bolla M, Joniau S, van der Kwast T, et al. EAU 366
guidelines on prostate cancer. part 1: screening, diagnosis, and local treatment with curative intent-367
update 2013. Eur Urol. 2014;65(1):124-37. 368
13. NCCN. National Comprehensive Cancer Network Clinical Practice Guidelines in Oncology: 369
Prostate Cancer. Version 2. 2018 [Available from: 370
https://www.nccn.org/professionals/physician_gls/pdf/prostate.pdf. 371
14. Cooperberg MR, Pasta DJ, Elkin EP, Litwin MS, Latini DM, Du Chane J, et al. The University of 372
California, San Francisco Cancer of the Prostate Risk Assessment score: a straightforward and 373
reliable preoperative predictor of disease recurrence after radical prostatectomy. J Urol. 374
2005;173(6):1938-42. 375
15. May S, Hosmer DW. A simplified method of calculating an overall goodness-of-fit test for the 376
Cox proportional hazards model. Lifetime Data Anal. 1998;4(2):109-20. 377
16. AUA/ASTRO/SUO. CLINICALLY LOCALIZED PROSTATE CANCER: AUA/ASTRO/SUO 378
GUIDELINE 2017. 379
17. NICE. National Institute for Health and Care Excellence NICE Guidelines [CG175] Prostate 380
cancer: diagnosis and treatment. January 2014. 381
18. Kim SP, Gross CP, Nguyen PL, Nguyen PY, Smaldone MC, Thompson RH, et al. Specialty bias 382
in treatment recommendations and quality of life among radiation oncologists and urologists for 383
localized prostate cancer. Prostate Cancer Prostatic Dis. 2014;17(2):163-9. 384
19. Thurtle DR, Jenkins V, Pharoah PD, Gnanapragasam VJ. Understanding of prognosis in non-385
metastatic prostate cancer: a randomised comparative study of clinician estimates measured against 386
the PREDICT prostate prognostic model. Br J Cancer. 2019. 387
20. D'Amico AV, Whittington R, Malkowicz SB, Schultz D, Blank K, Broderick GA, et al. 388
Biochemical outcome after radical prostatectomy, external beam radiation therapy, or interstitial 389
radiation therapy for clinically localized prostate cancer. JAMA. 1998;280(11):969-74. 390
21. Cooperberg MR, Broering JM, Carroll PR. The UCSF cancer of the prostate risk assessment 391
(CAPRA) score accurately predicts metastasis, prostate cancer mortality, and all-cause mortality 392
regardless of treatment type. Journal of Urology. 2008;179(4):114-5. 393
22. O'Connor AM, Rostom A, Fiset V, Tetroe J, Entwistle V, Llewellyn-Thomas H, et al. Decision 394
aids for patients facing health treatment or screening decisions: systematic review. BMJ. 395
1999;319(7212):731-4. 396
23. Lin GA, Aaronson DS, Knight SJ, Carroll PR, Dudley RA. Patient decision aids for prostate 397
cancer treatment: a systematic review of the literature. CA Cancer J Clin. 2009;59(6):379-90. 398
24. Registry I. ISRCTN 28468474 PREDICT Prostate Patient Study 399
Evaluation of a new tool, PREDICT Prostate, to aid treatment decision-making for men with newly 400
diagnosed non-metastatic prostate cancer. 2018. 401
25. Wishart GC, Bajdik CD, Dicks E, Provenzano E, Schmidt MK, Sherman M, et al. PREDICT Plus: 402
development and validation of a prognostic model for early breast cancer that includes HER2. Br J 403
Cancer. 2012;107(5):800-7. 404
26. Ontario HQ. Prolaris Cell Cycle Progression Test for Localized Prostate Cancer: A Health 405
Technology Assessment. Ont Health Technol Assess Ser. 2017;17(6):1-75. 406
27. Cucchiara V, Cooperberg MR, Dall'Era M, Lin DW, Montorsi F, Schalken JA, et al. Genomic 407
Markers in Prostate Cancer Decision Making. Eur Urol. 2018;73(4):572-82. 408
28. Cooperberg MR, Davicioni E, Crisan A, Jenkins RB, Ghadessi M, Karnes RJ. Combined Value of 409
Validated Clinical and Genomic Risk Stratification Tools for Predicting Prostate Cancer Mortality in a 410
High-risk Prostatectomy Cohort. European Urology. 2015;67(2):326-33. 411
29. Herlemann A, Washington SL, Eapen RS, Cooperberg MR. Whom to Treat: Postdiagnostic 412
Risk Assessment with Gleason Score, Risk Models, and Genomic Classifier. Urol Clin North Am. 413
2017;44(4):547-55. 414
30. Tomic K, Westerberg M, Robinson D, Garmo H, Stattin P. Proportion and characteristics of 415
men with unknown risk category in the National Prostate Cancer Register of Sweden. Acta 416
Oncologica. 2016;55(12):1461-6. 417
31. Reese AC, Sadetsky N, Carroll PR, Cooperberg MR. Inaccuracies in assignment of clinical 418
stage for localized prostate cancer. Cancer. 2011;117(2):283-9. 419
32. Justice AC, Covinsky KE, Berlin JA. Assessing the generalizability of prognostic information. 420
Ann Intern Med. 1999;130(6):515-24. 421
33. Altman DG, Vergouwe Y, Royston P, Moons KG. Prognosis and prognostic research: 422
validating a prognostic model. BMJ. 2009;338:b605. 423
34. DeLong ER, DeLong DM, Clarke-Pearson DL. Comparing the areas under two or more 424
correlated receiver operating characteristic curves: a nonparametric approach. Biometrics. 425
1988;44(3):837-45. 426
427 428
Tables and legends 429 430 UK Model Development Cohort Sweden PCBase Cohort Total Subjects 7,063 69,206
Time at risk (years) 58,138 589,733
Median follow-up (years)
9.8 Range 0-16 13.9 Range 0-17 Age (mean, SD) 69.9 8.34 68.8 8.83 PSA (mean, SD) 18.5 17.5 15.7 17.0 Gradegroups % % 1 2317 32.8 36992 53.5 2 2125 30.1 14015 20.3 3 1057 15.0 7774 11.2 4 710 10.1 6345 9.2 5 854 12.1 4080 5.9 T-stage 1 3761 53.2 35700 51.6 2 2270 32.1 22478 32.5 3 977 13.8 10295 14.9 4 55 0.8 733 1.1 Primary Treatment Radical Prostatectomy 995 14.1 20936 30.3 Radical Radiotherapy 2457 34.8 11906 17.2
Androgen Deprivation Monotherapy 2226 31.5 15980 23.1
Conservative Management 1385 19.6 20384 29.5 Comorbidity No recorded comorbidity 6363 90.1 62173 89.8 Comorbidit Charlson 700 9.9 7033 10.2 10 year outcomes: PCa deaths 712 6993
Non PCa deaths 1555 15122
Any-cause death 2267 22115
Overall outcomes:
PCa deaths 846 8151
Non PCa deaths 1829 18003
Any-cause death 2675 26154
Crude PCS mortality rate (per patient year) 1.46 1.38
Annual overall mortality rate (per patient
year) 4.60 4.43
Table 1. Baseline cohort characteristics in the original UK model development cohort and Prostate 431
Cancer database Sweden (PCBaSe) cohort. (PCa = prostate cancer SD= standard deviation NA = Not 432
available) 433
434 435
Table 2 Discrimination of PREDICT Prostate (PREDICT) within treatment subgroups and comparison 436
to other existing tools. (EAU = European Association of Urology criteria, NCCN = National Cancer 437
Care Network criteria, CAPRA = UCSF Cancer of the prostate risk assessment criteria, SD = standard 438 deviation) 439 440 441 PCa Death Non-PCa
death Any cause death
n Obs Pred
%
Diff Obs Pred %
Diff Obs Pred % Diff Active surveillance 6224 195 191 0.06 850 940 1.44 1045 1131 1.38 Watchf l aiting 2745 239 198 1.49 942 915 0.98 1181 1112 2.51 PCSM Overall
N Tool C-index SD p C-index SD p
Conservative Management 20384 PREDICT 0.810 0.010 0.740 0.0057 20384 EAU 0.746 0.0115 <0.001 0.636 0.0061 <0.001 20384 NCCN 0.760 0.0118 <0.001 0.643 0.0063 <0.001 20384 CAPRA 0.765 0.0125 <0.001 0.643 0.0064 <0.001 Radical Treatment 32842 PREDICT 0.784 0.0122 0.670 0.0077 32842 EAU 0.742 0.0113 <0.001 0.606 0.0077 <0.001 32842 NCCN 0.769 0.0106 0.063 0.617 0.0081 <0.001 32842 CAPRA 0.780 0.0116 0.475 0.625 0.0082 <0.001 Overall 69206 PREDICT 0.852 0.0038 0.792 0.0028
Other conservative 11415 1358 1373 0.13 4906 4535 3.25 6264 5908 3.12 Radical prostatectomy 20936 550 703 0.73 1919 2403 2.31 2469 3107 3.05 Radiotherapy 8953 737 560 1.94 1591 1594 0.03 2318 2155 2.18 ADT 15980 4809 5798 6.19 7215 5993 7.65 12024 11792 1.45 442
Table 3 Calibration of PREDICT Prostate mortality estimates with observed numbers of deaths 443
within treatment groups 444
Figure legends 445
Figure 1 446
Calibration curves demonstrating observed and expected 15-year probability of death across 447
quintiles or risk for prostate cancer (PCa) death (left), non-PCa death (centre) and any cause death 448 (right). 449 450 451 452
Appendices
453 454
-Additional File 1 Supplementary files. 455
-Additional File 2 Data request and study outline form to PCBaSe 456