ADOPTION OF IMPROVED MAIZE AND COMMON BEAN
VARIETIES IN MOZAMBIQUE
By Helder Lopes A THESIS Submitted to Michigan State UniversityIn partial fulfillment of the requirements for the degree of
MASTER OF SCIENCE
Agricultural, Food, and Resource Economics 2010
ABSTRACT
ADOPTION OF IMPROVED MAIZE AND COMMON BEAN
VARIETIES IN MOZAMBIQUE
By Helder Lopes
Household adoption of new agricultural technologies, including improved maize and bean varieties in Mozambique, is still relatively low. As a result, the average maize and common bean production remains low.
This study identifies factors that are associated with households’ adoption of improved maize and bean varieties, using Trabalho de Inquérito Agrícola (TIA) 2007 data and the probit model to estimate the likelihood of household adoption of improved varieties of maize and common beans at both the national and regional levels.
At the national level, the results indicate that household head’s education, access to extension services and credit are associated with the household’s adoption decision. However, association membership is negatively associated with the adoption decision. Education and extension are only statistically significant for the improved maize analysis. These findings suggest that households who had access to support services are more likely to adopt improved varieties. Household adoption of improved maize and bean varieties could be increased from the current 12% and 15% percent adoption rates, respectively, if 1) the current extension programs are strengthened to better respond to households’ information needs, as well as to serve more households in different geographical areas, and 2) household access’ to credit is expanded.
iii
DEDICATED
I dedicate all of my works and life to Jesus Christ, the only Son of almighty God.
This thesis is dedicated to
my wife ―Anata,‖ for her never ending love, support, and encouragement, my daughters ―Paia and Cipi,‖ your presence inspires my life very much,
iv
ACKNOWLEDGEMENT
I would like to extend my sincere and great gratitude to Dr. Richard Bernsten, my major professor, for all of his extraordinary and excellent guidance, advice, and
encouragements for my study program and thesis. I am also grateful to my academic committee members: Dr. Cynthia Donovan, Dr. Eric Crawford, Dr. Russell Freed, and Dr. Songqing Jin for their excellent advice, guidance, and constructive criticisms.
I would not have been able to pursue the master program in the Department of Agricultural, Food, and Resource Economics at Michigan State University without the financial support from the United States Agency for International Development (USAID) through the Academy for Educational Development (AED). Therefore, my great gratitude is to the USAID and all the AED staff.
This thesis would not have been completed without permission to use the
Mozambique Agricultural Household Survey data, known as TIA (Trabalho de Inquerito Agricola). Thank you to the Ministry of Agricultural of Mozambique for providing and allowing me to use the TIA 2007 survey data for my thesis. Thank you also to David Mather, Helder Zavale, and Ellen Payongayong for their help and guidance.
Thank you to all professors, staff, and colleagues in the department of AFRE. It was wonderful to learn together with you, and took part in this great academic
community -- I will miss you all. Lastly, I would like to convey my special thanks to my host family and all of the people who have been helping me in my life. Your kindness and generosity will make me miss you so much. May the almighty GOD bless and be with us always.
v
TABLE OF CONTENTS
LIST OF TABLES………. …..viii
LIST OF FIGURES……….……….…… ….ix
LIST OF ACRONYMS...x CHAPTER I: INTRODUCTION 1.1.Introduction ………….………..………...………1 1.2. General Background……....………..……….……..1 1.3. Problem Statement………..…..………..….…….3 1.4. Research Objectives………..……..……….…….6 1.5. Research Questions………..…………..……….…..6 1.6. Hypothesis………..……….…..7 1.7. Organization of Thesis……….……….…8 1.8. Chapter Summary……….………....8
CHAPTER II: LITERATURE REVIEW 2.1. Introduction……….………10
2.2. Definition and Concept of Technological Adoption….………..10
2.3. Factors that are Associated with Farmers Adoption Decision 2.3.1. Farmers’ Socio-Demography Characteristics………..13
2.3.2. Institutional Factors………..………...14
2.3.3. Farmers’ Perception on Characteristics of Technologies…………15
2.3.4. Risks and Economic Attributes………….…..………...17
2.4. Chapter Summary………...19
CHAPTER III: KEY ASPECTS OF MOZAMBIQUE 3.1. Introduction………21
3.2. Physical and Socio-Economic Characteristics 3.2.1. Geography and Agro-ecology……….….21
3.2.2. A Brief History of Mozambique………..23
3.2.3. Climate……….23
3.2.4. Demographic Features.……….. 23
3.3. The Economy 3.3.1. Macroeconomic and Financial Policy………..24
3.3.2. Infrastructure, Road and Transportation, and Electrification……. 27
3.3.3. Poverty……….28
3.4. Agricultural Sector 3.4.1. Agricultural Sector Development and Challenges...………29
3.4.2. Livestock Production ….……….30
3.4.3. Agricultural Land Use..………31
3.4.4. Agricultural Inputs Use………32
vi
3.4.6. Maize and Beans……..………35
3.5. Chapter Summary………...38
CHAPTER IV: THE MOZAMBIQUE AGRICULTURAL HOUSEHOLD SURVEY 4.1. Introduction...40
4.2. An overview on Trabalho de Inquérito Agrícola (TIA)...40
4.3. 2007 TIA Objective 4.3.1. General Objectives………...41 4.3.2. Specific Objectives………..42 4.4. Implementation of TIA 2007...42 4.5. Data Transformation………...45 4.6. Chapter Summary………...46
CHAPTER V: THE EMPIRICAL TECHNOLOGY ADOPTION MODEL 5.1. Introduction………47
5.2. Descriptive Statistics, Probit Adoption Model, and Marginal effect 5.2.1. Descriptive Statistics…...……….47
5.2.2. Probit Adoption Model……..………..48
5.2.3. Marginal Effect After Probit Regression….………...….50
5.3. Variables Description 5.3.1. Dependent Variable……….52
5.3.2. Independent Variables……….52
5.4. Chapter Summary………...56
CHAPTER VI: RESULTS AND INTERPRETATION 6.1. Introduction………57
6.2. Improved Maize Varietal Adoption Analysis 6.2.1. Distribution of Maize-Producing Households and Maize Production………57
6.2.2. Improved Maize Varietal Adoption Rate ………. ..59
6.2.3. Probit Analysis: Improved Maize Varieties……….64
6.3. Improved Bean Varietal Adoption Analysis 6.3.1. Distribution of Bean-Producing Households and Bean Production………73
6.3.2. Improved Bean Varietal Adoption Rate ………. .. 75
6.3.3. Probit Analysis: Improved Bean Varieties………..80
6.4. Chapter Summary………...88
CHAPTER VII: CONCLUSION AND POLICY IMPLICATION 7.1. Introduction……….…90
7.2. Main Findings 7.2.1. Maize Production and the Adoption Rate………...…….90
7.2.2. Bean Production and the Adoption Rate………...……...91
7.2.3. Factors Associated With the Adoption of Improved Maize and Bean Varieties………92
vii
7.3. Policy Implications……….94 7.4. Limitation of the Study and Recommendations for Future Research
7.4.1. Limitation of the Study………96 7.4.2. Recommendations for future Research………97 Appendix I: Probit Analysis: Coefficient and Marginal Effect Estimates for Bean
Variety at the National and Regional Levels………...100 Appendix II: Adoption of Improved Maize and Bean Varieties in Mozambique by
Region and Province, 2007...………..………..…..101 BIBLIOGRAPHY………102
viii
LIST OF TABLES
Table 3.1 Mozambique’s Economic Growth Indicators, 2005 - 2008………...26 Table 3.2 Mozambique’s Agricultural Export Commodities (tons), 2002 - 2006……….30 Table 3.3 The Small-and Medium- size Livestock Population in
Mozambique, 2002 - 2006……….31 Table 3.4 Mozambique’s Land and Agricultural Land Distribution, 2007………...32 Table 3.5 Mozambique’s Cash Crops Harvested Area (000 ha), 2003 - 2007…...……...34 Table 3.6 Harvested Area (ha) and Production (MT) of Important Crops, 2004-2008.…35 Table 3.7 Percentage of Household Adopted Improved Varieties in Mozambique by Province, 2004-2005………....…36 Table 4.1 TIAs Number of Households and Sample District, 2002-2008………41 Table 4.2 TIA Farms Classification, 2007..………..45 Table 5.1 Definition and Descriptive Statistics of Dependent and
Independent Variables……….………….55
Table 6.1 Adoption of Improved Maize Varieties in Mozambique by Household Size, 2007………62
Table 6.2 Adoption of Improved Maize Varieties in Mozambique by Household Head’s age, 2007………...………63 Table 6.3 Adoption of Improved Maize Varieties in Mozambique by Household
Heads’ Education, 2007………....………64 Table 6.4 Coefficient and Marginal Effect Estimates for Maize Varietal Adoption in
Mozambique at the National and Regional Levels, 2007……….66 Table 6.5 Adoption of Improved Common Bean Varieties in Mozambique by
Household Size, 2007………78 Table 6.6 Adoption of Improved Common Bean Varieties in Mozambique by
Household Heads’ Age, 2007………79 Table 6.7 Adoption of Improved Common Bean Varieties in Mozambique by
ix
Table 6.8 Coefficient and Marginal Effect Estimates for Common Bean Varietal Adoption in Mozambique at the National and Regional Levels, 2007....…….81 Table 6.9 Adoption rates of Improved Bean Varieties Given Independent Variables ….87
x
LIST OF FIGURES
Figure 3.1 Map of 94 Districts Participated in TIA 2007..………22 Figure 3.2 Mozambique Population in Each Province, 2007………24 Figure 3.3 Agricultural Technology Adoption among Household in Mozambique
(Cropping Seasons: 2001/02 & 2004/05)...…….………33 Figure 3.4 Maize Harvested Area and Production in Mozambique, 2000-2008…...……37 Figure 3.5 Maize Prices (US$/ton) in Mozambique, 2001-2007………..……38 Figure 6.1 Map of the Maize-Producing Households in Mozambique by Province
in the 2006/2007 Agricultural Season.……….…59 Figure 6.2 Adoption of Improved Maize Varieties in Mozambique in the
2006/2007 Agricultural Season.………...60 Figure 6.3 Map of the Improved Maize Adoption Rate in Mozambique by Province
in the 2006/2007 Agricultural Season………..…………...……….61 Figure 6.4 Map of the Bean-Producing Households in Mozambique by Province
in the 2006/2007 Agricultural Season.……….…75 Figure 6.5 Adoption of Improved Bean Varieties in Mozambique in the
2006/2007 Agricultural Season.………...76 Figure 6.6 Map of the Improved Bean Adoption Rate in Mozambique by Province
xi
LIST OF ACRONYMS
AED – Academy for Educational Development CAP – Censo Agro-Pecuário
CDF – Cumulative Distributive Function FAO – Food and Agriculture Organization GDP – Gross Domestic Product
IV – Improved Varieties
INE – Instituto Nacional de Statistica LPM – Linear Probability Model
MADER – Ministry of Agriculture and Rural Development MDG – Millennium Development Goals
MINAG – Ministry of Agriculture NGO – Non-Government Organization
PARPA – Plano de Acção Para a Redução da Probeza Absoluta PROAGRI – Programa Nacional de Desenvolvimento Agrária TIA - Trabalho de Inquérito Agrícola
UPA – Unidade Primaria de Amostragem
1
CHAPTER I: INTRODUCTION
1.1. Introduction
This chapter presents a brief introduction to the thesis. The chapter is divided into eight sections. The second section presents a general background of the thesis, focusing on agricultural development and staple foods (e.g., maize and beans) production in Mozambique. The third section describes problem statements of the study, including a brief description on the technology adoption pattern in Mozambique and the reason to conduct this study. The fourth section reviews the research questions, including what factors are believed to be associated with household adoption of improved maize and common bean varieties. The fifth section presents the general and specific objectives of the study. The sixth section describes the hypothesis testing. The seventh section describes the structure of the thesis. The last section summarizes the chapter.
1.2.General Background
Over the past decade, Mozambique has made remarkable progress in its economic development, which is indicated by an increase in household income and assets
holdings, improved quality of public services, and a reduction in poverty by 15%
between 1996 and 2003 (World Bank, 2008). Despite this economic improvement, more than one-half of the population still lives in poverty. Most poor people live in rural areas, where subsistence agriculture is their main economic activity.
The agricultural sector plays a very important role in the socio-economic
development of Mozambique because most of the population, who live in rural areas, is heavily dependent on agriculture for their livelihood. This sector also provides
2
employment to over 75% of the population and from 2005-2008, and the agricultural sector accounts for an averaged 28 percent of the country’s Gross Domestic Product (World Bank, 2008; Corzine, 2008; FAO, 2009; Tomo, 2009).
Despite the agricultural sector being a very important component of the country’s economy, its performance is still relatively low. The government has attempted to address low agricultural productivity through its ―Strategy Plan to Reduce Poverty,‖ referred to by its Portuguese acronym PARPA II (Plano de Acção Para a Redução da Probeza Absoluta),‖ focuses on promoting sustained agricultural production and growth by increasing investment in agricultural research and extension services, improving
agricultural infrastructure, and increasing agricultural inputs-outputs accessibility. In this key planning document, the government also identifies agricultural technology as an important means for reducing hunger and poverty.
The Mozambique agriculture sector is characterized by farm households who grow crops for subsistence on rainfed land using manual cultivation techniques and with little use of purchased inputs. According to Bias and Donovan (2003), households grow three categories of crops: 1) basic staple food crops, such as maize and cassava, which are grown by most farm households; 2) food crops for diversification or with regional specialization, such as beans, groundnuts, sorghum, millet, rice, cashews, and sweet potatoes; and 3) cash crops, such as cotton, tobacco, tea, and sugar cane. Mozambique can increase the production of all of these crops by using its enormous potential of natural resources, improving agricultural infrastructure, and increasing household adoption of improved crop varieties and other new agricultural technologies.
3
To increase the population’s access to food, improve nutrition, and reduce poverty in rural areas, it is necessary to progressively transform the subsistence-oriented
agricultural sector into a more productive sector. According to Zavale et al. (2005), staple food crop production in Mozambique could be expanded through a substantial increase in improved seed production, improvements in seeds distribution system, and an increase in households’ adoption of improved varieties. Furthermore, they argue that Mozambique’s current demography trends and population growth projections indicate that improving agricultural productivity, especially increasing the production of maize, beans, rice, and other staple food crops, is required to insure food security for all of the population, increase households’ income, and avoid a future increase in poverty due to food shortages.
1.3. Problem Statement
Maize and common beans (Phaseolus vulgaris) are two important staple food crops that are widely produced and consumed throughout the country and provide income to households in rural areas. Approximately 90% of the country’s maize is produced in the northern region, which is the most productive agricultural region of the country. In contrast, the south and the central regions are typically deficit in basic foods, depending upon the year. Maize, which accounts for 35% of the total cultivated areas, is grown by 79% of the country’s farmers. However, households’ average maize yield is relatively low, ranging from 250 to 800 kg/hectare, compared to 830 to 3,000 kg/hectare in Southern Africa. On the other hand, common beans are also a staple food crop that is produced by households in some regions of the country. An analysis used TIA 2002-2006 survey data estimated that, on average, small-and medium-scale farmers produced
4
55,022.8 tons during 2006-2006 (Corzine, 2008; Zalave et al., 2005; Bias and Donovan, 2003; Instituto Nacional de Statistica, 2010).
For developing countries, new agricultural technologies have the potential to reduce poverty and food shortage. In many developed and developing countries, new agricultural technologies have increased agricultural productivity, contributed to the overall economic growth, and ensured food security (Bandeira and Rasul, 2005; Cornejo and McBridge, 2002). According to Uaiene et al. (2009), many new agricultural
technologies are currently available in Mozambique, including improved open-pollinated maize varieties (OPV), hybrid maize seed, input packages (e.g., fertilizer, pesticide), improved farm storage techniques, and small scale irrigation technologies (e.g., treadle pumps). Unfortunately, while available in principle, households’ awareness of and access to these new technologies is distinctly limited in practice.
To encourage households to adopt new agricultural technologies and increase agricultural productivity, the government and non-government organizations may need to increase the number of extension agents and expand their diffusion programs (Gemo 2006). However, Uaiene et al. (2009) report that since 2004, the number of public extension agents has declined from 708 to approximately 600 agents, and only 15% of rural households have access to extension services from either the government or non-government organizations. This suggests that the number of households who are aware of and have access to new agricultural technologies, including improved maize and bean varieties, is relatively small.
Improved varieties (e.g., improved maize and beans) have the potential to increase production, as well as increase the income and improve the standard of living for farm
5
households. Unfortunately, the rate of agricultural technology adoption in Mozambique remains low. For example, Uaiene et al. (2009), basing their analysis of TIA 2005 survey data, report that approximately seven and 11% of agricultural households planted improved maize and bean varieties, respectively. Furthermore, they report that less than five percent of households applied fertilizer and pesticide to their food crops. Improved maize and bean varieties have a potential to increase agricultural productivity in
Mozambique, if they were widely diffused and adopted. However, deciding if they should adopt improved varieties, households compared the benefits and costs of improved varieties with traditional varieties. According to some experts, few
households cultivate improved varieties of maize and other staple food crops due to their questionable economic profitability. For example, in Mozambique, in good years when yields are high, households receive low prices. Furthermore, the price of grain does not increase in bad years, despite low production because the government and
non-government organizations distribute food grain to alleviate hunger.
Mozambique needs to increase maize and bean production to secure food and increase nutrition for all populations, especially those that live in rural areas. A few empirical studies, such as from Uaiene et al. (2009), Zavale et al. (2005) and Bandeira and Rasul (2005) report that one of the factors that affect low production of maize in Mozambique is the lack of use of improved varieties. Given the fact that adoption of agricultural technologies in Mozambique is still relatively low, this study will use the 2007 Mozambique Agricultural Household Survey data, known as TIA (Trabalho de Inquérito Agrícola) to identify factors associated with households’ adoption of improved maize and bean varieties in the 2006/2007 agricultural year.
6
1.4.Research Objectives
The general objective of this study is to use the 2007 TIA data to describe the maize and bean production systems, and analyze households’ adoption of improved maize and bean varieties in rural areas of Mozambique. Drawing on the result of the analysis, this study proposes policy recommendations to stakeholders, which will enable them to better understand options for improving maize and bean production.
The specific objectives of this study are to:
1) Describe the maize and bean production systems in Mozambique
2) Estimate the rate of adoption of improved maize and bean varieties in the 2006/2007 agricultural year, by provinces, family size, age, and education level of household heads.
3) Use probit analysis to identify factors that are associated with households’ adoption of improved maize and bean varieties at the national and regional levels. 4) Identify constraints that institutions face in promoting the diffusion of improved
maize and bean varieties.
5) Provide recommendations to relevant stakeholders (e.g., the government) for accelerating the household adoption of improved maize and bean varieties.
1.5. Research Questions
1) To what extent does the adoption of improved maize and bean varieties affect the production of maize and bean varieties in Mozambique?
2) What percentage of households adopted improved maize and bean varieties in the 2006/2007 agricultural year?
7
3) What factors are associated with household adoption of improved maize and bean varieties?
4) What constraints are associated with household adoption of improved maize and bean varieties?
5) What policies are needed to increase household adoption of improved maize and bean varieties in Mozambique?
1.6. Hypothesis
The government of Mozambique has invested significant resources to strengthen agricultural research, extension services, and create agricultural associations. However, agricultural productivity and household adoption of improved maize and bean varieties are still relatively low.
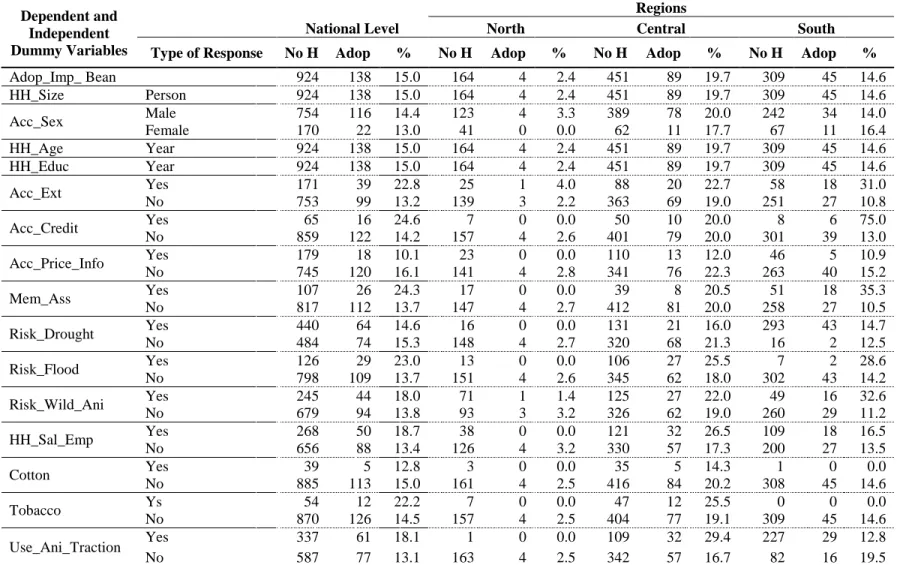
Factors hypothesized to be positively associated with households’ technological adoption behaviors in Mozambique, include farmers’ socio-demography characteristics (e.g., household head’s age and education), institutional factors (e.g., access to extension services and credit), and risks and economic attributes (e.g., flood, and whether or not household plant cotton and tobacco). This study hypothesizes that the specific factors that are associated with household adoption of improved maize and bean varieties are household size (HH_Size); household head’s age (HH_Age), education (HH_Educ), gender (HH_Sex), and salaried employment (HH_Sal_Emp); household had access to extension services (Acc_Ext), credit (Acc_Credit), and price information from markets (Acc_Price_Info); membership in an agricultural association (Mem_Ass); used of animal tractions (Use_Ani_Traction); and a household grew cotton or tobacco in the previous year (Cotton or Tobacco). In contrast, the impact of flood (Risk_Flood), drought
8
(Risk_Drought), and damage by wild animals (Risk_Wild_Ani) on crop productions in the last two years are hypothesized to be negatively associated with household adoption decision.
1.7. Organization of Thesis
This thesis is structured into seven chapters. Chapter II presents a literature review of agricultural technologies adoption in developing countries, focusing on factors associated with households’ adoption decisions. Chapter III provides an overview of Mozambique’s socio-economic characteristics, demography, and the agricultural sector. Chapter IV presents an overview on the Mozambique Agricultural Household Survey, focusing on the objectives and implementation of the TIA 2007 survey. Chapter V describes the method of analysis. Chapter VI presents the result of the analysis and its implications for improving agricultural productivity, focusing on the adoption rates of improved maize and bean varieties, as well as the interpretation of adoption likelihood at the national and regional levels. Chapter VII summarizes the main finding of the
research, highlights its policy implications, identifies limitations, and makes recommendations for future research.
1.8. Chapter Summary
The productivity of the agricultural sector in Mozambique is still relatively low because most farm households grow basic staple food crops (e.g., maize, beans and cassava) and cash crops (e.g., tea, cotton, tobacco and sugar cane) for subsistence on rainfed land, and use manual cultivation techniques and with little use of modern inputs. Mozambique has a potential to increase agricultural productivity by using its enormous
9
potential natural resources and transforming agriculture sector from the subsistence-oriented to a more productive sector. In PARPA II, the government gives priority to promoting sustained agricultural production and growth by increasing agricultural research and extension services, improving agricultural infrastructure, increasing agricultural inputs-outputs accessibility, and identifying agricultural technology as an important means for reducing hunger and poverty.
Modern agricultural technologies, including improved maize and bean varieties, have the potential to increase crop production, as well as increase income and standard of living for farm households in Mozambique, if new agricultural technologies are widely diffused and adopted. Unfortunately, the rates of new agricultural technologies (e.g., improved maize and bean varieties) adoption remain low. This study uses data from TIA 2007 to identify factors associated with farm household adoption of improved varieties. Descriptive statistics, probit regressions, and marginal effect analyses are used to provide information on the adoption rate, and estimate factors associated with households’ varietal adoption decisions. Drawing on the result, this study proposes policy recommendation to stakeholders, which will enable them to better understand options for increasing maize and bean production.
10
CHAPTER II: LITERATURE REVIEW
2.1. Introduction
This chapter reviews the literature on the adoption of agricultural technologies in developing countries. The chapter is divided into four sections. The second section reviews the literature on the definition and conceptualization of technological adoption. The third section presents the literature on factors that are associated with farmers’ adoption behaviors, focusing on farmers’ socio-demography characteristics, institutional factors, farmers’ perceptions and characteristics of technologies, and risks and economic attributes. The last section summarizes the chapter.
2.2. Definition and Conceptualization of the Technological Adoption
Agricultural research focuses on developing new technologies to improve
agricultural productivity and farmers’ well-being. The rapid adoption of new agricultural technologies in developed and some developing countries has increased agricultural productivity, contributed to overall economic growth, and reduced food insecurity and poverty (Bandeira et al, 2005; Cornejo and McBridgje, 2002).
The definition and conceptualization of agricultural technology adoption varies among experts. In their study of adoption of agricultural technology in developing countries, Feder et al. (1985) conceptualize adoption of agricultural technologies at two different levels: aggregate and individual (farm-level) adoption. They define aggregate technology adoption and diffusion as ―the process of the spread of a new technology within a region.‖ Aggregate adoption is measured at the population level, rather than at the individual level. In contrast, the authors define individual adoption as ―the degree of
11
use of a new technology in long-run equilibrium, when the farmer has full information about the new technology and its potential.‖
Boughton and Staatz (1993), using a sub-sector approach to design agriculture research in Mali, argue that farm-level adoption of improved agricultural technology is an important factor affecting the level of economic return to agricultural research. Factors affecting farm-level adoption includes off-farm economic constraint and opportunities that are communicated through off-farm inputs and outputs market. The rate of
technology adoption at the farm-level depend on the extent to which the technology enables farmers to respond to evolving off-farm clients’ preferences for different product characteristics (e.g., quality, seasonal availability, lot size), as reflected in market prices.
Doss (2003), who conducted a study of farm-level technology adoption in eastern Africa, makes a distinction between discrete and continuous technology adopters among typical farmers who use either unimproved or improved inputs. The author defines ―a farmer … as being an adopter if he or she… is found to be using any improved
materials.‖ With respect to the adoption of improved varieties, discrete adoption refers to a farmer who stops using a local (traditional) variety and adopts an improved variety. In contrast, continuous adoption refers to ―situations where farmers increasingly planting more land to improved varieties, while continuing to grow some local varieties.‖ Furthermore, Doss emphasizes that defining agricultural technological adoption is complex. Studies carried out by CIMMYT have used several different adoption
definitions to distinguish between, for example, varieties that were originally introduced as improved hybrids, but have been repeatedly recycled (e.g., farmers plant seed from a previous harvest) versus planting new certified seeds. The author also argues that it is
12
necessary to distinguish between farmers who continue to use a newly adopted technology from those who discontinue using it.1
2.3. Factors Associated With Farmers Adoption Decision
Farmers’ decisions about technological adoption are inherently dynamic--farmers do not simply decide to permanently adopt a modern technology. Rather, before adopting a new agricultural technology (e.g., improved varieties or other technologies), farmers ask a series of questions including: is there any other technology (e.g., other improved variety) that is higher-yielding? And what resources (e.g., land and capital) need to be allocated to support the use of the new technology (Doss, 2003)?
Farmers’ technological adoption behavior is associated with many factors. In a study of the adoption of agricultural and forestry technologies by smallholder in tropical areas, Pattanayak et al. (2003), classify factors associated with technological adoption into four categories: preferences and resource endowments, market incentives,
biophysical factors, and risk and uncertainty. Doss et al. (2003), in the study of the adoption of maize and wheat technologies in eastern Africa, propose a similar
framework. They classify factors associated with farmers’ adoption decisions into four categories: farmers’ socio-demography characteristics, institutional factors, farmers’ perception of the characteristics of technologies, and economic attributes.
1 In the TIA 2007 survey, improved varieties are defined as varieties that are commercially packaged and
sold. Therefore, in this study, the definition of improved maize and beans adoption is limited to the adoption of improved maize and bean varieties that were commercially packaged and sold. Adopters are limited to farm households who used commercially packaged of maize and bean varieties in the 2006/2007 agricultural year.
13
2.3.1. Farmers’ Socio-demography Characteristics
According to Doss et al. (2003), numerous studies of technologies adoption in developing countries have used farmers’ socio-demography characteristics (e.g.,
household heads’ gender, age, education, household size) to explain household adoption behaviors. A few of these studies report that the rate of technology adoption is higher among male-headed households, compared to female-headed households because of discrimination (i.e., women have less access to external inputs, services, and information due to socio-cultural values).
Adesina and Forson (1995), who studied farmers' adoption of new agricultural technology in Burkina Faso and Guinea, report that both young and old sorghum farmers in Burkina Faso adopt new technology. Young farmers adopt the technology because they have long term plans and are willing to take risks. On the other hand, old farmers adopt it because they have accumulated capital or have greater access to credit, due to their age. However, the effect of farming experience (measured by the age of the household head) is not always positively associated with farmers’ adoption behaviors. For example, Zavale et al. (2005) report that older farmers in Mozambique are less likely to adopt improved maize variety than younger farmers.
Feder et al. (1985) provide empirical evidence on the importance of human capital (e.g., farmer’s education) on technology adoption. They argue that education enhances the ability of farmers to acquire, synthesize, and quickly respond to disequilibria, thereby increasing their likelihood of adoption of new agricultural technologies. According Adegbola and Gardebroek (2007), educated farmers are able to better process
information, allocate inputs more efficiently, and more accurately assess the profitability of new technology, compared to farmers with no education. Zavale et al. (2005) and
14
Uaiene et al. (2009) report that the level of education attained by households in
Mozambique is positively associated with households’ adoption behaviors. The authors suggest that education positively influences households to quickly respond to their current low agricultural productivity by adopting new agricultural technologies that increase productivity, household income and its standard of living. However they also report that most household heads in Mozambique are illiterate and had attended school for only a few years.
According to Feder et al. (1985), some new agricultural technologies, including improved varieties, are more labor intensive, compared to traditional varieties. Thus, labor shortage may prevent farmers from adopting new agricultural technology. The authors argue that a household with a large number of family members who are available to work on the farm are more likely to adopt new technologies than household with a small number of family members.
2.3.2. Institutional Factors
Institutional factors (e.g., having access to extension services, credit, roads, price information from markets, being a member of an agricultural association) have been widely used to assess farmers’ adoption behavior. Pattanayak et al. (2003) argue that access to extension services provided by the government, NGOs, and other stakeholders play a very important role in the adoption of new agricultural technologies. Farmers who are exposed to information about new technologies by extension agents (through training, group discussion, plots demonstration, and other form of information delivery) tend to adopt new technologies. An empirical study by Boughton and Staatz (1993) suggests that in Mali, the farm-level adoption rates for improved maize varieties could be significantly
15
increased by an extension program that tailors varietals promotion to individual farmers’ needs and circumstances.
Capital constraints and limited access to credits hinder the adoption of agricultural technologies. These factors especially apply to new inputs or technologies that require a high initial capital investment and high operational costs (Feder et al. 1985). However, a few empirical studies report that some new technologies that do not require a high initial capital investment (e.g., improved varieties) also have low adoption rates because farmers do not have sufficient capital and access to credits. For example, Uaiene et al. (2009) and Zavale et al. (2005), who analyzed agricultural technologies adoption in Mozambique, using TIA 2002 and 2005 data, report that difficulty in accessing credit appears to be one of the major constraints to adoption.
Bandiera and Rasul (2005), who analyze social networks and technology adoption in Northern Mozambique, report that the likelihood of adopting new technologies is high among farmers who have access to paved road, markets, and farmer associations because they are more likely to be exposed to information about the potential benefits of new technologies, contact with extension agents, as a result of market exposure, and from interactions with other association members.
2.3.3. Farmers’ Perception of Characteristics of Technologies
Perceptions of the characteristics of new agricultural technology are also important factors that are associated with farmers’ demand for new agricultural technologies (Adesina and Forson, 1995). Farmers may subjectively evaluate the technical and cultural aspects of technologies differently. Thus, understanding farmers’ perceptions is important in designing and promoting agricultural technologies (Uiene et
16
al., 2009). In general, farmers’ perceptions of the characteristics of new agricultural technologies are divided into three main categories: yield performance, cost
requirements, and risks.
Feder et al. (1985) argue that yield performance (or expected yield of new varieties) is one of the characteristics of improved varieties that affect farmers’
technological adoption behaviors. Several empirical studies show that the adoption rate of improved varieties is high, if the varieties meet farmers’ expectations. An improved variety will be adopted at exceptionally high rates, if the new variety is technically and economically superior to local varieties. Improved varieties are technically superior if they produce higher yield than traditional varieties. For example, Adesina and Forson (1995) report that farmers in Burkina Faso adopted a modern sorghum variety because it gave high yield, compared to the traditional sorghum variety that farmers planted in previous agricultural years.
Neill and Lee (2001) argue that farmers’ adoption of new agricultural technologies is also affected by farmers’ perception of the amount of initial capital investment and labor requirements they will have to allocate if they adopt the underlying technology. Martel et al. (2000), who conducted a case study of the marketing of dry beans in Honduras, argue that farmers adopt new agricultural technologies because they perceive that a new technology could reduce labor requirements and other associated costs, and reduce losses due to risk (i.e., crop diseases) during production and/or post harvesting. Furthermore, they argue that bean farmers always compare the new bean variety to their current variety. Farmers are more likely to adopt a new bean variety if it
17
performs well under different environmental conditions, shows economic profitability, and is resistant/tolerant to disease and insects.
Adegbola and Gardebroek (2007), who analyzed the effect of information sources on technology adoption and modification in Benin, report that in addition to considering yields, direct costs, and profits associated with improved maize seeds, farmers also consider seed characteristics that reduce risks, because damages from insects and/or disease during maize production and storage can result in substantial yield losses and poor grain quality. In some circumstances, these losses not only increase the risk of food insecurity for the farmers’ households, but may also decrease farmers’ income -- if the losses in quantity are not sufficiently compensated for by a price increased due to deficit in national supply. With respect to risks, several other studies report that farmers also consider environmental aspects, such as whether or not the improved varieties were developed for local climate and soil fertility conditions (Ramirez, 2003), or for variations in local agro-ecological patterns (Doss, 2003).
2.3.4. Risks and Economic Attributes
Farmers have heterogeneous beliefs about new agricultural technologies and the economic profitability of new agricultural technologies is uncertain. Early adopters are farmers who adopt first, while late-adopters wait and observe the experiences of early-adopters. After obtaining information about the technology from early-adopters, they decide whether or not to adopt the technology based on the economic profitability (Shampine, 1998; Basley and Case, 1993). According to Feder et al. (1985) and Adegbola and Gardebroek (2007), farmers who are aware of a certain agricultural technology component will decide whether or not to adopt it by evaluating the expected
18
economic profitability or benefit that they anticipated will be gained, taking into account the initial investment and variable costs. An agricultural technology is more likely to be adopted if the gain or profit exceeds the aggregate investment and variable costs. Furthermore, they argue that the technological adoption rate varies over time because socioeconomic groups have different adoption behaviors and farmers’ adoption decisions for the next growing period depends on the initial impact of the technology, profitability, and other farmers previous experience. Researchers of technological adoption studies often use economic attributes variables (e.g., farm size, land tenure, farm location, farmers’ growing other cash crops, and adoption of other complementary technologies like fertilizer) to explain farmers’ adoption behaviors.
With respect to the impact of farm size and land tenure on farmers’ adoption behavior, Uaiene et al. (2009) and Pattanayak et al. (2003) find no consistent
relationship between these two factors. They report that farmers with easy access to land are less likely to adopt land-saving technologies (e.g., fertilizer and pesticide) because land is abundant. Furthermore, land owner are more likely to adopt agro-forestry and other conservation technologies to preserve their land.
Cornejo and McBride (2002), who conducted a study of adoption of
bioengineered crops in the United States, evaluate the impact of farm location (e.g., distance from roads, soil fertility, and climate condition in that location) on new technology adoption. They argue that farmers who own land with poor biophysical production conditions usually adopt new agricultural technologies (e.g., fertilizer) to alleviate these conditions. In contrast, despite good soil conditions and climates, farmers may still consider the accessibility to roads, and agricultural inputs and outputs market.
19
Boughton and Staatz (1993) argue that rapid adoption of improved maize in Mali was facilitated by the prior development of cotton. Adoption of improved maize
varieties is associated with mechanization used in a cotton project because farmers need appropriate equipment to plow and weed their farms in a timely manner. In addition, the availability of residual fertilizer from the previous year's cotton fields reduces farmers’ cash outlays for maize production.
Pandey (1999), who conducted a study of rice production technology adoption in the Philippines, found that fertilizer responsiveness of modern varieties was one of the factors that led to a rapid increase in yields and the level of fertilizer use. Drawing on this finding, they suggested that agricultural technologies can be introduced as a package, if the technology components are complementary.
2.4. Chapter Summary
The rapid responses to new agricultural technologies in some developing countries has resulted in a sustainable agricultural development and increased
agricultural productivity, which has contributed to overall economic growth, ensuring food security, and reducing poverty.
Adoption of technologies may be conceptualized at two different levels: aggregate and individual (farm-level) levels of adoption. Aggregate adoption is defined as the adoption of an agricultural technology by a population within a region. In contrast, farm-level new technological adoption is defined as when an individual farmer adopts a new technology. The farm-level new technological adoption is an important factor affecting the level of economic return to agricultural research. Factors affecting farm-level
20
adoption include off-farm economic constraint and opportunities that are communicated through off-farm input and output markets. Also, the rate of new technology adoption at the farm-level depends on the extent to which the new technology enables farmers to respond to the evolving preferences of off-farm clients for different product
characteristics, as reflected in market prices.
Defining agricultural technological adoption is complex. Studies carried out by CIMMYT have used several different adoption definitions to distinguish between, for example, varieties that were originally introduced as certified hybrids but have been repeatedly recycled (e.g., farmers plant seed from a previous harvest) versus planting new hybrids. Also, it is necessary to distinguish between farmers who continue to use a newly adopted technology from those who discontinue using it.
Farmers’ adoption of new agricultural technologies is influenced by many factors. In general, these factors are classified into four categories: farmers’ socio-demography characteristics, institutional factors, farmers’ perception on characteristics of
technologies, and risks and economic attributes. Association between these factors and farmers’ adoption behaviors is not always consistent. Many agricultural technology adoption studies have shown that while a factor may be associated positively in a region, but the same factor may have an inverse (or no) association in other studies or in
different regions/countries. Adoption studies attempt to explain the association between various factors and farmers’ adoption behaviors, and estimated the magnitude and the significance of the estimated parameters.
21
CHAPTER III: KEY ASPECTS OF MOZAMBIQUE
3.1. Introduction
This chapter presents an overview of Mozambique. The chapter is divided into five sections. The second section presents physical and socio-economic characteristics, including geography and agro-ecology, climate, and demographic features. The third section provides a brief background on Mozambique’s economy, focusing on
macroeconomic and financial policy, infrastructure, roads, transportation, electrification, and poverty. The fourth section describes Mozambique’s agricultural sector, focusing on agricultural development and its challenges, livestock production, agricultural land use, agricultural inputs use, and cash and staple food crops production. The fifth section summarizes the chapter.
3.2. Physical and Socioeconomic Characteristic 3.2.1. Geography and Agro-ecology
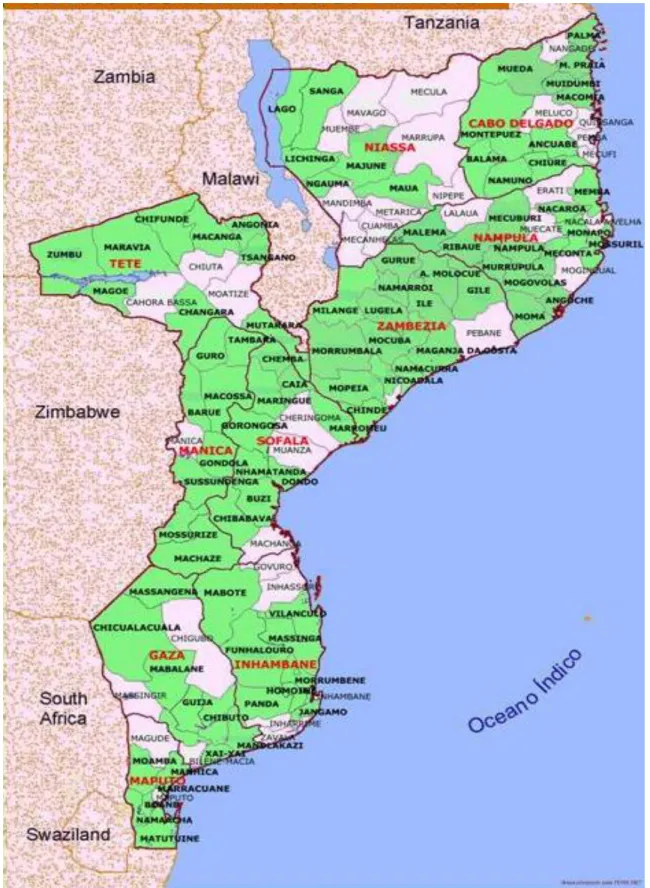
Mozambique, which is located along Africa’s southeast coast, has an area of 309,494 square miles (801,590 km2) – slightly larger than Texas (268,601 square miles). The country is bordered by Tanzania on the north, Malawi, Zambia, and Zimbabwe on the west, and South Africa and Swaziland on the south. Administratively, Mozambique is divided into ten provinces (provicias) and a capital city, 128 districts (distritos), and 405 administrative posts (postos administativos).The country terrain includes lowlands (mostly along coastal area in the east), uplands in the center, high plateaus in the
northwest, and mountains in the west (FAO, 2009; Nation Master, 2009; CIA World Fact Book, 2009).
22
Figure 3.1.Map of 94 Districts Participated in TIA 2007
23
3.2.2. A Brief History of Mozambique
Mozambique gained independence from Portugal in 1975, after almost five centuries under Portuguese colonial administration. However, until the early 1990s, Mozambique faced challenges to develop due to a complicated historical heritage that included a period of colonization that put little emphasis on human capital, a failed socialist experience, large-scale emigration, economic dependence on neighboring countries such as South Africa, drought, and a long civil war. Since the long civil war ended in 1992, as a result of the peace agreement between opposing groups,
Mozambique has made remarkable progress in its economic development and is now considered one of the most politically stable countries in Africa (PARPA II, 2006).
3.2.3. Climate
Similar to many countries in Sub-Saharan Africa, Mozambique has areas with a tropical and subtropical climate and two seasons, a dry and a wet season. The dry season is from April to September and the wet season is from October to March. Climatic conditions vary, depending on altitude. Rainfall is heaviest along the coasts, but decreases in the northern and southern parts of the country. Annual precipitation also varies, depending on the regions. However, it ranges between 500-900mm. In addition, Mozambique is drained by five principal rivers and several smaller ones (FAO, 2009; Nation Master, 2009; CIA World Fact Book, 2009).
3.2.4. Demographic Features
According to the Instituto Nacional de Estatistíca (2009), in 2007 Mozambique had a total population of 20,905,585. Nampula Province is the most populated province,
24
with more than 4 million people; while Maputo city is the least populated area with only 1.09 million people (Figure 3.2).
From 2005 to 2007, the population grew at annual rate of 2.4 percent (World Bank, 2008). Population density averaged 24 people per square kilometer. In 2007, the birth and death rates were 38.5 and 20.5 per 1,000, respectively, the infant mortality rate was 109.93 deaths per 1,000 live births, the sex ratio at birth was 1.02 male per female, and the fertility rate was 5.3 children per woman (INE, 2009; CIA World Factbook 2009).
Source: Instituto Nacional de Statistica (INE), 2009
3.3. The Economy
3.3.1. Macroeconomic and Financial Policy
Several factors have contributed to the country’s economic expansion and development, including macroeconomic stability, policy reform in all sectors, growth in agriculture, post-war reconstruction, mega-projects, and strong support from its
0 500,000 1,000,000 1,500,000 2,000,000 2,500,000 3,000,000 3,500,000 4,000,000 4,500,000
Figure 3.2. Mozambique Population
in Each Province, 2007
25
development partners (donors). The World Bank (2008) reported that over the period 1996-2005, Mozambique GDP grew at an average rate of eight percent per year, which was the highest in Africa for a non oil-producing country. At the same period, the government of Mozambique raised the living standard of three million people to above the poverty line. This achievement contributed to a 35% decrease in infant and child (under five years old) mortality, and a 65% increase in primary school enrollment. However, these achievements are also attributed to the end of the civil war – referred to as the post-conflict effect.
The government 2006-2009 Action Plan for the Reduction of Absolute Poverty, known as PARPA II (Plano de Acção para Redução da Pobreza Absoluta) gave priority to implementing development strategies and policy reforms that focus on developing human capital, good governance, ensuring macroeconomic stability, investing in basic infrastructures, and improving agriculture and the rural economy. Overall, the goal of the government’s plan was to help the country to achieve a sustainable economic
development and growth, increase productivity in agricultural sector, and increase standard of living and reduce poverty by 15% (PARPA II, 2006).
Between 2005 and 2008, Mozambique’s GDP increased by eight percent
annually, although the growth rate decreased in 2007 and 2008, compared to the previous two years. It is estimated that in 2008 income per capita average $340. The inflation rate averaged slightly below six percent from 2005 to 2007. The services sector is the biggest contributor to GDP (47%), followed by the agricultural sector (28%), and the industrial sector (26%) (Table 3.1). Additionally, imports (free on board) totaled $3.633 billion, which was greater than the export revenue of $2.511 billion in 2008. Mozambique’s
26
export commodities are contributed by several sectors. The country main exports are aluminum, cashews, prawns, cotton, sugar, tobacco, bulk electricity, and natural gas (World Bank, 2009).
Table 3.1. Mozambique’s Economic Growth Indicators, 2005-2008 a
Economic Indicators Year Total Mean
2005 2006 2007 2008* Services, etc. (% of GDP) 48 46 47 47 188 47 Agriculture (% of GDP) 27 28 28 28 111 28 Industry (% of GDP) 25 27 26 25 103 26 GDP (US$ billions) 7 7 8 10 32 8 GDP growth (annual %) 8 9 7 7 31 8 *
Estimates (other sources report different numbers)2. a
Source: World Bank, Development Indicators Database, April 2009
Mozambique’s financial system is considered weak, characterized by only a few financial institutions. Limited access to credit is a challenge that hinders agricultural and overall economic development. The government’s Strategy Plan for Reduction of Poverty seeks to overcome this constraint by developing a modern financial system that is
comprehensive in social and geographical terms (PARPA II, 2006). The goal is to
increase the monetization of the nation’s economy and finance activities of the productive sectors. These improvements in the financial system are expected to help farmers to access sufficient capital to purchase agricultural inputs (e.g., improved seeds, fertilizer, pesticide, tractors, labor), and thereby stimulate adoption of agricultural technologies, increase agricultural productivity, increase farmers’ income, and improve farmers’ standard of living.
2 The CIA factbook estimates that GDP per capita in Mozambique was $900 in 2008, and the GDP
27
3.3.2. Infrastructure, Road and Transportation, and Electrification
A lack of infrastructure in all productive sectors is a key constraint to
development in Mozambique. The World Bank (2008) reports that the rural population’s poor access to good road networks and high transport costs hinder both social
development and economic productivity. Poor road access between rural and urban areas is a major constraint for increasing agricultural productivity. This challenge limits rural farmers’ and rural communities’ ability to access government services, agricultural inputs and market agricultural, and other home industry products. Road density per land area is estimated to be 0.05 kilometers of road per square kilometers. Currently, rural roads serve only approximately 41% of the rural population. Furthermore, the percentage of the population with access to the road networks declines in the wet season due to poor road conditions. The objectives of the government’s road development strategy is to increase the rural population’s access to the road networks in order to facilitate marketing of agricultural inputs and outputs, which is essential for developing the rural sector.
The energy sector plays a crucial part of the social-economic development in Mozambique. Increasing production and distribution of energy for both domestic or household consumption and business activities is essential for the country. While
Mozambique has a huge potential for the production of hydroelectric power, the index of rural community access to electricity is relatively low. The government seeks to increase access to electricity by replacing district-level diesel electric plants with the national electric grid, developing potential natural resources for a hydroelectric generation, and identifying alternative sources of electricity generation to use in areas that are isolated from the national electricity grids (PARPA II, 2006).
28
3.3.3 Poverty
Poverty in Mozambique is defined as ―the impossibility, owing to the inability and/or lack of opportunity for individuals, families, and communities to have access to the minimum basic conditions, according to the society’s basic standards‖ (PARPA II, 2006). Between 1997 and 2003, the country successfully reduced the headcount poverty index by approximately 15% -- from 69% to 54%. With continued progress in overall economic development, by 2009 the headcount poverty index was expected to decline from 54% to 45% (PARPA II, 2006).
Despite the fact that the poverty index declined over the past decade, the situation is still critical for Mozambique because ten million Mozambicans still live under the poverty line of approximately $2 per capita per day (PARPA II, 2006). The incidence of poverty varies between region, due to each province and region having a different level of access to market and opportunities for economic diversification. Furthermore, the incidence of poverty is highest in rural areas.
The World Bank (2008) reports that Mozambique has a relatively high level of absolute poverty and malnutrition, and per capita income was US$340 in 2006, which was low compared to the Sub-Saharan African average of US$500. In order to reduce poverty and meet the Millennium Development Goals (MDG), the World Bank suggests that the country should make significant investments in health care, water, and sanitation services; improve the quality of higher education; and improve gender equity, especially in rural areas. Since poverty is more prevalent in rural areas, increasing agricultural productivity through the diffusion of agricultural technologies and the rehabilitation of infrastructure is also needed to reduce poverty and hunger.
29
3.4. Agricultural Sector
3.4.1. Agricultural Sector Development and Challenges
In Mozambique, small-scale subsistence farming is the dominant agricultural activity. Approximately 95% of the cultivated area is rainfed. The country’s subsistence farms, which average two hectares in size, are cultivated by family members who grow basic food crops (e.g., maize, rice, cassava, groundnuts, beans, sweet potatoes, and sugar cane) mainly for household consumption. On the other hand, a small number of
commercial farms focus on exportable and/or cash crops (World Bank, 2008; Corzine, 2008; FAO 2009).
According to the World Bank (2008), agricultural development is hindered by most farmers living at a near-subsistence level, frequent drought, underutilized irrigation systems, weak rural financial services, poor rural road networks, and low productivity. To achieve sustainable agricultural development, the government has developed a strategy that focuses primarily on improving agricultural productivity, developing efficient irrigation systems, improving access to financial services and market, strengthening and expanding value chains, increasing agricultural commodities exports, and encouraging private sector to participate in agricultural development (PARPA II, 2006).
Despite its low productivity, the agricultural sector plays a very important role in Mozambique’s economy. The World Bank estimates that the agricultural sector
accounted for an average of 28% of GDP during 2005-2008. This sector also employs three-fourths of the total labor force (FAO, 2009, World Bank, 2008). Another factor that makes the agricultural sector important is the export of agricultural commodities,
including sugar, cashew nuts, cotton lint, tobacco, copra, and tea. According to FAO (2009), exports of sugar, cotton, and tobacco increased from 2004 to 2006 (Table 3.2).
30
During the period from 2002 to 2006, the country exported an average of approximately 48,000 tons of sugar, 25,000 tons of maize, and 1,000 tons of tea. This indicates that Mozambique has a potential to earn export revenue by increasing the production and export of agricultural commodities that are in demand in the international market.
Table 3.2. Mozambique’s Agricultural Export Commodities (MT), 2002 – 2006
Commodities Year Mean
2002 2003 2004 2005 2006
Sugar Raw Centrifugal 14,000 24,997 43,402 78,151 80,645 48,239 Cashew nuts, with shell 38,447 32,659 39,731 33,492 24,053 33,676
Maize 5,522 3,267 11,965 931 103,210 24,979
Cotton lint 20,274 24,681 19,577 21,235 28,081 22,770
Tobacco 8,328 11,423 11,701 11,701 34,183 15,467
Copra 5,092 5,092 87 87 25 2,077
Tea 2,424 937 586 317 505 954
Source: FAO, April 2009
3.4.2. Livestock Production
Mozambique has the potential to develop its natural resources to increase livestock production for household consumption and to generate income through sales. The most important livestock for household consumption are chickens, goats, sheep, hogs, geese, and rabbits. In contrast, livestock such as cattle are produced mainly for sale. The Ministry of Agriculture (2006) estimated that the inventory (population) of small-and medium-size livestock varied from year-to-year during 2002 to 2006. During this five-year period, chickens were the most important small-scale livestock (17.6 million), followed by goats (4.7 million) and geese (5.7 thousand). Cattle, one of the most important big-scale livestock, accounted for more than a million in population during 2002 to 2006 (Table 3.3).
31
Table: 3.3. The Small- and Medium-Size Livestock Population in Mozambique, 2002 - 2006.
Description TIA02 TIA03 TIA04 a) TIA05 TIA06 b) Mean
Chicken 22,318,927 17,646,679 15,931,840 14,217,000 18,080,152 17,638,920 Goat 4,912,126 4,747,901 4,838,451 4,929,000 4,254,896 4,736,475 Hogs 1,600,884 1,354,070 1,492,535 1,631,000 1,183,203 1,452,338 Cattle 791,179 969,317 1,106,159 1,243,000 1,054,797 1,032,890 Sheep 183,116 136,194 166,597 197,000 144,916 165,565 Rabbit 83,369 60,887 62,944 65,000 95,904 73,621 Goose 5,205 12,448 7,224 2,000 1,676 5,711 a) Estimate data b) Preliminary data
Source: Ministério da Agricultura/ Direcção Nacional de Economia - Inquéritos Agricolas, 2009
3.4.3. Agricultural Land Use
Mozambique has a total land area of approximately 78, 638 square kilometers, of which 62 percent (48,800 square kilometers) is agricultural land, 24 percent (19,162 square kilometers) is forest land, and 14 percent (10,676 square kilometers) is used for other purposes. Of the total agricultural land, 90 percent (44,000 square kilometers) is permanent meadows and pasture, nine percent (4,450 square kilometers) is arable land, and only one percent (350 square kilometers) is for permanent crops (Table 3.4).
According to FAO (2009), disputes over land, pasture, water and other abundant natural resources among community members are rare, due to Mozambique having a low population density (estimated: 24 people per square kilometer, 2007). However,
Mozambique’s land law, which allows individuals or companies to acquire land for their commercial interests, has increased the number of foreign farming companies seeking land to produce cash crops.
32
Given its abundant natural resource, Mozambique has a potential to increase the production of staple food crops, cash crops, and livestock through both intensification of land use and expanding the area of the typical farm, which is currently less than two hectares. However, farmers can only expand their farms size if they are supported by a development program that increases farmers’ knowledge, helps farmers to access capital, strengthens the input and output marketing system, and increases farmers’ use of
agricultural technologies.
Table 3.4.Mozambique’s Land & Agricultural Land Distribution (000ha), 2007
Land Distribution Area (ha) Percentage
Agricultural area 48,800 62%
Forest area 19,162 24%
Other land 10,676 14%
Total Land area 78,638 100%
Agricultural Land Distribution
Permanent meadows and pastures 44,000 90%
Arable land 4,450 9%
Permanent crops 350 1%
Total Agricultural Land 48,800 100%
Source: FAO, 2010
3.4.4. Agricultural Inputs Use
According to Uaiene et al. (2009), while modern agricultural inputs are currently available in Mozambique, farmers’ adoption is still relatively low. The use of modern inputs (e.g., tractors, ploughs, improved seeds, fertilizers, pesticides, and irrigation) is limited to larger farms in the lowland (FAO, 2009; Bias and Donovan 2003). Various factor that limit farmers’ adoption of modern agricultural inputs including farmers’ socio-demography characteristics (e.g., household head’s education, age, gender), economic
33
attributes (e.g., access to market, income), farmers’ preferences (e.g., varieties that are disease tolerant), institutional factors (e.g., access to extension services and credit), and availability of new technologies (Feder et al., 1985; Doss et al., 2003).
Based on analysis of TIA data (2002, 2005), the adoption rate for fertilizer, pesticide, and animal traction was estimated to be below 12% (Figure 3.3). Various technologies adoption studies (e.g., Uaiene et al., 2009, Zavale et al., 2005) have
indentified many factors that contribute to low agricultural productivity in Mozambique, including the low adoption rate of modern agricultural inputs. These empirical studies suggest that to increase agricultural productivity, stakeholders (e.g., the government, research institutions, and private sector) must invest in strengthening agricultural research and extension programs.
Source: TIA 2002 and 2005. Copy from Uaiene et al, 2009.
Fertilizer Pesticide Animal Traction
3.5
5.1
8.6
3.7
6.7
11.2
Figure 3.3. Agricutural Technology Adoption Among
Households in Mozambique (2001/02 & 2004/05)
34
3.4.5. Cash Crops and Staple Foods Production
As Mozambique’s agriculture sector supplies some of its local-produced cash crops to international markets, it is important to review trends in the (2003-2007) harvested area of the country’s most important cash crops. FAO estimated that the average harvested area of the five most important cash crops ranged from an average of 169,000ha to 6,000ha: sugar cane (169,000 ha), coconuts (70,400 ha) cashew nuts (50,000 ha), sunflower seeds (22,000 ha), tobacco (8,260 ha), and tea (5,670 ha). Sugar cane, tobacco, and coconut are processed before they are sold in international markets (Table 3.5).
For cashew nuts and sunflower seeds, the harvested area remained constant from 2003 to 2007, (Table 3.5). However, for most cash crops, the harvested areas varied from year-to-year. For example, the harvested area for sugar cane ranged from 150,000 to 185,000 hectares and ranged from 7,900 to 8,500 hectares for tobacco.
Table 3.5.Mozambique's Cash Crops Harvested Area (000 ha), 2003 - 2007
Commodities Year Mean 2003 2004 2005 2006 2007 Sugar cane 160 150 185 170 180 169 Coconuts 70 72 70 70 70 70.4
Cashew nuts, with shell 50 50 50 50 50 50
Sunflower seeds 22 22 22 22 22 22
Tobacco 8.5 8.5 8.5 7.9 7.9 8.26
Tea 5.65 5.65 5.65 5.7 5.7 5.67
Source: FAO, April 2009.
In contrast, staple food crops are mainly produced for domestic consumption. FAO (2010) data indicates that from 2004 to 2008, the average harvested area and production of the important food crops were cassava (1,391,120 ha, 5,950,925 MT),
35
groundnuts (946,100 ha, 1,338,964 MT), pulses (408,552 ha, 205,000 MT), rice (294,384 ha, 131,432 MT) and sorghum (169,720 ha, 93,319 MT) (Table 3.6).
Increasing production of food crops to meet domestic consumption is necessary to guarantee household food security and reduce poverty. It is possible to increase food crops by allocating more land to these crops, encouraging farmers to adopt agricultural technologies, and rehabilitating irrigation infrastructure.
Table 3.6. Harvested Area (ha) and Production (MT) of Important Crops, 2004-2008
Harvested Area (Ha)
Crops 2004 2005 2006 2007 2008
Mean
Cassava 1,311,600 1,230,000 1,664,000 1,350,000 1,400,000 1,391,120 Groundnuts, with shell 1,068,500 1,105,000 857,000 850,000 850,000 946,100 Pulses 528,761 488,000 406,000 300,000 320,000 408,552 Rice 293,921 293,000 295,000 295,000 295,000 294,384 Sorghum 178,601 180,000 160,000 165,000 165,000 169,720
Production (MT)
Cassava 6,412,770 6,500,000 6,764,609 5,038,623 5,038,623 5,950,925 Groundnuts, with shell 1,437,040 1,403,000 1,417,800 1,152,050 1,284,930 1,338,964 Pulses 205,000 205,000 205,000 205,000 205,000 205,000 Rice 177,419 174,000 99,173 104,655 101,914 131,432 Sorghum 90,232 93,000 85,977 102,932 94,454 93,319 Source: FAO, 2010
3.4.6. Maize and Beans
Maize and beans are two staple food crops that are widely produced primarily for domestic consumption. Empirical studies (e.g., Zavale et al., 2005; Uaiene et al., 2009) report that households’ adoption of improved varieties for food crops such as maize, rice, groundnuts, beans, and cowpeas is relatively low. In the 2004/2005 agricultural year, the adoption of improved varieties varied among provinces (Table 3.7). For example, only approximately seven percent of farm households planted improved maize varieties and
36
approximately 11% planted improved bean varieties. This suggests that there is a potential to expand the diffusion of agricultural technologies, including improved varieties to farm households in Mozambique.
Table 3.7. Percentage of Household Adopted Improved Varieties in Mozambique by Province , 2004-2005 Province Improved Varieties Maize Rice Small Groundnut Large
Groundnut Beans Cowpeas
Cabo Delgado 2 0 1 2 0 0 Gaza 4 6 10 5 7 4 Inhambane 5 9 12 7 30 7 Manica 15 0 6 8 15 5 Maputo 13 7 50 12 26 10 Nampula 6 4 2 3 11 4 Niassa 6 3 2 0 2 3 Sofala 5 2 3 4 9 3 Tete 11 8 6 3 4 3 Zambezia 5 4 3 8 7 3 Total 72 43 95 52 111 <