16
Journal of Insurance Issues, 2008, 31, 1, pp. 16–42.
Copyright © 2008 by the Western Risk and Insurance Association. All rights reserved.
Experience Rating and Subsequent
Employer Claims: The Wisconsin
Experience
*
Michael M. Barth, Robert W. Klein, and Gregory Krohm
**Abstract: This paper examines the effect of changes in employers’ experience rating modifications on their subsequent lost-time claims for workers’ compensation insur-ance. Our research is motivated by significant interest in the impact of experience rating on employers’ incentives and efforts to make workplace safety improvements to reduce worker injuries and workers’ compensation claims. Previous research related to this topic tends to support the hypothesis that pricing incentives improve safety and reduce injuries, but there are number of limitations to this research and most workers’ compensation experts believe that more empirical evidence is needed. Our study uses data on individual employer claims experience—the first time that data at this disag-gregated, micro level has been examined—to further explore this research question. Our examination of individual firms’ workers’ compensation lost-time claim experi-ence provides further support for the contention that experiexperi-ence rating has the intend-ed effect of improving safety and rintend-educing worker injuries and claims. More specifically, our analysis yields supporting evidence of an ex post pricing effect— increases in employers’ experience modifications are associated with decreases in the number of their lost-time claims in subsequent years. We also find that the number of claims tends to increase with employer size as measured by its covered payroll, but the rate of increase declines as an employer’s payroll grows. This is consistent with the proposition that there are economies of scale associated with the returns from employ-er investments in safety. [Key words: expemploy-erience modification factor, workemploy-ers’ com-pensation, workplace safety.]
*The authors express their appreciation for the helpful comments of anonymous reviewers that contributed to significant improvements in the article.
**Michael M. Barth is an Associate Professor of Finance at The Citadel, the Military College of South Carolina. Robert W. Klein is an Associate Professor of Risk Management and Insur-ance and Director of the Center for Risk Management and InsurInsur-ance Research at Georgia State University. Gregory Krohm is a Lecturer at the University of Wisconsin–Madison and Director of the International Association of Industrial Accident Boards and Commissions.
INTRODUCTION
This paper contributes to the empirical research on experience rating in workers’ compensation (WC) by exploring the relationship between changes in WC insurance experience rating modification factors (ERMFs) and employers’ subsequent time claim counts (i.e., the number of lost-time claims) using a large sample of experience-rated Wisconsin
employ-ers.1 Lost-time claims are claims that generate income replacement benefits
because the injured worker was unable to work for a period of time sufficient to apply for income benefits. Claims that are not classified as “lost-time” only generate compensation for medical expense benefits and are typically labeled as “medical-only” claims. Lost-time claims are used in this analysis because they represent more costly claims that workplace safety programs may be more likely to affect and they have a greater impact
on an employer’s ERMF.2
The effects of experience rating are of significant interest to various stakeholders in WC in both the private and public sectors. These stakehold-ers include workstakehold-ers, employstakehold-ers, insurstakehold-ers, and government officials involved in the regulation or administration of workers’ compensation. Internationally, the concept of experience rating in WC is strongly debated, and countries vary greatly in their approach to WC pricing or funding mechanisms (see Klein and Krohm, 2006). As discussed by Klein and Krohm (2006), many public officials, WC experts, and others in various countries question the merits of experience rating, including its effects on safety and worker injuries.
The concept of risk-based pricing of insurance is widely accepted by many scholars and practitioners. Risk-based pricing is believed to have a number of desirable effects, including the mitigation of adverse selection, protection against insurer insolvency, and, under some circumstances, the enhancement of incentives for insureds to reduce their risk of loss. One of several devices used to construct risk-based prices in commercial insur-ance, especially in WC, is experience rating. The United States, Canada, and Australia employ experience rating systems that are similar in a general sense; systems in other countries vary widely and a significant number of countries do not use experience rating in any form. In lieu of tying rates to loss experience, most countries offer financial incentives for employers to participate in safety practices or rely on the effectiveness of regulation and inspections by government safety regulators. Hence, views and practices differ as to how to encourage employers to increase workplace safety and whether experience rating has any beneficial effects in this regard.
In the opinion of its proponents, experience rating serves several purposes (NCCI, 2006). First, it helps to mitigate inequities in class rating
arising from the heterogeneity of employer risk levels within each WC
rating classification.3 Second, it creates an incentive for employers to reduce
injuries and their severity.4 Third, it is used by third parties that may want
to contract with a firm as a signal of the firm’s safety and reliability. As noted above, while experience rating is an established practice in WC insurance in the United States and certain other countries, its merits and effects continue to be a matter of disagreement. One of the prominent questions in this debate is whether experience rating motivates employers to undertake measures to reduce accidents and worker injuries and ulti-mately results in greater safety and fewer (and perhaps less severe) worker injuries and WC claims. The literature and previous research on this question tends to support the safety effects of experience rating, but many experts consider the evidence to be insufficient in terms of providing adequate support for such effects (Klein and Krohm, 2006).
We should note that because of data limitations and the many factors affecting employers’ claims experience, it is difficult to definitively “dem-onstrate” that experience rating causes employers to improve safety and reduce claims. This is one of the reasons why there are only a limited number of studies that provide substantive empirical evidence related to this question. At best, researchers can examine existing data and new data in different ways to see whether they contribute additional support to this hypothesis about firm safety incentives, behavior, and outcomes (or not).
Several previous econometric studies of the effects of WC pricing and experience rating on safety outcomes (that address their relationship indi-rectly) have been published, but this study is unique in several respects. First, it estimates the experience rating–claims relationship using a large sample of individual employer data; previous studies have relied on data aggregated at a state or industry level. Second, this study includes several variables to control for the risk characteristics of individual employers. Finally, it explores the interaction of employers’ payroll size and their subsequent claims experience. Specifically, we test how changes in an employer’s ERMFs are associated with its subsequent number of WC lost-time claims. Our results are consistent with the hypothesis that increases in an employers’ ERMFs tend to lead to a subsequent decrease in the
number of its WC claims.5
Our paper begins with a discussion of how experience-based adjust-ments of an employer’s WC premiums might induce it to increase its expenditures on improving safety and reducing accidents, injuries, and claims. This includes a brief description of the experience rating system used in the United States for readers who are not familiar with it. We then review previous research related to this topic, its indications and its limi-tations. This is followed by an explanation of the nature of the data that we
utilize for our analysis and the methods we employ to estimate the rela-tionship between employers’ ERMFs and the number of their lost-time claims in subsequent years. We then present our empirical results and their qualifications. We conclude with a summary of our findings and discuss areas for future research.
EXPERIENCE RATING,
SAFETY, AND CLAIMS EXPERIENCE
The primary research question addressed by this analysis is whether the experience-based adjustment of employers’ WC insurance premiums has any measurable effect on their subsequent reported number of lost-time claims. It is important to provide a brief explanation of how experience rating is implemented in WC insurance in the United States. Class rates of employers meeting minimum premium requirements are modified on the basis of their relative claims experience over the previous three years. In essence, the first step in the calculation of an employer’s WC premium is multiplying its classification rate (also called its manual rate) by its expo-sure units (one unit is equal to $100 of covered payroll). This results in what is labeled as an employer’s “manual premium.” The manual premium is then adjusted by multiplying an employer’s manual premium by its ERMF, for those employers that are experience rated. Employers with manual premiums below a certain amount, e.g., $5,700, are not subject to experience rating. In the United States, the basic formula for calculating an employer’s ERMF is:
ERMF = (ALR – ELR)/ELR where:
ERMF = experience rating modification factor ALR = actual loss ratio
ELR = actuarially computed expected loss ratio (assigned by classifi-cation).
A more detailed formula and explanation of the complex methodology used to calculate ERMFs is presented in a technical appendix; a number of adjustments and factors are used to calculate an ERMF that actuaries believe is more accurate or appropriate for a given employer. If the ERMF is less than 1.0, then the employer’s experience-adjusted premium is less than its manual premium. If the ERMF is greater than 1.0, then the employer’s experience-adjusted premium is greater than its manual premium. From an actuarial perspective, the underlying rationale for experience rating is that it adjusts for firm-specific risk variation within a
given classification (employers are classified according to the nature of their principal operations or type of business, as explained further below). From an economic perspective, experience rating should have a dual function—adjusting for firm risk differences within classifications and also encouraging some employers to improve safety if it is cost-efficient and
feasible for them to do so.6
As noted above, the formula used to develop ERMFs and the rules governing their application to employers are more complex than the
sim-plified description we provide here.7 The formula contains several
ele-ments to temper the impact of large claims and adjust the weight of a given employer’s experience according to its size. This reflects the higher statis-tical credibility of the loss experience of large employers. The low credibil-ity of small employer experience is reflected in the fact that an employer must meet certain minimum premium requirements to be subject to expe-rience rating. The formula also limits the impact of a single catastrophic claim. Further, ERMFs are more affected by claim frequency than claim severity as the former is believed to be a better predictor of future claims experience. These provisions are based on actuarial analysis and judgment and must be approved by state insurance regulators. The same basic approach is used in all states, but there is some variation in the factors used and the rules governing its application.
While the focus of this research is on the impact of WC experience rating factors on subsequent WC claim counts, other factors likely affect many firms’ safety efforts and results. A firm that experiences excessive workplace injuries may suffer increased monitoring costs, regulatory pen-alties, adverse publicity, the loss of valuable workers, and other negative consequences. Additionally, employers may take steps to enhance worker safety because of more “altruistic” motives, rather than financial incen-tives. Because of these factors, the analysis presented here should be considered as the first step in a longer journey of research using employer-based data to ascertain the effects of experience rating. More complex models, with additional proprietary data elements, will be necessary to more rigorously measure the effects of insurance pricing on workplace safety distinguished from the myriad of other economic incentives and factors that affect firm behavior and outcomes.
From an economic perspective, in a world of perfect information, firms would be expected to optimize the tradeoff between expenditures on workplace safety and the cost of worker injuries. The economic costs of worker injuries would include those that are incurred through a WC system—insurance premiums and compensation payments retained by the firm—as well as other costs, such as lost productivity and lost investments in the training of an injured worker. We would expect a firm to invest in a
particular safety measure if the marginal cost of the investment is less than
the expected additional reduction in worker injury costs.8 If safety
invest-ments are subject to diminishing returns, firms would be expected to continue to invest in safety until the marginal cost of an additional invest-ment would exceed the corresponding expected reduction in the cost of worker injuries.
Of course, firms do not operate in a world of perfect information, and there are “real world” factors other than the cost of insurance that could affect their safety efforts and worker injuries and WC claims. These other factors may include firm constraints on their ability to improve safety, varying employer attitudes towards safety, worker attitudes and behavior, and insufficient information on which to develop meaningful safety mea-sures. These real-world factors may interfere with the desired effects of risk-based pricing of WC on firms’ safety efforts and worker injuries and claims.
Economists would expect that experience rating will tend to have a positive effect on workplace safety, but it has been difficult to quantify the
significance and magnitude of this effect at the firm level.9 Further, it is
reasonable to postulate that experience rating may have both ex ante and
ex post effects on employer safety efforts. Theory would suggest that there
is an ex ante effect in that firms anticipating higher premiums due to adverse
claims experience might be motivated to increase safety and reduce injuries proactively to avoid higher premiums. Arguably, firms would reap the maximum savings from safety investments by implementing them sooner rather than later, understanding that the anticipated savings or positive cash flows would need to be discounted to a net present value basis.
However, there may be reasons that would cause firms to make certain safety investments only after experiencing worker injuries/claims and receiving an adverse experience modification. One set of reasons has to do with information. Firms may not be aware they have a safety problem until they have actually experienced higher-than-expected worker injuries and WC claims. Indeed, a firm may use its claims experience to acquire information about its safety level and risk of worker injuries. Firms may also use their claims experience to evaluate the effects of the safety mea-sures that they have already implemented before they make further safety investments.
Other factors may interfere with, or run counter to, the expected effects of experience rating. Some firms may be unable or unwilling to improve safety regardless of receiving higher ERMFs. Some employers also may believe (rightly or wrongly) that their adverse claims experience is due to “bad luck” rather than poor safety. Further, as noted above, the cost of safety improvements may exceed the cost of higher experience modifications.
If one examines data on the experience rating and claims experience
of a set of firms for a particular period, there may be a mix of ex ante and
ex post effects confounded in the data. There may be some firms that have
implemented safety measures ex ante to avoid adverse experience
modifi-cations, causing their claims experience and experience modifications to be lower than they would be otherwise. Second, some firms may have implemented safety measures because of adverse experience modifications they received prior to the period from which our data sample is taken. Finally, there may be some firms that implement initial or additional safety measures and achieve a reduced number of claims subsequent to the period of time measured by our data.
Therefore, our ability to discern the full extent of ex ante safety effects
or ex post effects that occurred prior to our sample period is constrained by
the nature of our data. With the data we have for this study, we can test for
empirical evidence of the ex post claims effects resulting from higher
experience modifications received during our sample data period. Our
data do not enable us to test for the ex ante effects of an experience rating
system or the ex post effects of experience rating modifications prior to or
after our sample period. In future research we hope to be able to test for
both ex ante and ex post effects using data from multiple states if such data
can be obtained.
PREVIOUS RESEARCH
There have been several published studies that provide some empiri-cal evidence relevant to the question of how WC pricing and experience rating affects safety, injuries, and claims, but this literature leaves many WC researchers and practitioners unsatisfied. One constraint on this research is that the kind of information that would be highly desirable for research on this topic is not publicly available. This information includes “micro-data” on individual employers that would specify how their pre-miums are adjusted for risk (e.g., experience rating modifications) and their actual claims experience. Ideally, micro-data would also allow researchers to control for other characteristics (firm-specific as well as industry- and state-specific) that influence risk and safety practices, such as the effect of government safety regulation and benefit levels. However, these kinds of data have been difficult to acquire, which probably explains why they have not been used in previous studies. While data on some state-specific factors are available, the lack of employer-specific micro-data for a large number of states precludes the merging of both types of data to develop more extensive models.
Consequently, the previous studies that shed any light on this topic have used proxies for employers’ exposure to experience rating to measure its association with industry-level injury rates or have examined the effect of regulatory systems on safety-related outcomes. These indirect methods have produced results that are interesting—they tend to be consistent with the expectation that more sensitive risk-based pricing improves safety— but they are not considered fully persuasive by most WC experts (Klein and Krohm, 2006). There also have been event studies of injury rates in systems before and after they have strengthened their use of experience rating and surveys of employers regarding their opinions on experience rating systems. However, the event studies cannot control for the effects of other factors or changes coincident with experience rating changes, and the employer surveys are subject to selection bias and many employers’ dis-taste for experience rating regardless of how it affects their actual behavior. The main thrust of many early studies was to measure the relationship between increases or state differences in WC benefits and worker fatalities and injuries (i.e., the moral hazard effect) and not the effect of experience rating on these outcomes. These studies tended to find that higher benefits were associated with lower fatality rates but higher non-fatal injury rates (i.e., the number of fatalities or injuries divided by the number of workers
or worker-years).Chelius and Smith (1983) and Ruser (1985) were the first
to introduce the notion that the experience rating of larger firms could mitigate how benefit increases affected fatality/injury rates. These studies used Bureau of Labor Statistics (BLS) data aggregated by industry classifi-cations as their primary data source and the average number of employees or worker-years per firm or establishment as a proxy for the average firm size within an industrial classification. Industries with higher average workers per firm or establishment were assumed to be subject to a greater degree of experience rating. While this is a reasonable assumption given the data available, the extent to which a firm is experience rated is actually based on the amount of its manual premium, but this information is not collected by the BLS. Hence, the assessment of the mitigating effect of experience rating in these studies is indirect, although this methodological approach is reasonable given the nature of the data sources used and the objectives of the research.
Ruser (1985) found that higher benefits had less of a positive effect on the frequency of injuries in industries with a higher average number of
workers per firm.10 In a later study using a longer longitudinal approach
involving more years of data, Ruser (1991) obtained additional results that were consistent with those of his earlier study. In both studies, Ruser used BLS industry data for most of his variables, including average industry injury rates and average industry firm size (measured by the number of
employees per firm).11 Chelius and Smith (1983) did not find evidence
supporting the “ER hypothesis” but their study was confined to a smaller number of manufacturing classifications.
In a similar line of research, Butler and Worrall (1988) and Worrall and Butler (1988) produced findings consistent with Ruser’s using aggregate permanent partial injuries and temporary total injuries (as reported to the South Carolina Industrial Commission) as their outcome measures and dependent variables. Their sample comprised industry-level information for 15 industries over the time period 1940–1971. They also measured firm
size by the average number of employees per establishment.12 However,
they could not distinguish between large firms that were self-insured and large firms that purchased commercial insurance.
In the second vein of research, Danzon and Harrington (2001) exam-ined the relationship between regulatory suppression of worker’s compen-sation rates and loss costs and found that rate suppression, measured by the lagged residual-market share of insured payroll, increased loss growth. Although not directly related to the effect of experience rating, Danzon and Harrington’s study does suggest that there may be a strong empirical relationship between injury rates/WC claims and WC pricing. However,
because they focused on loss costs rather than injury rates per se, it is not
possible to infer whether the effect they found acts through safety or other elements of loss control or both. Barkume and Ruser (2001) assessed the effects of deregulation of WC insurance on prices and injury rates in the U.S. They concluded that the relaxation of price regulation led to reductions in both premiums and injury rates. The related inference from this study is that allowing insurers to charge rates that more closely reflect employers’ risk of losses will encourage them to improve safety and safety outcomes. Thomason, Schmidle, and Burton (2001) performed an extensive study of how alternative insurance arrangements for WC in the United States affected various system outcomes, including injury rates. They found that injury rates were higher in exclusive-state-fund jurisdictions than in states that permit private insurers to underwrite WC insurance policies. The implication is that competition among private insurers (in states without exclusive funds) encourages better risk-based rating, with beneficial effects on worker injuries and WC claims. Their findings also indicated that injury rates in jurisdictions with competitive fund states were lower than injury rates in states that had only private WC insurers. For Thomason et al., this raised some questions as to the true relationships between WC delivery mechanisms, pricing, and injury rates.
Kralj (2000) and Wright and Marsden (2002) review these and other studies of the effectiveness of experience rating in the United States, Canada, and other countries. Both of these literature reviews conclude that
the balance of the evidence is consistent with the proposition that experi-ence rating has a beneficial effect on reducing the frequency and severity of claims, but point out that the literature is not conclusive and that the studies to date have suffered from data and methodological shortcomings. Taken together, these studies and their reviews provide some support for the proposition that employers respond to price incentives but leave con-siderable room for further research that would examine the link between risk-based pricing and worker injuries/claims more directly. The analysis discussed in this paper seeks to take a significant step in that direction, and it is hoped that future development of this stream of research will make further progress along this path.
DATA AND METHODOLOGY
The Wisconsin Compensation Rating Bureau (WCRB) provided non-public data from its database for our analysis. The WCRB collects these data from all licensed WC insurers in the state. Firm-level data for a randomly selected pool of 3,000 employers that were nominally experience rated in policy year 2003 were provided (the identities of the employers were omitted from the data). For each employer-year, the data included the number of lost-time claims, aggregate payroll, the governing WC class code, and the experience rating modification factor at the beginning of the policy year. Data anomalies and/or low payroll volume prompted us to discard some of the observations, leaving 13,148 firm-year observations out of the potential 15,000 firm-years.
This information was supplemented by pricing information from the Wisconsin Experience Rating Plan Manual, which includes the Expected Loss Rate (ELR) factors for each of the 321 different governing class codes reflected in the employer data sample. With some exceptions for office clerical duties and other common low-risk jobs, the governing class code is based on the primary business or type of operations of the employer within the state, not the different occupations or operations within the governing classification. Even within a given class there may be many different types of processes and variations in the products produced, as well as differences in the mix of occupations. Hence, the classification does not directly measure the risk. For this reason, some practitioners view experience rating as an indirect way of at least partially correcting for the deficiencies of the class rate in charging for the actual risk levels of funda-mentally different types of operations within each class.
Beyond just random chance, there are many potential risk-related factors (e.g., the age and experience of its workers) affecting a given
employer’s claim counts from one period to the next. A very significant factor is the specific activities performed by the firm. The classification rating system captures only a limited degree of the risk differences across firms. Within most classes there is a large amount of heterogeneity of risk related to the nature of the work; e.g., some restaurants may have relatively dangerous deep-fat fryers and food slicers, while others use preprocessed food products. Because of the limitations to our data set, we could not model all potentially significant causal factors.
If the experience rating pricing system has a positive ex post safety
effect, there should be a negative relationship between changes to the
ERMFs for employers and their subsequent claim counts.13 The higher
price of insurance should provide incentives to increase workplace safety. However, the design of the pricing system may send imperfect signals to employers or employers may be “price inelastic” in their response to higher
WC premiums. Further, our data can reveal only the ex post effects of
experience rating on claim frequency; we are not in a position to discern
any ex ante effects of experience rating that may already be reflected in an
employer’s claims experience. Indeed, the actuarial presumption underly-ing the experience ratunderly-ing formula is that credible samples of an individual employer’s experience over three years is a fairly good predictor of the employer’s losses in the upcoming policy year. Hence, actuaries tend to
view the modification factor primarily as a means of producing ex post
equity among all employers in a class at the end of the policy year.14 This
does not mean that all actuaries disregard the ex post safety incentive effects
of experience rating, but on the basis of actuarial education/training materials, it does not appear that most actuaries view this as the primary objective (see Kallop, 1976).
DESCRIPTIVE STATISTICS
Descriptive statistics for our data sample are reported in Table 1. We can see from these statistics that sample firms averaged just under one lost-time claim per year, but the fact that the median claim count is 0 reveals that the majority of employers had no lost-time claims in a given year. Also, the statistics reveal considerable variation among firms in terms of lost-time claim counts, with a standard deviation of 3.64. The mean and median ERMF was just under 1.0, which is consistent with the objective of the system to effectively balance higher ERMFs with lower ERMFs. In other words, the intention is to adjust for firm risk differences within each classification but not to increase or decrease the total premiums collected
variables were 0, indicating that ERMF increases and decreases balanced out.
If the average firm’s WC costs are materially affected by the change in
its WC experience modification factor that, in turn, leads to a significant ex
post safety effect, then we would expect to see an inverse relationship
between changes in the modification factor and future claim counts. That is, if an employer’s ERMF increases, we would expect to see the number of claims in subsequent years to decrease if the associated increase in a firm’s premium prompts it to further improve safety with a beneficial effect on its accidents and injuries and ultimately its WC claims. Alternatively, if the full cost of worker injuries was not reflected or captured adequately by the experience modification system, or if employers were not sensitive to the price signals created by higher experience modifications, or if employ-ers have already optimized safety expenditures (and their results), then the statistical association between changes in the ERMF and the subsequent number of claims would diminish and potentially disappear.
However, it is difficult to hold all things equal across firm sizes. We believe that the riskier types of firms (e.g., contractors) tend to be smaller, which suggests that there will be an inverse relationship between firm size and claim count. Using the WCRB data, we segregated the observations into ten groups of roughly 1,300 observations, each based on payroll size. For each of the groups, we then took simple statistical measures of the number of lost-time claims, the number of claims per $100,000 of payroll, and the average ERMF. Table 2 below shows the summary data for each of the ten size groups.
Payroll was the only measure of “firm size” provided in our data set. At the same time, we believe payroll is a reasonably good measure of the relative size or stake of an employer in reducing its WC claim costs, for several reasons. One is that payroll is used in WC as the principal measure of a firm’s exposure to claim costs. Second, we would expect that firms with
Table 1. Descriptive Statistics for Data Sample
Claim count lnPAYROLL ELR ERMF dERMF dERMF2 Year2002 Year2001 INTRA
Mean 0.97 13.12 1.88 0.94 0.00 0.00 0.33 0.31 0.75
Median 0.00 13.03 1.47 0.86 0.00 0.00 0.00 0.00 1.00
Min. 0.00 9.23 0.04 0.43 –1.03 –1.03 0.00 0.00 0.00
Max. 98.00 20.18 14.94 3.47 1.56 1.09 1.00 1.00 1.00
larger payrolls would tend to face higher potential claim costs because of the greater amount of income benefits that their injured workers would be eligible for. Third, firms with larger payrolls may tend to have greater resources to invest in safety measures and would have more to gain from such investments. We note that the previous studies we have discussed have tended to use the average number of workers per firm or establish-ment by industry as their measure of firm size, but this is consistent with the different data sources they used and the industry-level approach of their analysis. Ultimately, the measure of firm size used is dependent on the data available and the basic approach of the analysis—i.e., industry-level or firm-industry-level. The firm size measures are not is necessarily ideal for their respective purposes, but they are reasonable proxies given the data
available.16
Of course, a firm’s payroll will be a function of the number of employ-ees, the actual wage rates or salaries they are paid, and the number of hours they work (for workers paid on an hourly basis). Hence, our firm size measure will be affected by all three factors. While some might wonder if it would be desirable to control for wage effects on payroll, it was not feasible to do this with our data set and not essential according to our
rationale for using payroll as a firm size measure.17 In future research, if
the data were available, it might be interesting to analyze how these different factors contribute to firm economies of scale in reducing worker injuries and claims.
Table 2 reveals that the average number of claims per firm increases with payroll size, which is consistent with our expectations. Prob(Claims=0) is the percentage of firms in the sample group category that have 0 claims; Prob(Claims>0) is the percentage of firms with one or more claims. Since total payrolls should increase with the number of workers, their wage levels, and their potential income benefits, one would expect that the average number of claims per firm would be higher for the firms with larger payrolls. However, when we compute an average claim rate based number of claims per $100,000 of payroll (also shown in Table 2), the claims rate actually declines with payroll size. Part of that decline may be due to economies of scale in safety expenditures or the other factors previously discussed; e.g., a firm with a larger payroll may have lower claim frequency because it has a full-time safety department. Some of the decline may also be attributable to differences in the inherent risk of job sites or working environments in large-payroll firms versus small-payroll firms. We note that the average ELR, a measure of expected claims, declines with firm payroll size.
Further, as we found with descriptive statistics for all sample firms, the average experience rating modification factor is relatively stable across
firm sizes as measured by payroll. That is, given these data, we detect no payroll size–related anomalies in the assignment of the ERMFs. We believe, at least in part, that this is the result of a conscious effort by actuaries to
stabilize the modification factors against payroll size–related volatility.18
However, because the ELR factor, which determines the base rate that the modification factor is applied to, is higher for the smaller firms, the relative impact of the modification factor might be greater for the smaller firms.
REGRESSION ANALYSIS RESULTS
We perform a regression analysis with our data to better discern the effects of experience rating modifications and other factors that may affect employers’ WC claims experience that we can glean from our data. Our regression model seeks to estimate the effects of several variables on employers’ WC claims. Our dependent variable is the lost-time claim count (i.e., the number of lost-time claims) for each employer in the sample in each year of the study. We postulate that the number of claims should be a function of firm payroll (exposure risk), the type of firm operations and typical hazards that the employees are exposed to as reflected by the class
Table 2. Descriptive Data Across Payroll Size Groups
Group Payroll range
No. of obs. Claims Average # of claims Prob (Claims = 0) Prob (Claims > 0) Claims per 100K of payroll Avg ERMF factor Avg ELR factor 1 10K–74K 1,315 63 0.05 96% 4% 0.111 0.951 2.43 2 74K–130K 1,315 170 0.13 88% 12% 0.130 0.926 2.71 3 130K–200K 1,315 228 0.17 86% 14% 0.105 0.929 2.36 4 200K–290K 1,315 313 0.24 82% 18% 0.098 0.918 2.04 5 290K–416K 1,315 439 0.33 76% 24% 0.096 0.957 1.82 6 416K–605K 1,315 548 0.42 71% 29% 0.083 0.929 1.65 7 605K–945K 1,315 792 0.60 63% 37% 0.079 0.948 1.46 8 945K–1,557K 1,315 1,329 1.01 48% 52% 0.083 0.945 1.55 9 1,557K–3,146K 1,315 1,921 1.46 42% 58% 0.067 0.956 1.30 10 3,146K–578,840K 1,313 7,142 5.44 21% 79% 0.052 0.948 0.95 ALL 13,148 12,945 0.98 67% 33% 0.091 0.941 1.83
ELR (average risk), and the relative historical claims experience of the employer reflected by its ERMF (relative risk).
The average operations-based risk is proxied by the ELR published by the National Council on Compensation Insurance (NCCI) for the govern-ing class code of each employer. The governgovern-ing class code is not an exact measure of the average loss exposure because it reflects the type of business rather than the actual job-related activities of individual employees, but it should provide a reasonable approximation of average risk for the firm.
The ERMF for each employer provides a measure of relative risk, taking into account the types of employment-related risk already present
in the employers’ business operations.19 Employers with ERMFs above 1.0
would be presumed to have higher-than-average loss experience after controlling for the type of business. That is, a finish carpentry business would be expected to have a higher average WC claim rate than an accounting firm because carpentry operations pose more hazards to work-ers, and that would be reflected in the ELRs (average risk) for the two types of firms. However, the ERMF should be a reasonably acceptable if imper-fect measure of how risky a specific carpentry firm is relative to other carpentry firms (e.g., carpentry firms that differ in terms of the height of the structures they tend to work on, as well as their safety measures). Therefore, all three measures of risk (exposure base, average claim experi-ence, and relative claim experience) are included in the model to account for the “normal” level of claims, as well as accounting for the effect of firm-specific experience-related adjustments in the price of insurance.
ERMFs change from year to year as the historical claims experience of the employer is updated in the ERMF calculation—the calculation tends to use the insurer’s claims over the last three years and the calculation drops the oldest year and includes the most recent year as the ERMF is recalcu-lated from one year to the next. As an employer’s successful work safety efforts (or other factors) lead to lower claim costs, this improved safety record is recognized in the rating formula and the price of WC insurance will decline, albeit with a lag. We would expect to see that increases in the ERMF over a period of time would lead to lower claims counts in the future if a significant proportion of employers are induced and able to reduce worker injuries, which would then result in a lower number of lost-time claims. We therefore include the change in the ERMF over the past year and over the prior past year to measure the relationship between increases or decreases of the ERMF in prior years and the number of claims in the current year.
In addition to these insurance-related factors, we also include indicator variables to account for any differences between companies with loss exposures only in Wisconsin and those with interstate loss exposures and
to account for general statewide trends in claims from 2001 to 2003. Note that by using lagged values of the ERMFs, we lose two data years (1999 and 2000)—hence, we can only measure the effects on claim counts for the years 2001–2003.
The regression model is:
Claim Counti,t = b0 + b1*lnPAYROLLi,t + b2*ELRi,t + b3*ERMFi,t +
b4*dERMFi,t–1t + b5*dERMF2i,t–2t–1 + b6*YEAR2002 + b7*YEAR2001 +
b8*INTRAi,t + error term
where:
Claim Counti,t = the number of claims for employer i in year t.
lnPAYROLLi,t = the natural log of total covered payroll (in $) for
employer i in year t.
ELRi,t = the Expected Loss Rate for employer i’s primary classification
in year t.
ERMFi,t = the experience modification factor for employer i in year t.
dERMFi,t–1t = the change in the experience modification factor from the
prior year to the current year.
dERMF2i,t–2t–1 = the change in the experience modification factor from
the second prior year to the prior year. YEAR2002 = 1 for year 2002, 0 otherwise. YEAR2001 = 1 for year 2001, 0 otherwise.
INTRAi,t = 1 if employer i is classified as having intrastate loss
expo-sures only in year t, 0 otherwise.
Because we are working with unbalanced panel data with claim counts as the dependent variable, we use a Poisson regression model with random effects to estimate parameters for each of the explanatory variables using
the PROC GENMOD procedure in SAS.20 The random effects model was
chosen to account for unobserved variables specific to each firm that are omitted from the basic model. There is some difference of opinion as to whether a fixed effects model or a random effects model is more appropri-ate for panel data. The random effects model assumes that the unobserved explanatory variables are uncorrelated with the observed variables. The random effects model, in effect, assumes that the claim experience across firms is similar and that these firms are sampled randomly from the
population of firms in the state. Therefore, we can draw inferences about the population from these sample results.
The fixed effects model, on the other hand, assumes that the claim experience is independent for each firm and makes no assumption about the relationship between the unobserved variables and the observed vari-ables. While the assumptions about random effects hold for this sample, an argument can be made that a fixed effects model may be more appro-priate. However, fixed effects models are not appropriate when there are a significant number of different firms with relatively few yearly observa-tions (Allison, 2005). A grand total of 2,568 different firms included in the 7,012 observations we are working with: 234 firms with only one year of data, 224 firms with only two years of data, and 2,110 firms with three years
of data. Hence, the fixed effects model is not feasible for this analysis.21
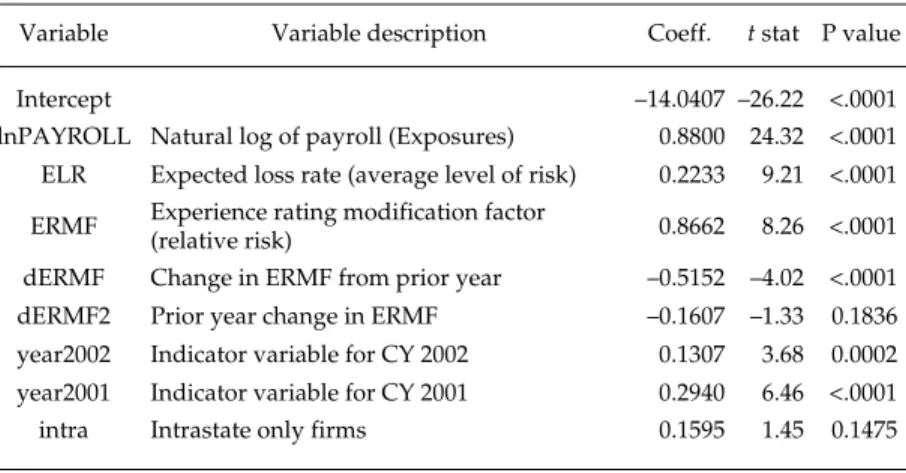
Our regression results are presented in Table 3. As expected, the parameter estimates for lnPAYROLL, ELR, and ERMF show highly signif-icant positive relationships with claim counts. The parameter estimate for dERMF, the change in the modification factor from the prior year to the current year, is –0.5152 and is highly statistically significant. The parameter estimate for dERMF2 is not statistically significant. However, in all of the alternative models that we tested, this parameter estimate was still
nega-tive and was usually statistically significant.22
The Wisconsin-only indicator variable (INTRA) is not statistically significant. We do note that there is a systematic nonlinear relationship between payroll size and INTRA. The proportion of intrastate-only firms
Table 3. Poisson Regression Results: Dependent Variable =
Number of Lost-Time Claims in Year t
Variable Variable description Coeff. t stat P value
b0 Intercept –14.0407 –26.22 <.0001
b1 lnPAYROLL Natural log of payroll (Exposures) 0.8800 24.32 <.0001
b2 ELR Expected loss rate (average level of risk) 0.2233 9.21 <.0001
b3 ERMF Experience rating modification factor
(relative risk) 0.8662 8.26 <.0001
b4 dERMF Change in ERMF from prior year –0.5152 –4.02 <.0001
b5 dERMF2 Prior year change in ERMF –0.1607 –1.33 0.1836
b6 year2002 Indicator variable for CY 2002 0.1307 3.68 0.0002
b7 year2001 Indicator variable for CY 2001 0.2940 6.46 <.0001
is lower at either end of the distribution of payroll, meaning that the smaller-payroll firms and the larger-payroll firms are more likely to be interstate than intrastate. This suggests that there is some degree of multi-collinearity between our payroll variable and our intrastate-only dummy variable, and that might account for the lack of statistical significance for this parameter estimate.
The indicator variables for 2002 and 2001 show that there were some changes from period to period in the average number of claims, reflecting changes in the overall claim experience in Wisconsin during this time-frame. The average number of lost-time claims per employer decreased from 2001 to 2002 and from 2002 to 2003. Note, as 2003 is the omitted year, positive coefficients for the 2001 and 2002 indicator variables are consistent with a downward trend in the average number of lost-time claims. These results provide support for the hypothesis that changes in ERMFs have a negative and statistically significant relationship with the number of lost-time claims reported in subsequent years. In other words, increases (decreases) in the ERMF are associated with decreases (increases) in the number of lost-time claims that an employer tends to incur in a subsequent year. These results provide further support for the hypothesis that experi-ence rating contributes to decreasing workplace accidents and WC claims. Our sample, which was limited to Wisconsin employers, showed roughly 42 percent with positive changes in ERMFs, 42 percent with
negative changes, and 16 percent with no change from year t–1 to year t.
An examination of the distribution of the changes in the ERMFs indicates that the change in the factor is approximately normally distributed and well behaved in a statistical sense, but that may be a function of the actuarial construction of the ERMFs. The factors are meant to be relatively stable from year to year and relatively insensitive to large spikes (falls) in employers’ historical claims, and that construction will tend to mitigate the effect of historical claims experience on the ERMF. We also note that the ERMF is based on all claims, not just lost-time claims, and by design is more sensitive to claims frequency than to claims severity (see technical appendix).
Our theory and results do raise a question about the meaning of the association between decreases in ERMFs and a higher number of subse-quent claims. Does it seem reasonable that an employer would reduce safety or ease loss prevention efforts if its ERMF decreases? Clearly, some safety measures would be expected to have long-term effects that would diminish slowly if at all—e.g., safety guards on equipment, other improve-ments in facilities, and safety training programs. However, there are mea-sures that might have a short-term or immediate effect and these efforts could be eliminated or diminished more quickly. Such measures include
the speed of production, overtime and worker fatigue, training for new employees, and employers’ efforts to challenge questionable claims. Hence, some of the predicted effect of ERMF decreases could still occur. Indeed, while we find that ERMF decreases are associated with a subse-quent increase in claims, the magnitude of this association is not as great as the relationship between ERMF increases and fewer claims.
CONCLUSIONS AND FUTURE RESEARCH
Our analysis of individual firms’ WC experience rating provides further empirical support for the theory that it motivates employers to improve worker safety and lower the number of their WC claims. More
specifically, our analysis yields supporting evidence of an ex post pricing
effect—increases in ERMFs lead to decreases in the number of lost-time claims in subsequent years. We also found that employer size, as measured by payroll, is positively related to the number of claims, but the relationship does not appear to be linear. Claims increase as employer size increases, but at a decreasing rate, and that relationship is consistent with economies of scale associated with employer investments in safety.
While our results are promising and consistent with economic predic-tions regarding risk-based pricing and experience rating, it is important to raise several qualifications. First, our data allow us to observe employers’ ERMFs and subsequent reported claims. From these data we infer a rela-tionship between experience rating, employer safety efforts, worker inju-ries, and WC claims. However, we cannot observe actual safety efforts or the incidence of worker injuries—hence, we can only infer that the reduc-tion in claims is due to conscious and successful efforts to reduce accidents. That reduction may be through enhanced safety programs, additional spending on safety, increased attention to safety, efforts to discourage workers from filing claims, or other measures. Given the limited scope of the data, one cannot infer with certainty that there is a causal relationship between changes in the pricing of insurance coverage and the changes in the subsequent rates of worker injuries, although a strong theoretical underpinning would support that theory. Our results do contribute signif-icant additional empirical evidence supporting the view that such a causal relationship exists.
The results here are also limited to Wisconsin and we cannot assume that the results for other states would be exactly the same. We would expect that the signs of the key parameter estimates would not change, although the magnitude of the parameter estimates would reflect state-specific differences. While there are modest differences among the states with
respect to how ERMFs are calculated, there may be a number of other factors that vary more substantially and also influence the relationship between ERMFs and subsequent claims experience. Additionally, the time period in our research was a period of generally declining workers’ com-pensation claims and our results are limited to the period 2001 to 2003. In further research, we hope to use data from other states and for more or longer time periods (if we can obtain such data) to test the robustness of our model results over time as well as to assess the effects of state-specific factors.
Our data also did not allow us to discern the ex ante effects of
experi-ence rating. On the one hand, this means that risk-based pricing and experience rating could have additional desirable effects on safety, injuries, and claims beyond that indicated by our results. On the other hand, if we
raise the possibility that experience rating has undesirable ex post effects
(e.g., employers discouraging workers from filing legitimate claims), we
must acknowledge that it might also have such undesirable effects ex ante.
NOTES
1 See Klein and Krohm (2006) for a comprehensive discussion and literature review of how
workers’ compensation is funded in various countries and how they approach experience rating and other aspects of the pricing of workers’ compensation insurance.
2 The experience rating formula limits the extent to which medical-only claims affect an
employer’s ERMF more than the limits placed on the impact of lost-time claims.
3 Gillam (1992) cites the prevailing actuarial opinion that firm equity is the primary goal of
experience rating in workers’ compensation.
4 NCCI (2006) states: “The main objective of the Plan is to encourage employers to reduce the
frequency and severity of work-related injuries through economic incentives.”
5 We are not suggesting that every employer reacts to higher ERMFs in this way, as many
factors will affect an employer’s motives and ability to improve safety and reduce injuries. What we are suggesting is that our analysis contributes support to the belief that experience rating prompts a significant number of employers to improve safety and reduce injuries and claims.
6 The use of experience rating and its rationale is similar although technically not exactly the
same as the use of merit rating in auto insurance. In auto insurance, auto owners/drivers with previous driving violations and at-fault accidents above a certain minimum are subject to a surcharge in the premiums they are charged.
7 NCCI (2004) provides a detailed explanation of the experience rating system and formula
used in the United States. A more detailed explanation is provided in the technical appendix.
8 Ruser (1985) presents a model of an employer’s decision on safety expenditures in workers’
compensation that is consistent with this basic intuition. Harrington and Niehaus (2003) also contains a chapter on loss control and discusses how firms might optimize their expenditures on safety and preventing/mitigating losses.
9 See for, example, Ruser (1985), Ruser (1991), Worrall and Butler (1988), and Harrington and
10 Experience rating is more heavily weighted in the pricing of insurance for larger employers
because their historical claims experience is believed to be more statistically credible than the experience of smaller firms.
11 See, for example, Chelius (1974, 1982), Worrall and Appel (1982), Butler (1983), Butler and
Worrall (1988), Ruser (1985), Moore and Viscusi (1990), and Ruser (1991).
12 They did not attempt to control for wage rate levels within each industry although they did
use a statewide “quality-adjusted measure of human capital” measure as well as the statewide annual average wage for male production employees as explanatory variables.
13 This statement needs to be qualified. Experience rating could increase safety and reduce
workplace accidents, but this may not be reflected in fewer workers’ compensation claims, for the reasons we discussed above.
14 The National Council on Compensation Insurance (NCCI) has strong evidence that loss
ratios in every employer classification are much more uniform after the application of experience rating than they would be without the modification adjustment.
15 This is also what the NCCI finds in national data. The September 26, 2006 Actuarial
Com-mittee Update states: “Staff presented results of the latest balance test indicating that off-balance factors are remaining reasonably close to unity. Off-off-balance factors measure the total impact of the Experience Rating Plan on aggregate premium.” For a graphic display of this tendency to unity in loss ratios after the application of experience rating, see NCCI, 2006, p. 2.
16 Note that the statistical databases maintained by insurers and statistical/advisory
organi-zations (e.g., the National Council on Compensation Insurance, state statistical/rating orga-nization) generally maintain information on employers’ payroll but not on the number of their employees. The major reason for this is that payroll is the principal variable used to measure employers’ exposure to risk and the basis for pricing. Admittedly, payroll is affected by wage rates, but since income replacement is one of the principal components of workers’ compen-sation benefits, insurers and advisory organizations have continued to defend the use of payroll for measuring exposure. Presumably, if insurers believed that payroll was significant-ly biased or inaccurate as an exposure measure, they would employ alternative exposure variables to gain an edge on their competitors.
17 The classifications used to collect data on industry wage levels are different from WC
classifications. Further, average industry wage rates would not reveal firm-specific differences in the wages each pays.
18 As explained in the technical appendix, the calculation of ERMFs involves a number of
adjustments that are intended to “smooth” changes in the ERMFs, and the historical experi-ence of small employers is given less weight because of its lower statistical credibility than the weight given to the historical experience of larger firms.
19 We should note that insurers may use other devices to reflect differences in firm risk within
a given classification. These devices include schedule rating (credits or debits) to reflect qual-itative characteristics—e.g., safety training for workers—and underwriting selection that can result in higher-risk employers being placed with insurers with higher rates.
20 We tested a number of alternative models and estimation methods but the results were very
similar across models and methods. Ruser (1991) found the same thing in his test of alternative models and methods to estimate the effects of various industry factors on industry average injury rates.
21 Although we did experiment with a fixed effects version of the model, the result was that the
variables on the right-hand side showed inappropriate signs on the parameters and no sta-tistical power. Essentially, the fixed effects approach produces dummy variables for each of the firms. Since the payroll variable, the ELR variable, and the experience rating factor for each firm differ from firm to firm and from period to period, the fixed effects simply replaced all of these explanatory variables in the model with a firm-specific dummy variable.
22 We evaluated a number of alternative models, including ordinary least squares (OLS) with
transformed variables, linear and nonlinear Poisson models, and linear and nonlinear nega-tive binomial models. When we fit these alternanega-tive models, the results of which are not
reported in this paper, we did observe the same negative relationship between the number of lost-time claims and the changes in the ERMFs in every model we tested. Hence, we believe our results are fairly robust with respect to different model types and estimation methods.
REFERENCES
Allison, Paul D. (2005) Fixed Effects Regression Methods for Longitudinal Data Using SAS. Cary, NC: SAS Institute, Inc.
Barkume, Anthony J. and John W. Ruser (2001) “Deregulating Property-Casualty Insurance: The Case of Workers’ Compensation,” Journal of Law and Economics, 44, 37.
Butler, Richard J. (1983) “Wage and Injury Rate Response to Shifting Levels of Workers’ Compensation,” in John D. Worrall, ed., Safety and the Work Force, Ithaca, NY: ILR.
Butler, Richard J. and John D. Worrall (1988) “Labor Market Theory and the Distribution of Workers’ Compensation Losses,” in Philip S. Borba and David Appel, eds., Workers' Compensation Insurance Pricing. Boston, MA: Kluwer Academic.
Chelius, James R. (1974) “The Control of Industrial Accidents: Economic Theory and Empirical Evidence,” Law and Contemporary Problems 38, 700–729.
Chelius, James R. (1982) “The Influence of Workers’ Compensation on Safety Incentives,” Industrial and Labor Relations Review 35, 235–242.
Chelius, James R. and Robert S. Smith (1983) “Experience Rating and Injury Prevention,” in John D. Worrall, ed., Safety and the Work Force, Ithaca, NY: ILR. Danzon, Patricia M. and Scott E. Harrington (2001) “Workers’ Compensation Rate
Regulation: How Price Controls Increase Costs,” Journal of Law and Economics, 44, 1.
Gillam, William R. (1992) “Worker’s Compensation Experience Rating: What Every Actuary Should Know,” Proceedings, Casualty Actuarial Society, 79, 215–239. Harrington, Scott E. and Gregory R. Niehaus (1998) Risk Management and Insurance,
1st ed. Boston, MA: McGraw-Hill/Irwin.
Harrington, Scott E. and Gregory R. Niehaus (2003) Risk Management and Insurance, 2nd ed. Boston, MA: McGraw-Hill/Irwin.
Klein, Robert W. and Gregory Krohm (2006) “Alternative Approaches to Funding Workers’ Compensation,” International Social Security Review, 59, 4:3.
Kallop, Roy H. (1976) “A Current Look at Workers’ Compensation Ratemaking,” In Proceedings of the Casualty Actuarial Society, 62, 62–176. Boston: Sperry Rand. Kralj, Boris (2000) “Occupational Health and Safety: Effectiveness of Economic and
Regulatory Mechanisms,” in Workers’ Compensation: Foundations for Reform. Toronto: University of Toronto Press.
Moore, Michael J., and W. Kip Viscusi (1990) Compensation Mechanisms for Job Risks: Wages, Workers’ Compensation, and Product Liability. Princeton, NJ: Princeton University Press.
NCCI (National Council on Compensation Insurance) (2000) Basic Manual for Workers Compensation and Employers Liability Insurance.Boca Raton, FL.
NCCI (National Council on Compensation Insurance) (2002) Experience Rating Plan Manual for Workers Compensation and Employers Liability Insurance.Boca Raton, FL.
NCCI (National Council on Compensation Insurance) (2004) The ABC’s of Experience Rating.Boca Raton, FL.
NCCI (National Council on Compensation Insurance) (2006) Experience Rating Update, “Value of the Experience Rating Plan,” July. Boca Raton, FL.
Ruser, John W. (1985) “Workers’ Compensation Insurance, Experience-Rating and Occupational Injuries,” Rand Journal of Economics, 16, 487.
Ruser, John W. (1991) “Workers’ Compensation and Occupational Injuries and Illnesses,” Journal of Labor Economics, 9, 325–350.
Thomason, Terry, Timothy P. Schmidle, and John F. Burton, Jr. (2001) Workers’ Compensation: Benefits, Costs and Safety Under Alternative Insurance Arrangements. Kalamazoo, MI: W.E. Upjohn Institute for Employment Research.
Worrall, John D. and David Appel (1982) “The Wage Replacement Rate and Benefit Utilization,” Journal of Risk and Insurance, 49, 361–371.
Worrall, John D. and Richard J. Butler (1988) “Experience Rating Matters,” in Philip S. Borba and David Appel, eds., Workers' Compensation Insurance Pricing: Current Programs and Proposed Reforms. Boston, MA: Kluwer Academic.
Wright, Michael and Sara Marsden (2002) “Changing Business—Would Bearing the True Cost of Poor Health and Safety Performance Make a Difference?” Norwich, England: Health and Safety Executive, Contract Research Report 436/ 2002.
TECHNICAL APPENDIX
Detailed Description of Experience Rating
In experience rating, the actual payroll and loss data of an individual employer are analyzed over a period of time. Typically, in the U.S., the latest available three years of audited data for a specific employer are compared to the data for similarly grouped firms to calculate the employer’s experi-ence modification. Because of the need to verify/audit the data, there is a lag of one year before a policy year enters the experience base—e.g., a policy ending June 30, 2005 will not contribute to the experience base until the policy beginning July 1, 2007. In order to perform this calculation, the National Council on Compensation Insurance (NCCI) collects and main-tains premium and loss data for each employer. The NCCI calculates an experience rating modification factor for each employer that must be used by every insurer in pricing a policy for a given employer that qualifies by virtue of its premium size.
In practice, some states allow insurers to apply discretionary credits and debits to their rates—i.e., “schedule rating.” These credits can be as much as 25 percent up or down from the standard class rate. By means of these adjustments an underwriter can effectively increase or decrease the net rate after the application of the experience modification. Because of issues related to statistical credibility, experience rating is not applied to small firms (the current rule is more than $5,700 in premium per year). Experience rating plans include minimum premium standards that deter-mine whether a particular firm is large enough (as measured by their manual premium) to qualify for experience rating.
The experience rating plan gives greater weight to accident frequency than accident severity. Frequency refers to the number of claims per expo-sure unit and severity refers to the amount of a specific claim or the average amount of a number of claims. The greater weight attached to frequency is based on the premise that the cost (severity) of a given accident is more subject to random variation while an employer’s relative number of acci-dents more closely reflects its probability of incurring a loss. This is a premise that arises from statistical principles, experience, and actuarial research. At the same time, the fact that an employer has had a small number of high-cost claims is still relevant in terms of predicting its future claim costs. Hence, the experience rating plan considers both accident frequency and severity, albeit to different degrees.
A split rating approach is used to account for the frequency and severity
of losses. For any specific claim, the amount of the loss up to $5,000 is
between $5,000 and a specified state accident limitation are termed excess
losses and the amount is used to reflect accident severity. Any loss amount
above the state accident limitation—set at $100,000 in many states—is
treated as a nonratable loss and is excluded entirely from experience rating
calculations. Rating organizations will recommend a state accident limita-tion based on their analysis, but insurance regulators will review this analysis and ultimately determine the limitation that will be used. In approving or setting a limitation, regulators consider how different levels affect insureds and the level that will tend to produce the most accurate premium calculation, balanced by the desire to maintain a certain amount of pricing stability. A higher limitation will effectively cause premium calculations to be more sensitive or responsive to historical claim severity, but it can also result in larger swings in the premium calculated for a particular insured. This is one of several aspects of experience-based pricing where rating organizations and regulators must use both analysis and judgment in balancing the responsiveness with the stability of a pricing system.
Hence, for a $1,500,000 claim and a state accident limitation of $100,000, the designation of the loss amount components would be as follows:
Primary loss $5,000
Excess loss $95,000
Ratable loss $100,000
Nonratable loss $1,100,000
Several other provisions of experience rating should be noted. Only 30 percent of the primary and excess portions of a loss from a medical-only claim are used in the calculation of a modification factor. To be eligible for experience rating, an employer’s manual premium for the most recent 24 months of its experience period must exceed a specified limit. Below this limit, the experience of an employer is not considered to be sufficiently credible to use as a basis for experience rating. The actual experience period most commonly used is the most recent 36 months, ending one year prior to the effective date of the modification. Modifications are revised annually, dropping the oldest year of experience and adding the newest year of experience available. As with other elements of pricing methodologies, the choice of the length of the experience period is a matter of experience, analysis, and judgment. Some jurisdictions might choose longer experience periods because of concerns about the greater volatility associated with shorter periods. On the other hand, longer experience periods will decrease the responsiveness of pricing to changes in an insured’s claims experience and the associated risk indication. For example, if an insured has made
substantial changes in its risk profile, it will take longer for the effects of these changes to be reflected in the price it pays if a longer experience period is employed.
A simplified example of the calculation of an experience rating modification factor for a hypothetical employer—the Acme Company—is provided below.
In this example, the Acme Company has actual primary losses of $50,000 and actual excess losses of $200,000 as calculated using the rules described above for its relevant experience period. Expected losses for Acme’s business classification are calculated by applying the classifica-tion’s Expected Loss Rate (ELR) to Acme’s covered payroll for the experi-ence period. A Discount Ratio or “D-Ratio” is used to divide the expected losses into primary and excess losses. In this example, the D-ratio is 0.18— i.e., 18 percent of the expected losses are determined to be primary and the remainder are determined to be excess.
Credibility weighting and smoothing are applied to the excess portion of Acme’s actual and expected losses to further temper the effects of random fluctuations in Acme’s experience. A Weighting (W) Factor of 0.32
Experience Rating Components
Actual primary losses $50,000
Actual excess losses $200,000
Expected primary losses $80,000
Expected excess losses $320,000
W factor 0.35
Tabular ballast value $65,000
Stabilizing value $273,000
Weighted (ratable) actual excess $70,000
Weighted (ratable) expected excess $112,000
Experience Modification Factor Calculation
Primary Stabilizing Ratable Experience
loss value excess Totals modification
Actual $50,000 $273,000 $70,000 $393,000
is used to determine the portion of Acme’s actual excess losses that will be used in its experience modification, using the formula shown below.
Ratable (Weighted) Actual Excess Losses = W × Actual Excess Losses
The same calculation is performed for expected excess losses to paral-lel the computation for actual losses. In Georgia, for example, the W Factor can range from .04 to .63 and increases with the size of the employer, under the premise that the statistical credibility of an employer’s experience increases with its size.
A Stabilizing Value is calculated to substitute or compensate for losses removed by applying the weighting factor. The Stabilizing Value is calcu-lated using the following formula:
Stabilizing Value = Expected Excess Losses x (1 – W) + Tabular Ballast Value The Tabular Ballast Value is intended to prevent the experience mod-ification from shifting too far or below unity and increases as expected losses increase. In this example, the Tabular Ballast Value is $65,000.
To complete the experience modification calculation, the primary losses, stabilizing value, and ratable excess losses are summed to compute total actual losses and expected losses. Total actual losses are divided by total expected losses to calculate the experience modification factor. In this example, Acme’s actual losses are less than its expected losses, resulting in an experience modification factor of 0.85. This factor would be applied to Acme’s “manual premium” and effectively decrease its experience-adjusted premium, reflecting its “better than average” experience.