INSTITUTO TECNOLÓGICO AUTÓNOMO DE MÉXICO
_________________________________________________________________________________________________
CENTRO DE INVESTIGACIÓN ECONÓMICA
Working Papers Series
___________________________________________________________________________________________
Av. Camino a Santa Teresa 930 México D.F 10700
MEXICO
Borrowing on the Wrong Credit
Card:
Evidence from Mexico
Alejandro Ponce
World Justice Project
Enrique Seira
Centro de Investigación Económica, ITAM
Guillermo Zamarripa
FUNDEF, Mexico
July 2014
Working Paper 14-06
Borrowing on the Wrong Credit Card:
Evidence from Mexico
∗†Alejandro Ponce‡
World Justice Project
Enrique Seira§
ITAM, Mexico
Guillermo Zamarripa FUNDEF, Mexico
Abstract
We study how consumers allocate debt across credit cards they already hold using new data on credit card activity for a representative sample of consumers with two homogeneous cards in Mexico. We find that relative prices are a very weak predictor of the allocation of debt, purchases, and payments. On average, consumers pay 31% above their minimum financing cost. Evidence on cross-card debt elasticities with respect to interest rates and credit limits show no substitution in the price margin. Our findings offer evidence against the cost-minimizing hypothesis, provide support to behavioral explanations, and have important implications for pricing and competition.
KEYWORDS: Credit cards; household finance; consumer behavior; Mex-ico.
JEL Classifications: D12 , D14, D40, G02, G20, G28
∗We are grateful to Jon Levin and Liran Einav, for numerous discussions and comments. We
thank Susan Athey, Tim Bresnahan, Giacomo De Giorgi, Simeon Djankov, Josh Frank, Caro-line Hoxby, Soohyung Lee, Florencio Lopez-de-Silanes, Brigitte Madrian, Ulrike Malmendier, Pedro Miranda, Sriniketh Nagavarapu, Roger Noll, Adriano Rampini, Felix Reichling, Radovan Vadovic, Joanne Yoong, Jon Zinman and participants at Stanford University IO, the World Bank Research Group, the Federal Reserve Bank of Boston, ITAM, and RAND Corporation for comments and suggestions. Ponce and Seira acknowledge the support of the Dissertation Grant of the Federal Reserve Bank of Boston’s Research Center on Behavioral Economics and Decision-Making. Ponce appreciates the support of the Kohlhagen Fellowship Fund at Stanford University and Mexico’s National Council for Science and Technology (CONACYT). All errors remain our own.
†A previous version of this paper circulated under the title “Do consumers borrow on their
cheapest credit card? Evidence from Mexico”
‡Corresponding author:E-mail:[email protected] §Corresponding author:E-mail:[email protected]
1
Introduction
For many individuals, debt-servicing is a major determinant of wealth accu-mulation. Accordingly, it seems reasonable to expect debtors to look for ways to save on interest charges, substitute expensive debt with less costly alternatives, and borrow at the lowest possible rate. In this paper, we document a prominent case in which this inference does not hold.
We study how consumers allocate their credit card debt in light of the interest rates of the cards they hold. According to the standard model, if information is readily accessible, switching costs are low, credit cards are homogeneous in all relevant respects, and consumers are not constrained by the contractual features of their cards (e.g. credit limits and minimum payments), individuals should min-imize financing costs and borrow on the credit card with the lowest interest rate. In this paper, we analyze the actual choices made by a large number of cardhold-ers in Mexico during the time period 2004-2005 and find evidence against this hypothesis. The choices we study, although simple, can have profound implica-tions for consumers’ finances, firms’ behavior, and market outcomes.
To shed light on debt allocation decisions, we constructed a novel administra-tive panel data set on credit card activity. The sample is representaadministra-tive of the population of individuals who possess two credit cards. The data set contains, for thousands of consumers, credit bureau reports as well as individual credit card records by the three largest banks, including information about, monthly statements, some demographic information, and a variety of credit card features. We focus on the allocations of consumers with two highly comparable credit cards -i.e. cards sharing the same benefits and rewards programs (points, traveler miles, shopping discounts, etc.). We do this with the aim of creating a setting that closely resembles the homogeneous product case found in textbook models, which allows us to look cleanly at unrealized arbitrage opportunities across very simi-lar financial instruments. In spite of these restrictions, the sample encompasses
substantial variation in the difference in interest rates across the cards held by
preferential rates granted to individuals opening a checking or savings account or from temporary reductions in the interest rate (or teaser rate offers) that banks send to existing clients, some the result of randomized experiments.
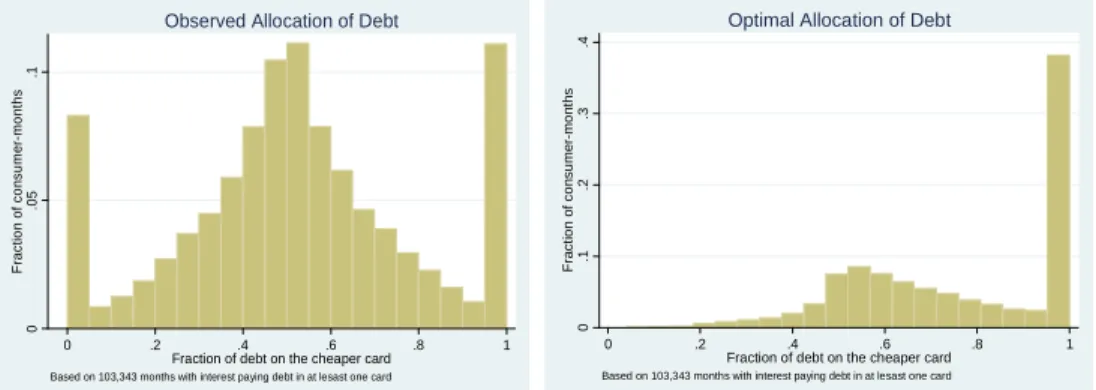
We find that debt revolvers with two comparable cards very often borrow on their high-interest card even though they could feasibly transfer these balances to cards with a lower interest rate. The leftmost panel of Figure 1 shows a histogram of the fraction of interest-paying debt allocated to the low-interest card. For comparison, the rightmost panel of Figure 1 presents the distribution that would arise if consumers allocated debt up to the credit limit on the cheaper card, and the rest on the more expensive card. The histograms look quite different. We find that the average consumer misallocates 21% of their total debt to high-interest
cards. On average, consumers leave on the table 683 pesos per year1, which implies
that they incur a 31% higher cost than the minimum to finance their existing debt. These results are quite persistent over time and do not change when we
look at the distribution of new debt in the form of payments and purchases. On
average, individuals misallocate 47% of their purchases and 50% of their total payments by making purchases with or making payments to the wrong credit card.
Given these findings, we investigate whether consumers substitute balances away from high-interest cards towards low-interest cards when one of their cards receives a teaser interest rate discount offer. We find that, in spite of the significant own-price elasticity estimates, -0.57 and -0.84 for offers lasting one and three months respectively, the cross-card debt-interest rate elasticities are statistically zero.
We consider a variety of explanations for the observed stylized facts. We argue that explanations based upon lack of accessible information, pecuniary switching costs, and differentiated cards are unlikely to rationalize our results. In contrast, theories departing from the standard rational choice model, such as limited at-tention to prices, anchoring, and mental accounting are consistent with all the
1The average Peso-Dollar exchange rate for December 2005 was 10.62. This rate was about
11.42 pesos per dollar in January 2005 and 10.54 in January 2006. Source: Banco de Mexico (http://www.banxico.org.mx/PortalesEspecializados/tiposCambio/indicadores.html)
documented facts. All in all, we believe that our findings offer enough evidence to reject the neoclassical hypothesis stressing that individuals minimize financing costs – all else equal – and provide empirical support to theories that point to limitations on consumers’ abilities to make optimal financial choices.
Overall, the results in this paper shed light on two main issues. First, by pre-senting field evidence that consumers forego arbitrage opportunities among the most frequently held financial instruments, our study contributes to the under-standing of consumers’ financial choices and speaks directly to the descriptive power of neoclassical and behavioral choice models. Our findings provide impor-tant insights into how credit card companies compete in this industry. We provide evidence consistent with the fact that banks’ pricing strategies are influenced by low substitution elasticities, and discuss the possibility that such demand pat-terns could explain the prevalence of consumers with multiple bank cards as well as the low levels of competition in the Mexican credit card market.
There are several papers closely related to ours. Benartzi and Thaler (2001), demonstrate that consumers use naive diversification strategies in making their saving-allocation decisions; Agarwal et al. (2005) provide evidence that consumers with multiple credit card offers fail to optimally choose the right contract; Choi et al. (2011), show that investors often choose asset allocations for one account without considering the asset allocations of their other accounts; Stango and Zin-man (2009), measure the total costs that consumers pay across all of their bank and credit card accounts in the U.S. and find that consumers make nontrivial mistakes; and Agarwal et al. (2009) find that most individuals borrowing from one payday lender have substantial credit card liquidity on the days they take out their more expensive payday loans. The paper most closely related to ours is Stango and Zinman (2011). Using a panel of credit card borrowers in the U.S., they find that consumers do seem to minimize financing costs when allocating their debt across cards, contrary to our results. Their sample, however, is from voluntary participants in an internet service and are more educated, have higher income than even the U.S. average, and are potentially more financially sophis-ticated.
Our paper also speaks to what has been labeled the ‘Credit Card Puzzle’ [Gross and Souleles (2002) and Bertaut and Haliassos (2006)]. It simply states that, by simultaneously having expensive credit card debt and low yielding savings in deposit accounts, consumers forego profitable arbitrage opportunities. Telyukova and Wright (2008) and Telyukova (2011) claim that this puzzle can be explained by the fact that money is more liquid. Our work suggests that liquidity differences are only part of the explanation, since we study financial instruments with the same liquidity and still find a puzzle.
The remainder of the paper is organized as follows. In section 2, we present a brief description of the Mexican credit card industry. In section 3, we introduce the data used in our analysis. Section 4 presents the stylized facts of the data. In section 5, we discuss potential explanations for these facts. In section 6, we lay out some potential supply side implications of our results. Finally, section 7 concludes. Due to space constraints some robustness analysis, figures and analysis is reported in the Online Appendix.
2
Credit cards in Mexico
2.1 The market
As of March 2008, 27 million credit cards were in circulation in Mexico, up from 15 million in 2005 –the end of our sample period– and 11.5 million in 2004. A large part of this growth came from banks issuing new cards to existing cardholders, as attested by the increase in the number of cards held by the typical cardholder from 3.4 in 2006 to 4.2 in 2008 [Banxico (2009)]. In spite of these trends, credit card market penetration in Mexico has remained small relative to other countries: in 2007, for instance, there were only 0.23 credit cards per capita in the country, while the equivalent figure in Brazil, Chile, and the U.S. was 0.62, 0.32, and 4.39, respectively.
The credit card market has remained highly concentrated, with the four largest banks holding a steady market share of around 80% for over a decade. The average
credit card interest rate has kept a spread of 28 percentage points above the federal discount rate (TIIE) [Banxico (2006)]. In addition, fees and service charges have been ranked as the highest in Latin America [Avalos and Hernandez (2006)]. During our sample period banks have earned considerable profits. For instance, while the return on equity (ROE) in the banking sector in 2005 for Korea, United Kingdom, Chile, Canada, U.S., and Spain was 19.6, 17.5, 16.9, 15, 14.1, and 13.6%, respectively, in Mexico it was 25%. Mexico also ranked high in terms of ROA, with 2.7% [COFECO (2007)]. A large part of revenue has come from interest income, in which credit cards play a large role.
In light of these and other indicators, Mexican authorities have pursued a num-ber of policies to foster competition, including promoting the entry of new banks –which more than doubled from 2000 to 2010– and enacting regulations to im-prove the competitive environment of the industry. In January 2004, for instance, a new law came into effect –Ley para la Transparencia y el Ordenamiento de los Servicios Financieros–, which mandated lenders to disclose information about loan terms. Other new regulations forced banks to accept payments to credit card accounts via electronic transfers from other banks. Nonetheless, regulatory changes have not translated into any noticeable reduction in prices or market shares, and anecdotal evidence suggests that switching between providers is still infrequent. The fact that increased number of banks entering the market and regulatory changes have not had any clear effect on market shares or prices sug-gests that demand side factors could be playing an important role in shaping competition.
2.2 Contractual features
Banks offer a variety of credit card products in Mexico. In general, these prod-ucts differ from each other by the benefits and rewards offered, by the fee and service charges, and by the interest rates they charge. In Mexico, interest rates at origination are set at the product level. That is, consumers qualifying for a given card product typically get the same interest rate, regardless of their risk profile. In spite of this restriction, it is common for banks to send temporary interest
rate offers (TROs) to existing customers. In other cases, banks grant low-interest cards to customers opening checking or savings accounts.
3
Data
3.1 Construction of the data set
In order to properly study allocation decisions, we require a panel of high-quality data with information on all the credit cards held by each consumer. We constructed such a data set with the collaboration of the Credit Bureau and the three largest commercial banks in Mexico. First, we asked the Credit Bureau to draw a random sample of 100,000 consumers who had at least one credit card by November 2004. This data set contains a unique identifier for each individual holding a credit card; an identifier for each loan in all banks; the delinquency status of these accounts; and some socio-demographic characteristics. With the loan identifiers at hand, we asked the three largest banks to provide monthly information for every credit card account in the sample for 2004 and 2005. This data set comprises all the information contained in the accounts’ monthly billing statements, including debt, purchases, payments, minimum payments, credit lim-its and interest rates. The data also contain information about the ‘type’ of card (e.g. Classic, Gold, Platinum, etc.) and some additional demographics recorded during the credit card application process. Importantly, the interest rate informa-tion in our data is very precise and corresponds exactly to the rate that consumers see in their monthly statement, including offers.
Due to the administrative costs involved in acquiring the data, we focused only on the three largest banks. However, since the industry is highly concentrated, we were able to match the entire credit card activity of 69% of the cardholders in our original sample. The data cover the period 2004-2005 for two banks, and from October 2004 to September 2005 for the third one. Due to technical issues while extracting the information, one of the banks provided data starting only in late 2004. Thus, our panel is unbalanced. We also eliminated individuals who
had less than six months of information available.
For the sake of simplicity, we focus on individuals holding ‘exactly’ two ‘active’ and ‘comparable’ credit cards issued by one of our three banks, and dropped observations which did not meet this criterion. We consider a card ‘active’ if the account remained open between January 1, 2004 and November 31, 2005, regardless of the payments or purchases made during this period. We define two credit cards as ‘comparable’ if both are of the same ‘type’ (e.g. both cards are Gold). In our sample period, cards of the same type issued by different banks shared the same benefits and rewards programs (points, traveler miles, shopping discounts, etc.). These benefits were just beginning to expand in Mexico during our sample period. Around 65% of the cards are ‘Classic’ type, which did not have reward programs in our sample period.
We selected the sample this way to have a clean comparison between homo-geneous cards that can resemble closely the homohomo-geneous product case found in textbook models. This restriction comes at a cost, as our selection precludes us from generalizing our results to the entire population of credit card holders.We acknowledge this limitation but point out two facts. First, there is no conspicu-ous reason why individuals with two cards allocate their debt less optimally than consumers with three or more cards. Secondly, based on calculations from the random sample of the Credit Bureau, we estimate that approximately 11% of cardholders in Mexico had exactly two active and comparable credit cards as of December 2005, making our analysis directly relevant for this population. This leaves us with a sample of 10,335 consumers and 114,720 consumer-months. Of these, 103,343 consumer-months involved paying interest on at least one card. It is only for these latter observations that the allocation problem we study is really relevant.
3.2 Descriptive statistics and sources of variation
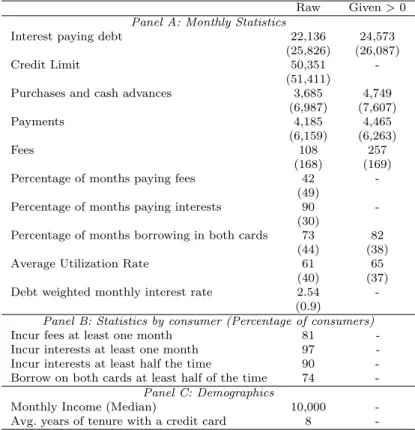
Table 1 presents summary statistics for the main variables we use for our anal-ysis. The top two panels show summary statistics once we combine the two credit cards held by each person. Some facts stand out. The first is the high interest
rates charged by banks. The average monthly debt-weighted interest rate equals 2.54%. Second, in spite of these prices, interest paying debt is substantial. The average total debt equals 22,136 pesos in 2005, which corresponds to more than two times the median monthly income of the consumers in our sample. Moreover, individuals pay interest 90% of the time and late payment or overdraft fees 42% of the time. As a result, banks earn substantial revenues –666 pesos a month per consumer on average– with 17% of this being comprised of fees and the rest of interest payments. Third, consumers borrow extensively on their two cards. In fact, 74% of consumers allocate debt to both cards at least half of the time. Finally, the median of the account tenure is 8 years and the median monthly income equals 10,000 pesos (about $1,000 USD), which corresponds to 1.47 times the GDP per capita of Mexico in 2005.
A possible concern is that individuals holding cards with very different interest rates are inherently different. In our sample, consumers carrying cards with a
large interest rate differential (above 1.1% per month) are not very different
economically from those carrying cards with a small differential. Only for two out of more than ten variables we find a statistically significant difference between the two groups, with the first group earning 590 pesos less of monthly income, and carrying lower debt in the amount of 2,700 pesos (i.e. not large amounts). Similarly, we find no statistically significant differences between consumers who opened a new low-interest card and those who got a new high-interest card, suggesting that selection may not be an important issue.
Our empirical analysis exploits the variation provided by the difference in in-terest rates across the cards held by each consumer, which we call the gap. The
distribution of the gap has three modes (at 0, 1.2 and 3.5% per month) and
substantial variation. The median difference is 1.1%, and the overall standard deviation is 1.18% points (Figure 1 in the Online Appendix shows this distribu-tion). Its decomposition into between and within components indicates that 68% of the standard deviation is explained by consumer fixed effects, and the rest by within-individual time-series variation. An important source of this variation is given by temporary reductions in the interest rate, or teaser rate offers (TROs)
–on average, 1.8 percentage points per month– that banks send to existing clients with a duration ranging from one to six months. In our sample, there are 3,979 consumers with at least one such offer for at least one of their cards. These offers are not coordinated across banks: the correlation between dummies indicating offers is only 0.07. Despite these offers, 53% of consumers never experienced a change in the rank of their cards, with one card always being more expensive.
4
Analysis
This section presents several stylized facts about how consumers allocate their credit card debt. Our primary interest is to assess whether, in the absence of product differentiation and pecuniary switching costs, individuals minimize in-terest charges. We do this in two ways. First, we study whether debt revolvers with two identical cards borrow mostly on their low-interest card when it is fea-sible to do so. Specifically, we compare the actual allocations of debts, purchases, and payments with the allocations that would have arisen had cardholders mini-mized financing costs. Next, we push the analysis one step further and examine whether consumers with two equally-priced cards substitute balances away from their expensive cards toward cards with an outstanding teaser rate offer, and in the process experimentally estimate own and cross-card debt-interest elasticities. In presenting each fact, we first describe the variables and the specific sample examined, then we move to summary statistics and regressions results, and finally to robustness analysis. To simplify the specifications, throughout the regression analysis we randomly select one of the individuals’ credit cards and label it as ‘card 1’. We keep this label invariant throughout our analysis. This strategy allows us to balance observables and unobservables and run regressions for just one card. In an effort to keep the discussion focused, we separate the data facts from their interpretation and leave such discussion until the end of this section.
4.1 Relative prices as determinants of debt, purchases, and payment allocations
We begin by describing the actual allocations of debt, mainly because interest is charged on this figure. However, our analysis also considers the allocation of purchases and payments. This is for three reasons. The first and most obvious is that switching credit card balances may be difficult if balance transfers are costly, whereas purchases and payments do not need to be literally transferred. Second, by focusing only on debt, we increase the chances of double counting one-time ‘mistakes’ if consumers do not have enough liquidity to pay off their outstanding balances. Finally, while interest is paid on debt, individuals ultimately decide on purchases and payments; debt is simply the cumulative result of these choices. By focusing on new debt, we are able to capture consumers’ current decision-making rules in more detail.
We concentrate on the intra-temporal allocation across cards; that is, we take the total outstanding balances on all cards (or alternatively, the monthly amount purchased with or repaid to both credit cards) as given. Conceptually, this ap-proach is equivalent to separating the consumer problem into two stages. In the first stage, individuals would decide on the total amount of credit card purchases, and payments, and subsequently debt. In the second stage, they would allocate these total purchases, payments, and outstanding balances across their cards. This simplifies our analysis at little cost, given that dynamics seems to play a
minor role in the way consumers manage their debt among their different cards.2
2There are advantages and disadvantages to conditioning on total borrowing and abstracting
from dynamic considerations. The main advantage is that we are able to focus on a much simpler problem. The main disadvantage is that, in reality, the allocation problem in reality may depend on expectations about the future, such as anticipated income, changes in credit card terms, or indivisibilities in purchases. For example, consumers may pay off their lower interest credit card instead of the expensive card to free-up cheap credit for a large purchase; or they may borrow from expensive credit cards today because they believe they will be able to pay their debt in the future without incurring interest, although ex-post they may not be able to do so [see Ausubel (1991)]; or they may think that the identity of the expensive card may change in the future. We believe these considerations are quantitatively small. In section 5, we provide some supporting evidence for this hypothesis.
4.1.1 Allocation of debt
Analysis: We define the amount of ‘misallocated’ debt as the high-interest paying balances that could be shifted into the low-interest card up to its credit
limit.3 We estimate this figure as a percentage of the total outstanding balances
and take the average over the months for which information is available to obtain the average for each consumer. The average (median) consumer misallocates 21% (16%) of their total debt by borrowing on high-interest cards, with an interquar-tile range of [3%, 40%], meaning that balances are often allocated to high-interest cards (Figure 2 in the online Appendix plots the distribution of the fraction of misallocated debt).
Using a sample for which the credit limit constraints do not bind, we find that an increase of 100% in the interest rate gap is associated with a change in the fraction of debt allocated to the expensive card, decreasing from 0.50 to 0.49. In more flexible and general regressions, we find that functions of the interest rate gap (e.g. decile dummies or 5 degree polynomials) can explain at most 6% of the variance in the share of debt allocated to the low-interest card. Among most borrowers, misallocations are also quite persistent. In our sample, 62% of consumers carry high-interest debt more than half of the time on their expensive cards, even though they could feasibly transfer these balances to cards with a lower interest rate. Moreover, as shown in Figure 3, these mistakes do not fall as the tenure of the card lengthens, suggesting that consumers do not learn to avoid
them.4
Robustness: Interest rate differentials and total outstanding balances can in-fluence the scope for mistakes, because as they increase, mistakes become more costly. To investigate whether our results are driven by observations wherein stakes are small, we estimate a nonparametric kernel regression of the fraction of misallocated debt on each one of these two variables. We find that the fraction
3This figure is calculated as the difference between the actual balances on the expensive card
and the balances on the same card had the consumer allocated all her debt up to the credit limit on the cheap card and the rest on the expensive one.
4Our working paper version showed persistence of misallocation for purchases and payments,
of misallocated balances does not diminish monotonically with the interest rate gap (see Figure 3 in the Online Appendix). We also find that total outstanding balances are only negatively related to the fraction of misallocated debt below 10,000 pesos, and are flat afterwards. That is, on average, individuals do not manage debt better as stakes increase.
Our results are also robust in the use of different samples wherein: (a) the interest rate gap is larger than the median (1.1% per month); (b) the high-interest card is always more expensive than the low-interest card, which reduces the role of uncertainty as a possible explanation for the results; (c) the overall debt is above the 75th percentile; (d) the account tenure of at least one of the cards is longer than eight years (the average in our sample); (e) consumers pay interest on both cards every month; (f) consumers only hold Classic cards; (g) consumers do not receive any offer during the sample period, and; (h) the utilization rate (the ratio of the credit-card balance to the credit limit) of both cards is below 60%, which precludes the possibility that our results are driven by liquidity constraints or concerns about overdraft fees.
Cost of the effect: How expensive are misallocations? To answer this question, we estimate the ‘avoidable costs’ for each consumer. These costs are the monetary counterpart of our previous misallocation measure. We define these costs as the difference between the financing costs that a consumer actually incurs and the minimum feasible cost necessary to finance her total outstanding balances. As before, we make this calculation month to month. To compute, we take as given the primitives of the problem, namely total debt, credit limits, interest rates, and
overdraft fees, and solve a simple linear optimization problem to minimize cost.5
Figure 2 shows the distribution of avoidable costs. On average, consumers leave on the table 683 pesos per year or 31% of their financing cost. This is equivalent
5In the absence of credit limits, consumers minimize costs by allocating all their debt to
the low-interest card. Alternatively, if the overall balance is larger than the credit limit on the cheap card, the consumer should pick the cheaper option between allocating her overall debt to the high-interest card and paying an overdraft fee on her low-interest card, considering that the maximum amount a consumer can overdraft such account is at most, 20% above the credit line. In most cases, the optimal solution involves transferring debt to the low-interest credit card.
to approximately 1% of their annual income, a nontrivial amount. The median cardholder leaves 451 pesos. For the 90th percentile, the loss is equal to $1,701
pesos or 43% of her total financing cost.6
A useful benchmark is the allocation that would arise had individuals allocated their debt in a random way. To estimate this allocation, we draw random numbers from a uniform distribution over [0,1] to proxy for the fraction of debt allocated
to the low-interest card.7 We find that the median consumer in our data leaves on
the table 262 pesos per year more than the median consumer under the random
allocation.
Our figures are likely to be conservative measures of the distribution of avoid-able costs because they include consumers who have little room for mistakes, either because (i) they have little interest-bearing balances; (ii) they have debt up to the credit limit on their cheap card; or (iii) because the differences in inter-est rates are negligible. When we condition on the amount of total debt, interinter-est rate differences, and credit availability on the cheap card all above their respective medians, the amount of misallocated costs increases substantially to a mean of 3,227 pesos, a median of 2,083, and a 90th percentile of 7,360 pesos. The average extra cost turns out to be 110% above the minimum feasible cost!
Fact 1 (Misallocated debt):On average, consumers misallocate 21% of their debt by borrowing on high-interest cards, leaving on the table an average amount of 683 pesos per year or 31% above their minimum feasible cost. This figure increases to 3,227 pesos when we look at observations with outstanding balances, interest rate gap, and available limit above the median, or 110% above the minimum
6The previous analysis concentrates on the stock of debt. This is appropriate as interest is
charged on outstanding balances. It could be argued, however, that to the extent that consumers find it difficult or costly to transfer balances between cards, or if liquidity constraints are binding and consumers cannot pay off their debt, it is possible that cardholders carry over the misallocation cost for many periods. In a previous draft of this paper, we address this concern and calculate a conservative measure of the avoidable costs using the monthly payment and purchase decisions. This is basically the flow of new debt, which in principle should be easy to manipulate. We found that in 84% of the cases, consumers pay extra costs due to the wrong allocation of payments and purchases. On average, consumers leave on the table about half of the amount calculated here using the stock of debt.
7If the drawn value implies an allocation that exceeds the credit limit on the low-interest
card, we equalize the debt on the cheap card to the credit limit and allocate the rest to the expensive card.
feasible cost.
4.1.2 Allocation of Purchases
We now describe how consumers allocate their monthly purchases conditional on the total amount spent with both cards in a given month.
Sample: In studying purchases, it is crucial to consider two contractual features of credit cards. The first is that consumers cannot use a card if it is full, or if it is frozen as the result of late payments. The second is that interest is charged immediately on new purchases if consumers do not pay off their previous balances. This is important because, in such scenario, expectations about paying or not paying interest in the future are irrelevant.
To have a clean comparison across cards where purchases are feasible and interest is incurred immediately, the sample includes only observations in which (i) consumers carried outstanding balances and paid at least the minimum due on both cards; (ii) wherein total monthly purchases were strictly positive; and
(iii) total monthly purchases could fit on any of the cards.8 This selection is
very stringent. It leaves us with 24,267 consumer-month observations and 2,680 consumers. However it is mostly just an expositional device since the results survive if we relax criterion (iii).
Analysis: Given our sample, we define the amount of ‘misallocated’ purchases simply as the purchases made with the high-interest card. Figure 4 plots the distri-bution of misallocated purchases as a percentage of the total monthly credit card spending, both of consumer-months (top-left panel) and also within-consumer av-erages (top-right panel). Consistent with our previous results, a large fraction of purchases are made with the higher-interest cards. On average, consumers misal-locate 47% of the value of their purchases to the more expensive card which they hold. In unreported regressions, we find that an increase of 100% in the interest rate gap from 1.1% to 2.2%, is associated with a reduction in the fraction of pur-chases allocated to the expensive card, from 0.50 to 0.48. We find that interest rate differences deciles can account for, at most, 1% of the variance in the fraction
of purchases allocated to the high-interest card. Furthermore, the consumer level averages (top-right panel) show that purchasing with the expensive card is not a one-time mistake, but is repeated on an ongoing basis. In our sample, we find that 81% of consumers misallocate some amount of purchases more than half of the time.
Robustness: We estimate nonparametric regressions of the monthly fraction of misallocated purchases against the interest rate gap, and against the total purchases made with both credit cards. Figure 4 in the Online Appendix shows that neither interest rate differentials nor total credit card spending affect the allocation of purchases. This latter robustness check is important, and renders it unlikely that our results are explained by small periodic charges, such as cable TV or cell phone bills. We evaluate this possibility further by soliciting one of our cooperating banks to provide us with twelve months of transaction data for 1,500 random accounts as of December 2005. We find that, on average, the value of monthly service charges represents only 5% of the total monthly purchases made by the individuals in this small sample.
Our main result also holds in samples wherein: (a) the interest rate gap is larger than the median (1.1% per month); (b) the total outstanding debt in both cards during that period is larger than the median (20,000 pesos); (c) the monthly purchases during that period are in the highest quartile (monthly purchases above 3,840 pesos); (d) consumers only hold Classic cards; (e) consumers do not receive any offer during the sample period; and (e) the total monthly purchases do not necessarily fit on any of the cards (one of the conditions of our restricted sample).
Fact 2 (Misallocated purchases): On average, consumers misallocate 47% of the value of their purchases to high-interest cards even though they could feasibly make these purchases with low-interest cards.
4.1.3 Allocation of Payments
We now study whether consumers minimize interests cost and allocate most of their payments to the more expensive card, taking into account the minimum payment.
Sample: We use observations in which individuals make the minimum payment on both cards and repay more than the minimum on at least one of the cards. In addition, we consider only those periods in which individuals had revolving debt on their two cards. In our sample, 48% of the individuals we observed paid at least twice the minimum payment amount to one card, and 31% paid at least twice the minimum payment amount to both cards. Our final sample includes 63,323 observations.
Analysis: Before describing our misallocation measure, we examine briefly the distribution of actual payments, as they can be indicative of individuals’ decision-making rules. The histogram is presented in the bottom-left panel of Figure 4. The distribution is quite symmetric and apparently unrelated to interest rate differences. Notably, the 50%-50% payment split is modal, which is similar to what Benartzi and Thaler (2001) found for retirement saving plans. The median consumer allocates 49% of their monthly payments to repay low-interest debt.
The pattern of allocations in this figure, however, can simply be a reflection of the constraints imposed by the monthly minimum payment, instead of the choices made by consumers. To overcome this confound, we use the payments above the required minimum amount allocated to the low-interest card as our key variable to measure misallocated payments. The bottom right of Figure 4 shows the distribution of this variable as a proportion of the total payments
above the minimum, averaged within consumers.9 The histogram is symmetric,
with spikes at 0.0 and 1.0. On average, after covering the minimum payment due, consumers misallocate 50% of their monthly payments towards repaying debt on their low-interest card. In monetary terms, this means that on average individuals pay 1,434 pesos monthly to the wrong card, which definitely cannot be attributed to a rounding error.
As before, we estimate regressions of the fraction of payments above the min-imum allocated to the expensive card on different functions of the interest rate gap. We find that the interest rate differential explains less than 1% of the
vari-9The total payments above the minimum are calculated as the total payments made during
ation in the dependent variable. The coefficient of the interest gap in a linear regression implies that an increase of 100% in this variable is associated with a reduction in the fraction of payments above the minimum allocated to the high-interest card from 0.51 to 0.46 (t-stat=2.57). This is twice the effect we found for purchases, but it is still economically very small.
Robustness: Figure 5 in the Online Appendix evaluates the robustness of our estimates when compared to other cases in which mistakes are more costly. As in the previous two cases, interest rate differentials have little effect in the allo-cation of payments to the low interest card. Although the alloallo-cation of payments improves more than that of purchases as stakes rise, its magnitudes are small and misallocation of payments persists even when the consumer is paying 15,000
pesos in a month and when themonthly difference in interest rates is 3% or more.
These results are also robust in alternative samples. In particular, they hold in samples in which: (a) the interest rate gap is larger than the median (1.1% per month); (b) the total outstanding debt in both cards during that period is larger than the median (20,000 pesos); (c) the total monthly payments over the minimum due are in the highest quartile of the distribution (above 8,400 pesos); (d) the cards never changed ranks; (e) the credit cards had a closing date differential of eight days or less, which makes it less likely that individuals expected to pay off the high-interest card in the interim; (f) consumers only hold Classic cards; and (g) consumers do not receive any offer during the sample period.
Fact 3 (Misallocated payments): On average, consumers misallocate 50% of their monthly payments above the minimum to pay down low-interest debt.
4.2 Effect of interest rates on debt levels and substitution of debt across cards
Thus far, we have documented that individuals borrow on high-interest credit cards while credit cards with lower interest rates remain simultaneously under-utilized in their wallets. If consumers seem to put little weight on relative interest
rates when allocating debt across cards, why then in Mexico –and in the U.S. as well– is it common for credit card issuers to send temporary interest rate dis-counts or teaser rate offers (TROs)? The answer is that these types of offers are effective at generating new debt [Ponce (2008)]. In this section, we use this fact to push our analysis a bit further. More precisely, we investigate whether con-sumers with two equally-priced cards who receive a temporary offer on one of them save on interest charges by allocating their new debt to the card with the outstanding offer. The analysis is interesting not only because it offers another way to test the null hypothesis of no substitution in the price margin, but also
because it provides information about the sensitivity of cardholders to changes
in the interest rate, (i.e. own-card and cross-card debt-interest elasticities) which is useful for understanding the underlying causes of our findings as well as several market outcomes.
Randomized offer: Estimating the response of debt to changes in the interest rate is difficult if banks set interest rates based on variables correlated with debt or debt changes. Fortunately, one of our cooperating banks helped us identify in our data control and treatment groups for a temporary interest rate offer (TRO) that was part of a large randomized experiment. According to our cooperating bank, the experiment was representative of their population of clients that were not delinquent, i.e. it was targeted to a broad population, which is good for
external validity.10
The market experiment was conducted in July 2005. The bank randomly
sam-10This is what the bank official explained to us and we could not get more details. However,
we sought determinants of the TROs by estimating a probit model where the dependent variable takes the value of one during the first month of the offer. We included as explanatory variables three monthly lags of debt, purchases, utilization rates, and dummy variables indicating whether the minimum payment was made; whether outstanding balances where positive; and whether total spending was positive. We used several specifications, but we could explain at most 5% of the variance of who received the offer, suggesting that the TRO was randomly targeted to a broad (unconditional) population, as the bank claimed. The average outstanding balances and purchases (in the single card) for participants in the experiment are 10,653 pesos and 2,048 pesos respectively, which are very similar to those for the entire population. The elasticities of previous debt and purchases on the probability of receiving the experimental TROs were in the range of -10% to -15%, meaning that slightly less active accounts were more likely to participate in the experiment.
pled tens of thousands of accounts and assigned them randomly to treatment and control groups. Those accounts in the treatment groups were randomly assigned
into groups receiving a one-month or a three-month teaser rate offer.11Both offers
involved a decrease of about 1.2% points in the monthly rate, bringing down the average interest rate from 2.4% to 1.2%. On card 1, we have 209 accounts that received the three-month offer and 227 that received the one-month offer. On card 2, we have 216 and 213, respectively. The randomization appears to have worked in the intersection with our data. The differences in debt, purchases, payments, interest rates, and credit limits across the three groups were not statistically dif-ferent at the 5% level (not reported) pre-intervention. Likewise, the propensity scores of treatment group accounts versus control group accounts are extremely similar for both groups, as they should be if randomization worked to balance observable variables.
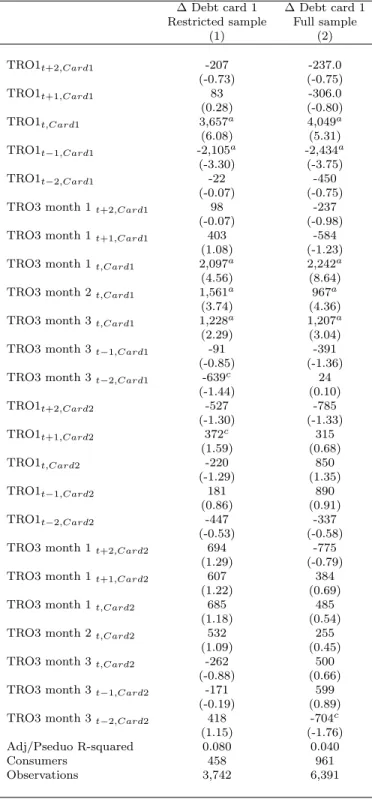
Analysis: We estimate the following specification:
∆Card1 Debtit =α+ t+2 X t−2 βtjCard1 T ROitj + t+2 X t−2 δtjCard2 T ROjit+X 0 γ+it (1)
Equation 1 regresses the one-period change in debt on indicator variables of the one-month and three-month TROs in each of the two cards –indexed by j=1,3, two
distributed forwards, two distributed lags12 and controls for credit limits, time
dummies, and indicator variables for other non-randomized TROs. The effect of the three-month TRO is further broken down by months. This specification allows us to measure the effect of TROs in card 1 and card 2 on the outstanding balances on card 1. Column (1) of Table 2 concentrates on individuals holding two
‘equally-priced’ cards one month before the offer.13 In this situation, consumers
can make immediate savings on interest charges by moving their outstanding
11These durations are the most prevalent in our data: about 37% of TROs are one-month
offers while 25% are three-month offers.
12Since the TROs were launched during the last months of our sample, we only observe two
months of data after the three-month offer expired.
13We define two cards as having similar interest rates if the absolute value of the difference in
interest rates in the month before the offer is less than 0.005 per month. Using this definition, about 48% of the offers were sent to individuals holding equally-priced cards.
balances away from the high-interest card to the card with the teaser rate offer. Note that the dependent variable is the one-month change in debt; that is, we are not interested in a situation in which consumers switch the whole stock of debt to the card with the outstanding offer, but only new debt.
We estimate this equation by OLS, with clustered standard errors within ac-counts. Column (1) in Table 2 shows that on average, for every percentage point decrease in the interest rate, outstanding balances grow by 3,657 pesos in the case of one month offers, and 2,097 pesos in the case of three month-offers during the first month, and 4,886 pesos during the whole teaser period. These figures imply elasticities of about -0.57 and -0.84 for the one-month and three-month offers,
respectively, when we use initial prices.14
In the case of one month-offers, debt decreases back by 2,434 pesos at the expiration of the teaser period. In the case of three-month offers, debt does not decrease once the teaser period is over, which implies that on average individuals
end up with more debt as a result of the offer.15 More importantly, the impact
of a reduction in the interest rate of card 2 on the outstanding balances of card 1 is statistically zero, which implies that the cross-price elasticity equals zero. Column (2) shows the estimates when we use the full sample of randomized offers, not just those cards with similar interest rates before the offer. The results are qualitatively similar.
All in all, these results suggest that, while consumers strongly respond to move-ments in own-card interest rates, they do not substitute balances away from high-interest cards towards low-high-interest cards, supporting our previous findings that substitution across cards in the price margin is negligible.
Fact 4 (Response to changes in interest rates:) The debt-interest rate elasticities equal -0.57 and -0.84 for offers lasting one and three months respec-tively. However, cross-card debt elasticities are statistically zero.
14These results are consistent with those obtained by Gross and Souleles (2002) in the U.S.
credit card market using instrumental variables. They estimate short-run and long-run elastici-ties of about -0.8 and -1.3, respectively. We study a different population using a different source of variation (since our offers are temporary and randomized) and find similar effects.
15This is consistent with the findings by Ponce (2008) who used a different experiment in
5
Interpretation
In the previous section, we have presented evidence that strongly indicates that consumers do not substitute across cards in the price margin. This holds both for the stock of debt and for the flow of new debt. Assuming the following conditions –(1) homogeneous cards, (2) no switching costs, and (3) easily-accessible informa-tion –, our facts are difficult to reconcile with a simple financial cost minimizing model.
In the discussion below, we argue that these assumptions are reasonable in our environment and present evidence favoring behavioral explanations as a leading force behind allocation mistakes. Regardless of the underlying reasons, however, we believe that the facts themselves as well as their potential implications for market outcomes are of intrinsic value.
Homogeneous cards: Most of the facts discussed in the previous section require that the two credit cards held by a given consumer are actually
‘com-parable’. We were aware of this challenge and selected the sample accordingly.16
In spite of our efforts to select a sample of similar cards in terms of rewards and services, it is possible –although unlikely– that the decision to borrow on an expensive card is influenced by unobserved features of the card that provide an economic benefit to the consumer and that were not captured by our matching. For this to be the case, however, the high-interest card would have to be more attractive in terms of unobserved characteristics in order to explain Facts 1 and 2, while the low-interest card would have to be ‘easier to pay’ if it is to explain
Fact 3.17
16As already mentioned, consumers in our sample carry cards of the same type (classical vs.
classical, gold vs. gold, etc) and with almost identical rewards programs. In fact, in our sample period reward points were almost non-existent in Mexico. Cards are also similar in terms of credit limits: the median difference is 4,000 pesos or 20% of the median credit limit.
17Contrary to the case of purchases, where somebody could argue that allocations are
influ-enced by unobservables, such as reward programs, the decision to pay one card or another is not affected by these features. Perhaps the main unobservable in this decision is ease to pay. However, this feature does not differ much in the set of banks we study, as the number of branches was relatively similar as well as their e-payment platforms. Furthermore the identity of the cheap card (measured using average interest across months) is distributed almost in equal proportions across banks, 31% in bank 1, 31.8% in bank 2, and 37.2% in bank 3, making it
One potential check would be to analyze if Facts 1, 2, and 3 vary systemati-cally with proxies for card characteristics. Unfortunately we have only one such characteristic, but a very important one: we observe the type of card. It turns out that Facts 1 and 2 survive if we only use cards which did not have a reward point program (‘classic’ cards), suggesting that at least this important margin of heterogeneity is not driving our results. Similarly, Fact 3 holds in a sample in which both cards were issued by the same bank and in samples in which credit cards had a closing date differential of eight days or less, suggesting that neither ease to pay nor uncertainty about cash flows in the interim period are driving our results.
Negligible switching costs: Our analysis looks at allocations between cards that people already hold, as opposed to the universe of cards available in the market. We consider that this setting substantially reduces the scope for switching costs –at least typical pecuniary ones– to drive the results. While it could be argued that the transaction costs of transferring outstanding balances across cards could be meaningful, the costs of switching new debt are not: taking a different card out of the wallet for making purchases or writing a check in the appropriate amount to pay a given card are truly insignificant costs. Actually, in our data,
consumers make payments towards both cards in the same month in 38% of the
cases, and make purchases with both cards in 75% of the cases. In both of these
cases, the incidence of misallocations remains the same.
Perhaps the strongest evidence supporting the notion that switching costs are low is the prevalence of switching itself. Out of debt revolvers, about 40% of observations involve switches from revolving on a single card to revolving on both cards in the next month, irrespective of whether the initial card was cheaper or not. In the end, the discussion of whether switching costs can explain the Facts involves benchmarking them against the benefits of minimizing costs, which are in the order of 700 pesos per year or 3,227 if we consider individuals with a larger margin for mistakes. We believe that these magnitudes are hard to rationalize by
impossible for a bank fixed effect to explain why people allocate a considerable fraction of their payments to the cheap card.
a cost of taking the right card out of the wallet.
Easily accessible information:Facts 1-4 could arise if information about the interest rate on consumers’ credit cards is difficult to obtain. In Mexico, however, credit card companies do disclose the interest rate they charge on the consumer’s monthly statement. This statement arrives on people’s doorstep each month, so search costs are practically zero. It is therefore fair to say that deficiencies in information disclosure are unlikely to rationalize our findings.
Small pecuniary stakes? Even if the cost of acquiring information on in-terest rates is low, switching costs are negligible, and cards are homogeneous, consumers might be indifferent regarding which card to use or pay if the savings on interest charges are small. Small pecuniary stakes is a candidate to explain the low substitution described in Facts 1, 2, and 3. This explanation, although appealing, is not fully supported by our analysis for two reasons. First, our re-sults show that consumers do not allocate their debt differently when stakes are higher (See Figures 3, 4, and 5 in the Online Appendix). Second, we showed that consumers respond to temporary changes in the interest rate to save a few dollars (Fact 4). On average, individuals increase debt by 4,000 pesos to save about 80 pesos during each month of the teaser period, a pretty substantial reaction for such small savings considering that they could save 10 times more on interest charges by taking the right card out of their wallets.
Furthermore, the amount left on the table is not trivial, particularly when compared with other figures in the literature. Zinman (2007) uses the Survey of Consumer Finances for the U.S. to study foregone arbitrage between credit card debt and demand deposit accounts. He finds that “fewer than 10% of credit card holders could save as much as $10 USD (about 106 pesos) per month by managing their liquidity more aggressively”. Similarly, the median consumer in Stango and Zinman (2009) leaves $43 on the table (about 450 pesos) per month. Finally, Choi et al. (2011) study 401(k) savings behavior and find that in the companies they study, people forego one-time matching opportunities of between $130 and $750 USD. We look at missed arbitrage between much closer substitutes and find similar sums left on the table.
Indivisibilites in purchasesare also unlikely to drive our results. Most pur-chases are small relative to the available credit limit., The median purchase is 1,180 pesos and the median available credit after purchases is 6,180 pesos. More importantly, only 7% of observations that bought with the expensive card had a large purchase (>90th percentile) in the next 3 months on the cheap card, making it unlikely that they were making room in the cheap card for a large purchase. Finally, it is not the case that consumers make large purchases with one card and small purchases with the other. The correlation of purchases within months across cards is 0.18.
Another explanation is simply that consumers ignore useful information.
This explanation is not only consistent with Facts 1, 2, 3, and 4, but is also sup-ported by three pieces of evidence. The first comes from a small survey conducted
in 2006 on 200 cardholders in public places in Mexico City.18 The proportion of
respondents who claimed to know which card had a lower interest rate during the
preceding month was 67%.19 The second piece of evidence comes from examining
the allocations of consumers who just got a new card. The idea is that, for these individuals, prices should be on top of mind as they just searched and shopped for a new card. In this sample, we find that, on average, individuals misallocate 23% of their debt by borrowing on high-interest cards as early as three months after opening a new accounts. This figure raises to 26% after five months.
A final and strong piece of evidence showing that information exerts little influ-ence over debt management decisions is provided by Elizondo and Seira (2012). In this paper, the authors sent letters to a random sample of about 12,000+ credit card holders of a large bank in Mexico (while leaving 90,000 clients as
18We asked individuals about the number of cards they had, the type of cards they had, and
the card issuer, as well as a rough estimate of the outstanding balance and the credit limit for each one of them. We followed up with consumers who had at least two cards of the same type (gold vs. gold, classic vs. classic), carried interest paying debt on at least one of them, and had an utilization rate below 60% in the month before the interview. We asked for respondents with low utilization rates, to avoid situations in which individuals make their decisions purely on the basis of credit limit constraints.
19These figures are smaller than those reported by Durkin (2000) for a representative sample
of US cardholders, wherein 91% of respondents claimed to know the APR on their cards and wherein only 7% considered obtaining information about terms difficult.
randomized controls). The letters showed their interest rate in font size +50pt, with a yellow background and in a very salient form. They find no effect of in-formation on debt, purchases, and payments, even though the cards issued by this bank were on average, amongst the most expensive in the market and that most people in the sample carried other credit cards. This evidence suggests that, even though information is readily available, consumers may not necessarily use it. This is consistent with the findings in Kling et al. (2012), who recently coined
the term ‘comparison friction’ for a situation in which consumers do not
ac-quire profitable information even if the benefit outweighs the cost. They show that comparison friction is present when comparing health plans.
Another possible explanation, made famous by Ausubel (1991), states that
consumers have biased expectations about their future borrowing and
thus, while they expect to pay off the expensive card, they end up not doing so. This theory implies that consumers may not care ex-ante about interest rate levels, since they do not expect to pay interest, and thus could explain Facts 1, 2, 3, and 4. In a prospective study, Elizondo and Seira (2012) compared what card holders expected to pay in two months’ time with what they actually paid. They find that 41% of respondents underestimated the interest they actually incurred. This result provides evidence for the existence of Ausubels conjecture. However, it cannot explain our results on payments or on purchases charging immediate interest.
Another explanation to our results is related to the theory of mental
ac-counting. According to a simple version of this theory, individuals categorize their activities into ‘mental accounts’ and make decisions within these categories [Thaler (1985), Thaler (1999)]. In our setting, this means that consumers often focus on an individual card in making credit decisions without taking into account the other card. Mental accounting effectively acts as a physiological switching cost and as such can explain Facts 1, 2, and 3. Mental accounting can also explain why consumers increase their balances only on the card that provides a TRO or a limit increase (Fact 4). Our small survey also shows direct evidence of mental accounting. About 31% of respondents answered that the main reason why they
carry debt on both cards is that they ‘use different cards for different purposes” as the main reason why they carry debt on both cards.
Finally, another possibility is that individuals anchor (or overly rely on)
non-price factors to allocate their balances. There are three pieces of evidence in favor of this hypothesis. The first comes from examining the response of debt to changes in credit limits. In our data there are 7,217 credit limit changes concentrated among 5,401 consumers. We find that increases in the credit limit lead to increases in interest paying debt, but only on the card whose limit changes, regardless of utilization or of whether the card whose limit increased is more expensive. That is, when consumers receive a higher credit line on the cheap card, they do not shift balances away from the expensive card. When the increase is on the expensive card, they simply increase their expensive debt, even when they have credit available on their cheap card. This confirms our previous results of low substitution and suggests that the credit line might act as an anchor in the determination of debt levels on a card-by-card basis (the specification and general results are more fully described in the Online Appendix).
The second piece of evidence comes from our small survey: when asked about the reasons why they borrowed on their expensive card, 43% replied that it was because they did not like to have “too much” debt on a single credit card, even though they had available revolving credit on their low-interest card. Here, the anchor is the level of outstanding balances on a given card. The final piece of ev-idence comes from our administrative data. Consistent with our previous results, we find that the amount of outstanding debt on a particular card is a powerful predictor of the allocation of payments. That is, individuals tend to pay more to the card that carries the highest balance rather than to the card that carries the highest interest. A five-degree polynomial regression on the fraction of outstand-ing balance on the low-interest card explains 10% of the variance in the allocation of payments. This is ten times more than the percentage of variation explained by the interest rate gap deciles. The coefficient of a linear regression implies an elasticity of 35% (t-stat=44.36). This is 20 times larger than the elasticity of the interest rate gap.
All things considered, our findings offer enough evidence to reject the neo-classical hypothesis that stresses that individuals minimize financing costs, and provide empirical support to theories that point to limitations on consumers’ ability to make optimal financial choices. Admittedly, we cannot disentangle the magnitude due to each of these explanations. However, given the heterogeneity of debt allocation decisions in our data, it is likely that many determinants have some weight. Perhaps more interesting is that, regardless of its underlying cause, low substitution must have an impact on market outcomes. We turn to this point next.
6
Implications for competition
Thus far, we have documented that consumers do not substitute balances away from high-interest toward low-interest cards, thus leaving on the table an average amount of 683 pesos per year. This sum constitutes a non-trivial transfer of resources from consumers to banks once we sum across consumers. A back of the envelope calculation based Table 1 shows that gross interest revenue per consumer
is on average 6,747 pesos (22,136 × 0.0254 ×12). Thus the extra financing cost
consumers incur represents about 10% of this revenue, and about 5.5 billion pesos
if extrapolated to consumers with more than one card.20These estimates suggest
not only that banks might be capitalizing on consumers’ mistakes, but also that they might be responding strategically to them in ways that introduce distortions
in resource allocation.21 We discuss this possibility below.
We begin by discussing two pricing implications of our results. First, if con-sumers do not substitute balances away from expensive cards, high prices can prevail in the market. This is because credit card issuers cannot poach
infra-20There were about 12 million cards in our sample period. If about 2/3 of cardholders had
more than one card, then about 8 million could make allocation mistakes: 8 million×683 pesos
≈5.5 billion pesos.
21We should recall that, in our setting, low substitution does not arise from “real”
prod-uct differentiation, but rather, it more likely arises from some sort of mental switching cost. Many switching cost models generate suboptimal market outcomes, in part because typically equilibrium prices depart from marginal costs and because entry is harder than optimal.
marginal balances from other banks, which makes deviations toward lower prices less profitable. Second, given that consumers respond to temporary offers but do not switch their balances from high-interest to low-interest cards, banks have incentives to set prices low to attract new balances and then set higher prices to milk existing balances. In extreme cases, banks may behave like monopolists holding up their own balances but competing hard to attract new ones, very much in the spirit of the Bargains-Then-Ripoffs models of the switching cost literature. Measuring the size of price distortions and potential welfare losses would require a structural model predicting what the price levels would be as a function of cross-price elasticities. This is outside the scope of this paper. Nonetheless, we provide evidence that suggests that banks dynamically set prices in a way that is
consistent with the Bargains-then-Ripoffs prediction.22Actually, there are reasons
to believe that credit card issuers set these types of contracts. In the U.S., for example, most credit cards offer an introductory low rate that expires after a few
months, after which the interest rate rises to a high level.23 In Mexico, there are
no ‘introductory’ offers, but banks still grant teaser rate offers to their existing clients. If banks indeed reduce interest rates to poach new customers or balances, we should observe a positive relationship between tenure and interest rates. This
is indeed what we find in our data. Controlling for risk24, demographics, as well as
month, bank, and type of card indicators, interest rates do increase with tenure, particularly early in the life of the card.
The left panel of Figure 5 plots the predicted OLS residual it of the regression
IntRateit =αi +γt+γXi+δ∗LaggedRiskV arsit+it. In order to control for cross-sectional differences, the specification includes consumer-level fixed effects.
22In our data, seasonally adjusted interest rates fluctuate widely over time. The within card
s.d. of detrended interest rates is about four times bigger than the between card s.d. (mean=0.02; within s.d.=0.0007; between s.d.= 0.0002), suggesting that dynamic price discrimination in the form of teaser rate offers, for example, may be an important component of pricing policy.
23DellaVigna and Malmendier (2004) provide evidence of these offers from major U.S. issuers.
They cite present biased preferences to justify this pricing pattern in credit cards. Switching costs is another very plausible explanation.
24Risk variables include four lags of delinquency (failure to pay the minimum payment), line
utilization, and payments as a fraction of the minimum, as these have been found to be the most predictive of default in logit regressions in our data and in the Mexican market in general (See the CNBV methodology to calculate credit card reserves).
As the figure shows, in a span of 12 months, adjusted monthly interest rates rise by 0.4 percentage points after consumers open their accounts and then remain at a high level. This corresponds to about 5 percentage points per year or 16% of the average interest rate. This result holds for both the new and the old card. The fact that this result holds for the older card could be interpreted as evidence of switching costs on the extensive margin (getting a new card), as the relevant comparison are the cards available in the market (the Bargains-then-Ripoffs strat-egy). The fact that it holds for the newer card could be interpreted as evidence of switching costs on the intensive margin (allocating debt across cards), as the outside option is now the other card.
Further evidence that low substitution is reflected in banks’ pricing strategies is presented in the right-hand side panel of Figure 5. The figure plots the average, across consumers, of the percentage difference in (detrended and consumer
de-meaned) interest rates between the new and the old card.25 As the Figure shows,
interest rates on the new cards increase initially and then remain constant. In fact, after fifteen months, the new card is almost 5% more expensive than the old card. If cardholders were to substitute balances, banks issuing a new card have no incentives to increase the price over time, as consumers would easily switch their balances to their old card. Yet, banks do not do so. Once balances are locked-in, banks issuing new cards raise prices as if there were no substitution across cards. A third implication of our results is that, if banks anticipate that consumers will carry balances on different accounts, they have incentives to offer clients not one but several credit cards. This would explain why banks sometimes offer new cards to their existing clients instead of granting them a higher credit line. In Mexico, this is evidenced not only by the increase in the number of cards held
by a typical consumer from 3.4 in 2006 to 4.2 in 200826, but also by the large
25Similar to the left panel in Figure 5, we regress the difference [r
new/rold]−1 on month dummies, consumer fixed effects, and risk controls; and plot theitresiduals against the tenure of the new card.
26A similar trend has happened in the U.S. , where the average number of active credit
cards among cardholders surpassed 3.5 in 2010 up from one in 1983 (Source: The Survey of Consumer Payment Choice Federal Reserve Bank of Boston, January 2010, and Bertaut and Haliassos (2006))