CMC Senior Theses CMC Student Scholarship
2011
The High Costs of Small Loans: Understanding
Interest Rates in Microfinance
Benjamin W. Hudgens
Claremont McKenna College
This Open Access Senior Thesis is brought to you by Scholarship@Claremont. It has been accepted for inclusion in this collection by an authorized administrator. For more information, please contactscholarship@cuc.claremont.edu.
Recommended Citation
Hudgens, Benjamin W., "The High Costs of Small Loans: Understanding Interest Rates in Microfinance" (2011).CMC Senior Theses.
Paper 159.
The High Costs of Small Loans:
Understanding Interest Rates in Microfinance
Submitted To Professor Darren Filson
And
Dean Gregory Hess By Benjamin Hudgens For Senior Thesis Spring / 2011 April 25, 2011
Table of Contents 1 Abstract ... 5 2 Introduction ... 6 3 Literature Review ... 9 4 Data ... 15 4.1 Firm Data... 15 4.2 Categorical Variables ... 17 4.3 Macro data ... 18 5 Hypotheses... 20 6 Results ... 23
6.1 The ordinary model ... 23
6.2 Interacting Region with Legal Status ... 25
6.3 Replacing Region with Countries ... 27
6.4 Replacing Country with Macro indicators ... 29
6.5 Robustness ... 31
7 Conclusion ... 32
8 Tables... 34
Table of Figures
Table 1: Interest Rates for MFIs ... 34
Table 2: Portfolio Quality Indicators ... 34
Table 3: Firm Characteristics ... 35
Table 4: Firms by Region ... 35
Table 5: Firms by Legal Status ... 36
Table 6: Dummy Variables ... 36
Table 7: Macro Variables... 36
Table 8: Firm Data on Limited Data Set ... 37
Table 9: Macro variables for limited data set ... 37
Table 10: The Original Model ... 38
Table 11: Interacting Region with Legal Status ... 39
Table 12: Country Dummies ... 40
Table 13: Macro Variables ... 41
Acknowledgments: I would like to thank Professor Darren Filson for helping me to conduct this analysis of the Microfinance market. I would also like to thank Ajaan Dave, who introduced me to Microfinance while I was studying abroad in Thailand. The community at Claremont
Mckenna College has helped me to learn a lot about the industry and in particular, fellow students Chris Temple, Zach Ingrasci, Sam Mitchell and others have taught me huge amounts with their anecdotes and their excitement about this blossoming industry. I would also like to thank my parents who have supported all of my interests and helped me to become a student concerned with the way the world should be.
1
Abstract
Abstract: This thesis will use data from 2009 to examine two questions about the Microfinance industry. First, why do firms charge interest rates well beyond their cost of funds and second, are there important differences at the national level that can help us to understand the high interest rates in Microfinance? I find that
interest rates are primarily a result of operating expenses, but profit-status has large effects in developed Microfinance markets. I also find that the Economist
Intelligence Unit’s measures of regulatory environment and industrial development explain a large portion of the variation in interest rates across countries.
2
Introduction
Poverty is one of the most important issues facing the world today. In 2005, more than 70 percent of individuals living in South Asia or Sub-Saharan Africa lived on less than two dollars a day along with almost 40 percent of individuals in East Asia and the Pacific (World Bank). Addressing the needs of the poor has taken many forms, but credit penetration has become one of the most important benchmarks for moving individuals out of poverty. It is no coincidence that 70 percent of adults in the developing world do not have access to formal financial services (Mohan and Potnis 2010). In addressing the global poor’s banking needs, the world’s has recently shifted its attention to an innovative opportunity in the form of Microfinance.
Microfinance has emerged as a unique solution for impoverished rural and urban
communities. In 2006, Professor Muhammad Yunus and Grameen bank were awarded the Nobel Prize for the bank’s notable accomplishments employing Microfinance in Bangladesh. Since it was founded in 1975, the bank has expanded dramatically and currently offers microloans to over 7 million customers. The work of Grameen bank demonstrated to the world an important truth about the world’s poor: they are credit-worthy.
Microfinance differs from the traditional model of banking by providing small-scale loans to individuals without credit histories. The fundamental challenge in expanding
mainstream banking to the world’s poor is information based: banks have no mechanism for filtering through which low-income individuals are credit-worthy and which are not.
The two most important changes that Microfinance introduced were group-lending and microloans. By lending to groups, instead of individuals, microfinance relies on “social
collateral. As a result of this model, Microfinance Institutions (MFIs) have some of the lowest default rates in the lending world. The default rate for MFIs is typically below 3 percent.
Additionally, by offering small-scale loans, individuals are given a chance to prove their credit-worthiness while the stakes are low. For most MFIs the initial loan (typically less than 100 dollars) is increased after the first repayment. This theoretically allows credit-worthy individuals to drastically improve their circumstances by creating sustainable debt patterns.
However, all of the predicted benefits of microfinance have come under intense scrutiny after recent social and political tension in India has cast doubt on the social mission of MFIs. In Andhra Pradesh, the epicenter of Microfinance in India, 50 farmers are believed to have
committed suicide as a result of harassment from collectors. In November of last year, The New York Times reported that, “India's rapidly growing private microcredit industry faces imminent collapse as almost all borrowers in [Andhra Pradesh] have stopped repaying their loans, egged on by politicians who accuse the industry of earning outsize profits on the backs of the poor” (The New York Times 2010).
Muhammad Yunus wrote his own editorial in The New York Times in January of 2011 accusing MFIs of exploiting the poor and charging outlandish interest rates. He argued that interest rates among MFIs should be capped at the cost of funds (the amount MFIs have to pay to acquire the money they lend out) plus 15 percent (The New York Times 2011). In Andhra
Pradesh the provincial government has already made two important policy changes: first, MFIs cannot charge interest rates above 24 percent and second, MFIs must collect on loans on a monthly, rather than weekly, basis. Although the latter of these two changes will probably have some effect on default rates, the threat to the industry landscape from the interest rate caps seems greater.
Defenders of Microfinance have made the claim that high interest rates are largely explained by the high costs of transporting, delivering and collecting on microloans, while opponents have lambasted the exorbitant profits earned by some of the firms like Mexico’s Compartamos or India’s SKS Microfinance. If the defenders of Microfinance are right then the firms affected most by an interest rate cap would be those that target the poorest and bear higher risks and higher costs.
Obviously, it is important to explain and understand the root causes of high interest rates in the Microfinance industry in order to predict the effects of interest rate caps. In this thesis I will examine the firm-level and macro-level drivers of interest rates and hopefully explain the high costs of small-scale lending.
Using data from Mix Market and the Economist Intelligence Unit, I will investigate how profit-status, operating expenses and other factors change interest rates. Additionally, I will examine which countries’ MFIs charge higher interest rates and try to isolate political and industrial causes for the gap.
I find that the primary driver of interest rates is indeed the cost of delivery. However, in developed Microfinance markets I find that for-profit firms charge 7 percentage points higher interest rates. I also find that regulated firms charge significantly less than their unregulated counterparts. All of this evidence lends some support to government intervention against MFIs, but this thesis does not examine how interest rate caps would affect the availability of capital, which may justify high profits.
Regarding macro conditions, I find that the Economist Intelligence Unit’s measures of conditions for Microfinance success are significant in explaining interest rates. Contrary to expectations, I find that a more effective regulatory environment (according to the Economist’s
standards) increases interest rates, while a more competitive industry drives interest rates down. Investment climate is insignificant in the full sample.
Before discussing my results in more detail I will discuss previous findings in section 3. I will then discuss my own data and how it differs from previous studies in section 4. In section 5 I will discuss my own hypotheses before presenting my regressions in section 6. For now we turn to previous findings on Microfinance.
3 Literature Review
Data constraints have kept the literature on Microfinance relatively homogenous. Many of the studies have used similar if not identical data sources and few have used randomization due to a small number of high quality data points. The most common source for data is Mix Market (www.MixMarket.org), which allows Microfinance Institutions (MFIs) to self-report data on their portfolio, assets, default rates and other financial characteristics. These are later verified using audit reports, interviews and other methods. Another common data source has been the Microbanking Bulletin (MBB), which compiles performance ratios by customer segment and region of operation. Other studies have used data from independent audits, but in the end there is no one preferred data source to discuss the Microfinance industry.
Many scholars have also used case studies as a way to describe the microfinance industry (Mohan and Potnis 2010, Navajas, Conning and Gonzalez-Vega 2003). To some extent the demand for innovation in cost controls has driven this literature, with Mohan and Potnis 2010 focusing on the strategies of SKS Microfinance (the largest firm in India) in reducing the costs of delivery. Although this literature has been useful in publicizing firm techniques and providing anecdotes about the industry, a broader discussion of firm behavior is necessary in this young industry.
There is an ongoing debate in the literature over the appropriate lens with which to judge MFI activity. The mixed mission of the firms in this industry has made traditional economic analysis difficult. Scholars have advocated both a welfarist approach to Microfinance and an institutionalist approach (Aghion and Morduch 2005). The welfarists measure firm success by metrics like poverty reduction and credit penetration (e.g. Gutierrez-Nieto, Serrano-Cinca and Mar Molinero 2009, Hartarska and Nadolnyak 2008), while the institutionalists evaluate firms based on sustainability and profitability (e.g. Nawaz 2010, Cull, Demirguc-Kunt and Morduch 2008). Most recent studies have attempted to address both schools of thought and present results in light of both financial and welfare outcomes.
The first major international survey of Microfinance firms was done using data from Mix Market and investigated 124 MFIs in 49 countries (Cull, Demirguc-Kunt and Morduch 2006). The study examined three fundamental questions: ‘do increased interest rates have a detrimental effect on portfolio quality?’, ‘has profit seeking limited the depth of outreach?’, and ‘has mission drift occurred?’. These questions have since made up the dominant discourse in Microfinance.
Cull et al. 2006 found that individual lenders—those lenders who do not lend money using a group-collateral scheme—are more profitable with higher interest rates. The evidence indicated that profits will increase for individual lenders up to an interest rate of around 60%, providing some insight into problems with MFI incentives. However, the reverse is true of solidarity lenders, like Grameen bank. MFIs lending to groups typically saw a reduction in profits when interest rates increased. Other studies have also concluded that group lending is preferred for social objectives since it leads to better outreach (Mersland and Strom 2009).
Mission drift is another way of characterizing the concern over social objectives for MFIs. The traditional proxy for mission drift has been loan size, since larger loans are only given to
those customers with stronger financial backgrounds. Some alternative metrics proposed include portion of women targeted (many MFIs lend primarily to women because they are perceived as more likely to use the money for household benefit than men) and profit per borrower.
Mersland and Strom 2010 was the most recent study on mission drift. They examined 379 MFIs in 74 countries using data collected by third party auditors. They found no significant evidence of mission drift and found that although firms saw higher profits with higher loan size, MFIs had increasing cost efficiency over time. This allowed them to continue to target poor customers. Thus the cost-benefits of scaling allowed MFIs to stay on track, serving mostly poor customers rather than targeting wealthier clients.
Other authors have focused on how well MFIs allocate their resources in accomplishing their objectives. This approach has been dubbed social efficiency in the literature and some studies have sought to understand the relationship between social efficiency and financial efficiency.
Gutierrez-Nieto et al. 2009 examined data from Mix Market and found that social efficiency hinged on financial efficiency, meaning that although some firms who were financially
successful (i.e. sustainable and profitable) were not socially efficient, firms that were socially efficient were necessarily financially efficient. They also conducted tests on regional
characteristics and found that Asian firms were more socially efficient than their counterparts, Eastern European firms were the most profitable, and Latin American Firms were more financially efficient.
Several recent studies have examined interest rates and costs as the dependent variable for a variety of regressions. The most important of these is Hartarska, Caudill and Gropper 2009. Literature has long been in support of the fact that MFIs become more efficient over time
(Mohan and Potnis 2010, Chaves and Gonzalez-Vega 1996), but it has been unclear whether all MFIs witnessed decreasing costs, or whether certain firms were better at adapting as they expanded and developed.
Hartarska et al. 2009 used data from the MBB to discuss MFIs in Eastern Europe and Central Asia. The study found that the primary determinant of decreasing costs over time was whether firms were making use of a deposit system as a means to transition away from
subsidized funds. They also found that firms with greater total assets saw decreasing costs, which indicates benefits to scaling. The study did not examine profitability or the interest rates that customers were charged, so although it sheds some light on the supply-side of the debate, it does not describe whether these benefits translate into lower prices for customers.
The data that Hartarska et al. made use of was also limited fairly severely. The study did not include many regions with developed Microfinance industries (i.e. South Asia, and Latin
America.), but they did find a substantial difference between firms in Central Asia and those in Europe with no macro-level explanation (GNP fluctuations for example) for why this was the case.
A more recent working paper on the role of subsidies in MFI sustainability has also found some interesting results. Nawaz 2010 used Mix Market audit reports and selected data points based off of clarity. This paper is one of the first to focus more intensely on interest rates, although the study primarily dealt with sustainability.
The summary statistics found that the average cost of funds in 2005 and 2006 was 7.3%, while the interest rate charged to borrowers was an average of 30.6%. On its face, the gap appears extreme (more so for Western consumers used to develop banking markets). Nawaz worked to explain this gap by regressing interest rates on a variety of dependent variables, which
yielded some interesting results. As would be expected from Hartarska et al. 2009,
savings/deposits programs led to lower interest rates, while higher costs of delivery and smaller loans increased rates. He did not test on profit-status.
Nawaz 2010 also examined firms by region, which included Africa; East Asia and the Pacific; Eastern Europe and Central Asia; Middle East and North Africa; Latin America and the Caribbean; South Asia. Only Africa was shown to have significantly higher interest rates since the study lacked the desired diversity for significant results at the regional level.
One important gap in the literature is a developed discussion on the role of government regulation in Microfinance. Some have discussed the possibility that government regulation would be overly burdensome for firms and would increase their costs unnecessarily, since, for example, roughly 13 percent of American banks’ non-interest expense is from meeting
regulatory guidelines (Cull, Demirguc-Kunt and Morduch 2009), but little work has been done to quantify these effects for actual MFIs.
Cull et al. 2009 and others (Hartarska and Nadolnyak 2007, Hartarska 2005) have found minimal impact from external regulation on firm profit or behavior. One of the biggest problems with understanding regulation is the heterogeneity within MFIs (Hardy, Holden, and Prokopenko 2003). Some are more similar to mainstream banking institutions, while others are smaller and depend on alternative sources of funding. This has made a simple recommendation on
government involvement impossible.
However, one central claim that has been supported in the literature is that regulation is good because it is a necessary step towards MFIs incorporating a savings component in their services, which has been shown to decrease dependence on subsidies and decrease the firms cost of funds.
Another realm where there is a surprising lack of evidence is in profit-status. No evidence has been found to indicate that for-profit firms have better performance in general (Tchakoute-Tchigoua 2010, Mersland and Strom 2010), despite a priori claims that shareholders will induce more efficiency.
Unfortunately, these studies have not dealt with country interactions for the different styles of firms. Since the institutional environment for non-profits and for-profit firms, as well as for banks and NGOs, varies so drastically by country and region, it is surprising that no work has been done comparing firms with different legal statuses in one region with another region. This is a substantial gap in the literature as it stands right now.
Another question that has been largely ignored in the literature is whether there is a substantial gap between firm performance (social or financial) across countries. It is currently assumed that regional indicators have valuable explanatory power. It is taken for granted that MFIs in South Asia are substantially different from those in Central Asia and That Latin American MFIs are substantially different from Eastern European MFIs. This is problematic since there is such wide variation within regions in terms of private investment, governance and firm experience. The assumption that regional variables are the best way to evaluate firms is unsupported except in light of data limitations.
The inability to compare Microfinance across countries has substantially weakened the literature on this topic. Because of this gap scholars are unable to compare profit-status across countries, compare social and financial efficiency in competitive countries or disaggregate macro-level drivers of firm performance. The primary justification given for this gap has been the quality of information available on firms, but no discussion on the tradeoff between randomization and the high standard for data has taken place. The studies that have examined
microfinance have not been useful for generalization and have only described the largest and most developed firms.
We turn now to my own data set which includes hundreds of MFIs from all over the world.
4 Data
4.1 Firm Data
The data I used were taken from Mix Market (www.mixmarket.org), a microfinance data aggregator, which has been gathering data since 1995. The data set has detailed information on 1025 MFIs from 2009. These firms may not be representative of all MFIs, since those that choose to report are probably in later stages of development and are larger firms, since publishing information on Mix Market is a means to attract capital investment for firms demonstrating success. However, these limitations may be beneficial since the firms in the sample represent developed and experienced MFIs, who will be beyond the initial stages where heavy capital investment may skew firm characteristics.
The data set provides information on a wide variety of firm and country characteristics. There is copious accounting information on operating expenses, interest rates charged and financial expenses as well as information on portfolio quality, target customers, firm age, legal status, country of operation and average loan size. Because I ultimately wanted to run regressions on many different firm characteristics, I limited my data set to the 943 firms who reported on every variable in my model. Many firms did not report on regulated status or their operating expenses eliminating 60 firms. The remainder lacked detailed data on interest rates and cost of funds, which was obviously necessary to my regressions.
Since my thesis is focused on interest rates as a dependent variable we turn now to these variables for the 943 firms in my final data set.
Table 1 summarizes the relevant variables for interest rates. Here yield is found by taking the financial revenue and dividing it by the gross loan portfolio, while cost of funds is found by using financial expenses divided by the gross loan portfolio.
The typical real yield for an MFI is 24.81 percent, while the typical cost of funds is only 6.97 percent. There is a substantial premium here, with a mean of 17.84 percentage points. Since these are yields, rather than actual interest rates, they may be affected by default rates, but, as is shown in Table 2, all measures of repayment show extremely low attrition, with the mean write-off ratio at just 2.4 percent, suggesting that the yields above are close proxies for actual interest rates charged. This premium justifies concern over the motivations of MFIs, since it is drastically greater than the cost of funds and marginally above Professor Yunus’ suggested cap of 15
percentage points after controlling for inflation (before accounting for inflation, which Yunus does not suggest, the gap is 24 percentage points). As there is little indication that the high interest rates are driven by portfolio risk it seems important to ask where these rates come from.
Other firm characteristics are summarized in Table 3. The firms in the data set represent many different stages of development and types of behavior. The mean firm is just over 14 years old, which may overstate the experience of the firms in the data set since there are several very old firms. There is a broad spread for average loan size and it may be possible that the firms in the data set have missions that extend beyond microfinance, since they are giving out such large loans. However, the mean loan is still extremely small, only 2/3 of the GNI per capita. It is also important to note that the gross loan portfolio of MFIs also runs a very broad spectrum, and the mean portfolio is 45 million dollars, lent to roughly 90 thousand customers.
The last element worth mentioning is the portion of women borrowers. As would be expected from the literature a high proportion of loans are given to women, with around 60
percent of all loans in the data set going to women. None of the firm characteristics are drastically different from the summary statistics presented previously in the literature.
4.2 Categorical Variables
I turn now to the categorical variables in the dataset. These include region, legal status, country of operation, profit status, savings services and regulated status. The distribution of the more relevant variables can be seen in Table 4, Table 5 and Table 6. Region reflects the balance of microfinance in the world, therefore Latin America is a huge component of the sample; Asia has a strong presence with both South and Central Asia representing more than 15% of the data set.
Legal status is another important variable, but it is clearly dominated by NGOs and NBFIs, which together make up more than 2/3 of the sample. Credit unions are another 15% with banks and rural banks making up the smallest shares. Finding significant results for legal status could be made difficult by the small number of rural banks and banks.
There are 95 countries in the sample, some with as few as one observation (Central African Republic), and one with 85 (India). This is probably biased towards those countries with better reporting norms and therefore with more developed microfinance markets. Mexico and India are both major players in Microfinance and together make up more than 13% of the sample.
Profit status, regulated status, savings services and women are all binary variables, where savings is 1 if the MFI offers traditional savings accounts and women is 1 if the MFI serves only women. Roughly 40 percent of the firms in the sample are classified as for-profit and just over half are regulated. 55% of firms offer savings services and 10% of firms serve exclusively women. There is wide variation within these categorical variables, which will hopefully be useful in shedding light on interest rate premiums.
4.3 Macro data
The last group of variables I will be making use of are macro level variables used by The Economist Intelligence Unit (EIU) to evaluate the market for microfinance in various countries. The EIU only provided information on 54 countries in 2009, but after inputting the data I am still left with 800 observations. The EIU uses three metrics to evaluate microfinance, which are regulatory environment, institutional development and investment climate. The results for these variables are presented in Table 7.
The data organizers consider the first two variables to be the most important and weight them at 40% each for the overall rankings, with the final 20% determined by investment climate. One reason given for this is the limited variation in investment climate which is shown in the low standard deviation. Investment climate is a reflection of inflation, political stability and the corruption within the legal system, but most MFIs operate in countries that are relatively
unstable. For this reason, there is little reason to believe that investment climate will play a major role in the final analysis for interest rates.
Regulatory environment is defined primarily by two components, the first being the hurdles in place barring MFIs from establishing their business and the second being government
oversight, more particularly whether there is a governing body dedicated to the microfinance industry. The mean regulatory environment is just over 60, with many firms above and below. The EIU uses four questions to determine their rating.
The first question is, “are regulations conducive to microcredit provision by banks and other established financial institutions?” The second is, “are regulations conducive to the formation and operation of “specialized MFIs,” such as Greenfield MFIs and up scaling NGOs
formation and operations of microcredit operations by non-governmental organizations (NGOs)?” And finally, “Do regulatory institutions possess a specialized capacity for the examination and regulation of microcredit?”
Each country is ranked out of five for each question and given a total rating. A mean of 60 indicates that the countries in the sample tend to have some formal regulation and established avenues for MFIs to work through, but also suggests that there is room for improvement for the countries in the sample (the highest scores are in the 80s, so no country is near-perfect).
Obviously, the EIU’s questions leave room for subjectivity, and the phrasing of the
questions may provide evidence that the EIU is somewhat biased. For example, within the first question one of their considerations is how flexible regulations regarding interest rates are. The more discretion a bank has, the better the score. This thesis is attempting to examine whether interest regulation is justified, but the EIU has already concluded it is bad. These biases will come through in the final model (see sections 6.4 and 6.5) and provide some interesting insights about the EIU’s measurements.
Institutional development focuses primarily on the level of competition, as measured by the Herfindahl index as well as the range of services offered by MFIs. The mean is 47. The EIU uses three questions to measure institutional development, “Do MFIs offer a wide range of financial services to low-income populations in addition to microcredit?”, “Are there effective, reliable credit bureaus?” and “How competitive is the MFI sector? Do micro-borrowers have a wide range of institutions from which to choose?”
These questions describe the competitive environment for firms, but may be problematic because of the infancy of Microfinance. In most countries Microfinance markets are nowhere near saturated, so relying on measures like the HHI may not accurately reflect industrial
conditions. In India for example half of all microloans are given out in Andhra Pradesh, so firms in that area may compete to drive down interest rates, while firms in other areas are less affected.
Despite the limitations of the Economist Intelligence Unit’s measures, it provides several unique advantages. First of all, the macro variables are uniquely tailored to MFIs, making them preferable to generic macro considerations and secondly, the measures will allow me to separate country-effects into very specific components. By examining the EIU’s measures and comparing them to evidence regarding the international gap, I should be able to separate out the most important macro variables.
Before examining the regression results, I will discuss my hypotheses in more detail.
5 Hypotheses
Interest rates are the product of a wide variety of characteristics including cost of funds, operating expenses, portfolio risk, firm experience and government oversight. In my regressions I will investigate these relationships, but before turning to my results I would like to discuss my hypotheses, which are a joint product of the literature’s suggestions and my own intuitions regarding Microfinance.
The first and most important variable in understanding interest rates is the cost of funds. In Microfinance this variable is particularly interesting since so many MFIs receive government subsidies. Some firms in fact have a negative cost of funds (though barely) suggesting that the government is providing free money to several of these institutions.
In these situations, an important question is whether subsidies that decrease the cost of funds decrease the cost borne by customers. If the coefficient on cost of funds is close to one, then it suggests that firms do transfer the benefits of subsidies to customers. This is the outcome I expect since most MFIs compete with other subsidized firms. If this were not the case then
subsidized firms could charge a relatively higher interest rate while still undercutting mainstream finance (and informal markets). If the coefficient on cost of funds is greater than one then it suggests that firms transfer these costs onto the end customer rather than bearing them on their own.
Another key variable is operating expense divided by gross loan portfolio. Most of the literature agrees that one of the primary drivers of interest rates is the high cost of delivery in the world of microfinance. As operating expenses increase relative to the loan portfolio, we would expect interest rates to increase. One important component to understanding operating costs is the experience of firms. The literature has demonstrated that older firms witness decreasing costs, so although older firms probably charge lower interest rates, it is largely explained by increasing efficiencies over times. Thus the expected coefficient for operating expenses is large and positive, but age is likely to be insignificant.
There are also several variables that describe firm mission and have been used widely in the literature. The first of these is average loan size, either in dollars or in terms of GNI per capita. The expectation is that as loan sizes decrease, it reflects a deliberate effort to target poorer customers who are higher risk, more expensive to provide funds to and may require more oversight to manage payments. All of these suggest a negative coefficient, which means that as loans increase in size, firms charge lower interest rates. This is broadly supported in the
literature.
A second variable reflecting mission is the portion of women borrowers. This is a less direct proxy for mission, but there is a large amount of evidence supporting the hypothesis that firms that target women tend to charge higher interest rates. This is in spite of the fact that women are targeted because they are seen as more reliable and also more likely to use the money to benefit
their households. The expected coefficient is positive, meaning the higher proportion of women a firm lends to the higher I expect their interest rates to be mostly because these firms have more of a social mission.
One final variable reflecting mission is profit-status. It seems obvious that profit-status should be correlated with higher interest rates, which some firms have made explicit. SKS Microfinance, for example, adds a constant 2 percent to their interest rates, which is their profit margin. However, the literature has found next to no evidence of profit-status changing interest rates. Because my data is from the same source as much of the literature on profit-status I hesitate to predict a significant result, but perhaps in more developed markets profit-status will have larger effects (see sections 6.3 and 6.4).
Regulation is another variable I will be examining, and the literature has found that regulated firms are likely to have lower costs of funds as a result of savings services they are required to offer, but it is unclear whether they will charge lower interest rates. I predict that regulated status will have a negative coefficient, partially because of services offered and partially because it may reflect direct limitations. Regulated firms are sometimes required to charge lower interest rates in order to receive subsidized funds. Additionally, firms that seek regulation are likely NGOs with social missions, since regulation is frequently perceived as a hindrance to shareholder interests.
A savings dummy is included primarily because of recent findings suggesting that firms that offer savings services bear lower costs of funds. It is unclear whether firms will transfer
additional benefits to customers, but it will be interesting to see whether there are other benefits from offering savings accounts, possibly as a result of better community relationships.
One variable that the literature has found little evidence on, but that I will continue to investigate is legal status. The primary difference between legal statuses is in their cost of funds, since traditional banks can raise funds through savings accounts and most NBFIs rely on external sources of funding. However, I do expect to find effects resulting from mission differences in legal status. Since both credit unions and rural banks are formed by community members and frequently are owned by the community I expect them to charge lower interest rates, while banks, NBFIs and NGOs will all be relatively similar.
In later models I will look at country dummies, which is novel in this field. Unfortunately, because of its novelty little work has been done to suggest what coefficients to expect. I do, however, have the EIU data set to use. One would predict that a higher ranked country on the Economist’s scale would have lower interest rates, because of better oversight, rule of law and because of higher competition.
With these hypotheses in mind, we turn to our regression models and investigate these hypotheses in more detail.
6 Results
6.1 The ordinary model
As an initial diagnostic the first regression I conducted is a replication of the models suggested in the literature. This model was specified as follows:
Real InterestRateij = α + β1 loansize/GNIcapitaij + β2 OperatingExpense/GLPij +
β3 Genderij + β4Ageij + β5 Inflationij + β6 CostofFundsij + β7LegalStatusij +
β8Regionij + β9Savingsij + β10Regulatedij + β11ProfitStatusij + εi Results from this specification are shown in Error! Reference source not found.Error! Reference source not found..
The results are largely consistent with previous findings. Age is insignificant when operating expense is accounted for. Cost of funds has a roughly one-to-one relationship with yield. Operating expense, as measured by cost per dollar lent, is highly significant and indicates that as costs rise, interest rates increase as well.
Additionally, both of the variables reflecting MFI mission were significant. Average loan size / GNI per capita is significant and demonstrates that as the size of loans increases, the interest rate falls. Similarly, as the portion of women borrowers increases, the interest rate increases. Both of these factors are likely explained by the firms’ missions. Those that target women and offer smaller loans bear higher costs and risks, since they target the ultra-poor.
Regulation is significant. Firms that are regulated charge interest rates 2 percentage points lower than their unregulated brethren. However, the offer of savings services is
insignificant. This is probably due to the fact that savings services decrease the cost of funds, but do not have effects on the actual premium charged by MFIs. Interestingly, the legal status of firms is significant, with banks, rural banks and credit unions charging lower interest rates than NBFIs. Clearly this is not simply a product of differences in the cost of funds, but shows that the firms with different legal statuses have different lending models.
Region also provides little insight into the interest rate premium. Only South Asia is demonstrably different from Latin America and the Caribbean. The difference is substantial at 17 percentage points, suggesting the importance of regional effects. As we will see later, this gap is largely explained by Indian MFIs who charge significantly lower interest rates than firms in other countries. These results are different from the most recent literature, but probably stem from the data sets’ larger number of firms in South Asia.
Importantly, this model explains 60 percent of the variation in interest rates. Some of the most important lessons from this model are that operating expense and loan size explain huge portions of the variation in interest rates, while profit status seems to play no role. If this is the case then interest rate caps would be more likely to affect MFIs with a social mission, rather than for-profit firms. This is a strong model and provides substantial information, but obviously has some room for improvement.
6.2 Interacting Region with Legal Status
It has been suggested in the literature that the interaction of country dummies with legal status dummies would be ideal since it would yield the unique returns to different countries based on firm type. However, the data sets that have been used have not had the size necessary to search for these effects. The large numbers of constraints that will be placed on the data are obviously an issue, and even within my data set I would be unable to find unique country effects, because there are an inadequate number of diverse data points for both country and legal status. However, one precursor to country dummies would be the use of region as a proxy for this interaction. Thus I conducted a regression with the following specification:
Real InterestRateij = α + β1 loansize/GNIcapitaij + β2 OperatingExpense/GLPij +
β3 Genderij + β4Ageij + β5 Inflationij + β6 CostofFundsij + β7LegalStatusij +
β8Regionij + β9LegalStatus*Regionij + β10Savingsij + β11Regulatedij +
β12ProfitStatusij + εi
The results for this model are shown in Table 11Error! Reference source not found.Error! Reference source not found..
Most of the variables are unaffected by the new specification except that both regulation and average loan size now have greater effects. Banks, credit unions and NGOs all exhibit
significantly lower interest rates than NBFIs, charging 7, 9 and 4 percentage points less
respectively. Additionally Africa now has substantially lower interest rates than Latin America, suggesting that the interaction between legal status and region is important for specifying the returns for region.
The results for the interactions themselves were interesting. In all cases NBFIs and Latin America are omitted, so the coefficient compares firms from different regions with those firms of identical legal status in Latin America. Since rural banks and banks are the least prevalent forms for MFIs, they are the most likely to have issues with the number of constraints applied in this model.
Banks are only significant in Africa, charging 13 percentage points higher interest rates. Credit unions are significant for Africa and Eastern Europe and Central Asia. Surprisingly the coefficient for Africa is positive, suggesting that NBFIs in that region charge particularly low interest rates. Credit unions in Eastern Europe and Central Asia do charge lower interest rates as would be expected. NGO is the only other variable with significant results. Both South Asian and African NGOs charge higher interest rates than their Latin American counterparts, which is interesting because the original model suggested a negative coefficient.
Overall, these results suggest that some effect from legal status is at least region specific. One would expect that the effect from these coefficients would be more meaningful if the individual countries were used as indicators instead of region. However, even using region, collinearity is a substantial issue, as shown by the number of omitted coefficients. It is also important to note that the explanatory gains from this interaction were minimal (the r-squared increased just 2 percent). Considering the number of constraints it is questionable whether the explanatory gains are worth the large quantity of restrictions.
The first way to investigate whether this model is useful is to check the adjusted r-squared. According to this measure the inclusion of interaction dummies is beneficial, since the adjusted r-squared still increased. The Akaike information criterion also supports the second model with a lower value (7328) than the original model (7340). However the Bayesian information criterion rejects the latter specification. Since the BIC incurs a higher penalty for additional parameters, the inclusion of the interaction term depends on a tester’s preferences. The explanatory benefits may be worth the data constraints since it clearly affects the original
coefficients on region and on legal status.
6.3 Replacing Region with Countries
Since my data set is so large, one important opportunity afforded to me is the ability to replace regional indicators with country specific indicators. However, since many of the
countries in the data set are underrepresented (with a small number of observations), I decided to limit my data set to those countries which made up over 2% of the sample (roughly 20
observations minimum). This left me with 412 complete observations, which is still a substantial data set.
The summary statistics for this sample are given in Table 8 and Table 9. The means for firm traits are similar except for age and other factors associated with older firms. However, even these older firms charge similar premiums over the cost of funds. The differences in firm
characteristics are probably explained in large part by the higher value on institutional development.
This data set represents a group about one standard deviation above the original mean for institutional development. For this reason the results may be slightly biased towards larger, more developed microfinance markets. However, these firm characteristics represent a probable future
for emerging markets and thus are useful for examining the international scene right now. The results using the same specification as in section 6.1, but with region replaced by county dummies, are given in Table 12.
This model explains roughly 75% of the variation in the interest rate. The most important results from this model are the country dummies. India is the omitted country and it is obvious that Indian MFIs have substantially lower interest rates than the other countries in the sample. The country with the largest gap is Tajikistan, whose firms charge 35 percentage points more than Indian firms. This gap is obviously quite large and several other countries (Bolivia, Mexico, Nicaragua, Peru and the Philippines) have differences greater than 20 percentage points. These results are especially interesting considering the media frenzy over microfinance in India. Since the gap is so large between countries it will be important to try to understand the root causes of the different interest rates. We will turn to this in section 6.4.
This model also sees some important changes for the other variables. First of all, age is now significant, but the size of the coefficient is still quite small. Average loan size is now highly specified and the coefficient is five times larger. The portion of women borrowers is no longer significant however, which is especially interesting. This is probably because some countries focus much more heavily on women and the effect is captured in the country dummies.
Profit status and regulated status are both significant and very highly specified. Firms that are for-profit charge 7 percentage points higher interest rates, while regulated firms charge 6 percentage points less. Previous studies had found little evidence of effects from profit-status, but these results are in line with mainstream concerns over the social mission of for-profit firms. The best explanation for this change is that in less developed markets profit-status has no definite relationship with interest rates, but in developed markets like India, profit-status has a huge
effect on interest rates. This lends credence to those who support interest rate caps, since comparable firms charge much higher interest rates to their customers in the interest of profit.
The model also suggests that regulation has been successful. Whether the lower interest rates are attributable to structural differences in regulated firms (i.e. additional services they are required to offer, or reporting requirements for subsidized loans), or because firms that choose regulation have more of a social mission is unclear.
With regards to legal status, only rural banks now have significantly different interest rates from NBFIs. The difference is quite large at 12 percentage points. However, as has been
suggested previously in the literature, the differences in legal status across countries may be preventing significant results.
6.4 Replacing Country with Macro indicators
The size of the international gap begs the question of whether the country dummies can be replaced with more meaningful macro level characteristics, which may allow us to disentangle the various drivers of this gap. For this reason, I substituted the macro indicators from the EIU, for the country dummies with the limited data set. The final model was specified as follows:
Real InterestRateij = α + β1 loansize/GNIcapitaij + β2 OperatingExpense/GLPij +
β3 Genderij + β4Ageij + β5 Inflationij + β6 CostofFundsij + β7LegalStatusij +
β8LegalStatus*Regionij + β9Savingsij + β10Regulatedij + β11ProfitStatusij +
β12RegulatoryEnvironmentij + β13Investment Climateij +
β10InstitutionalDevelopmentij + εi
The results for this specification are shown in Table 13.
One would expect that the coefficients on the three variables would be negative, indicating that as those components improve, firms will charge a smaller premium to their clients, however
this is not the case. Regulatory environment and investment climate both have positive and significant coefficients.
This means that as countries improve on the EIU’s rankings for regulatory framework and investment climate, interest rates tend to rise. This may be best explained by the philosophical leanings of the Economist, which favors market-driven competition, and emphasizes a lack of road-blocks for firm entry. To contextualize the impact, if one were to “improve” one standard deviation in regulatory environment, one would expect interest rates to increase by 7.3
percentage points. For investment climate the effect is smaller (a similar move gives a roughly 1 percentage point increase), but still significant.
Institutional development has the expected negative sign, and since this variable measures competition and services offered, it makes sense that it would drive interest rates down.
Competition in particular should prevent MFIs from seeking premiums common among informal moneylenders. If a country improves one standard deviation on this measure, interest rates would be expected to fall 7.85 percentage points.
For the most part the other coefficients are consistent with the model used in section 6.3. However, one intriguing result is the coefficient on the portion of women borrowers. The coefficient is negative and significant, which contradicts both the literature and the earlier models I used. This is explained by a negative correlation between regulatory environment and the portion of women borrowers. This means that countries with less burdensome structures for MFIs charge both higher interest rates and are less likely to lend to women. This is doubly troublesome from a welfarist standpoint.
These macroeconomic factors are very important to understanding the international gap. The r-squared of this model is .68, which shows that we lost some explanatory power from the
country dummies, but still substantially improved the original model. However, these results may be skewed, since, as I indicated, the typical firm is already one standard deviation higher on institutional development than the complete dataset. For that reason robustness checks are necessary.
6.5 Robustness
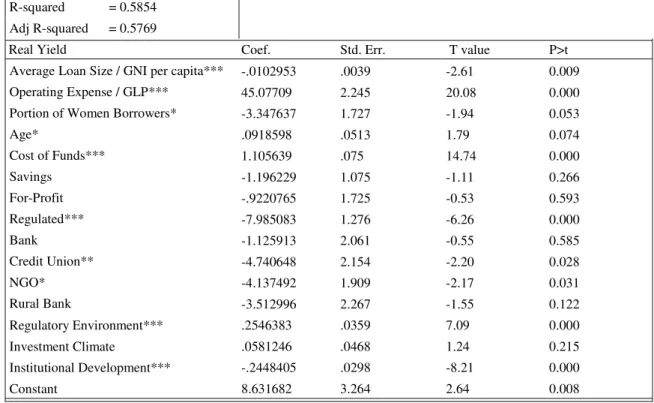
Since the results above were drastically different than the expected results, I wanted to use the full sample as a robustness check for my results. Table 14 shows the results of a regression using the same specification as above, but with the full 745 data points for which the EIU provided information.
The coefficients on all three macro variables were reduced substantially. Investment climate is no longer significant, while both regulatory environment and institutional development are both smaller and less well specified, though still highly significant. The impact from a one standard deviation move in regulatory environment or institutional development is now 4.16 and -4.83 respectively. These effects are still very large changes.
The rest of the model fits closely with the one specified in section 6.4. The coefficient on portion of women borrowers is still negative, so it was not just a result of the smaller data set (although it is now less accurately specified). The r-squared for this model is .5854, which is very close to the model specified in section 6.1. The inclusion of these macro variables has as much of an explanatory role as region does. Since the variables I used are obviously an incomplete image of a country’s macro environment it may be useful to include additional factors, perhaps relating to the development of mainstream credit markets or cultural factors that may affect general lending tendencies (i.e. highly Muslim or Buddhist countries may exhibit lower interest rates due to different traditions regarding interest).
Overall the model provides a meaningful framework for understanding interest rates. The use of the limited sample in section 6.4 may be preferable in certain senses, because it shows that competition and regulatory environment play more important roles in the countries that have more developed Microfinance markets (i.e. the higher you are on institutional development, the greater the effect of a change in the other macro variables).
One important test that could be conducted in the future would be panel data tracking EIU and firm factors over time. Because the EIU has not been publishing their microscope for very long, and because the countries included in their rankings has expanded I decided against this, but as the information develops over time it may be possible to suggest policy based on the findings. From these results, interestingly, if a governing body is concerned with the interest rate premium charged to customers then it seems that being “stronger” in the eyes of the Economist may be a hindrance.
7
Conclusion
My regressions support several important hypotheses about the Microfinance industry. First of all, interest rates in developing markets are explained by operating expenses, but not by firm profit-status. However, in developed markets profit status increases the interest rates charged to end customers substantially. An increase of 7 percentage points for for-profit firms is huge when the expected interest rate premium is 18 percentage points.
Additionally, I am able to say with confidence that government impediments to MFI formation and also government constraints on what interest rates a firm can charge are very important to understanding the international gap in interest rates. Investment climate is important in some developed markets, but insignificant in the larger data set.
Probably most importantly, interest rates are driven significantly down by competition. Measures of industrial development indicate that as markets develop interest rates will fall. This leaves open-ended the question about whether interest rate caps are necessary or justified.
In the first case, it is clear that for-profit firms in developed markets charge much higher rates than their non-profit counterparts, but if this is the case then they are likely not in direct competition with each other, since individuals would choose the lower cost loans. High profits may be justified in attracting capital into this industry since profitable Microfinance is so clearly preferable to informal money lending.
Future research on MFIs, particularly research making use of panel data, will be able to answer these questions more effectively than I have here, but this thesis helps to shed some light on the primary problems facing Microfinance today. The implementation of interest rate caps in Andhra Pradesh will allow other governments to see what happens when these caps are put in place and which MFIs are ultimately affected.
8
Tables
Table 1: Interest Rates for MFIs
Variable Mean Std. Dev. Min Max
Yield 30.62 18.37 0 252.32
Cost of Funds 6.97 6.325 -.14 118.44
Real Yield (Yield – Inflation) 24.81 18.36 -13.26 238.72
Premium (Real Yield – Cost of Funds) 17.84 17.37 -29.41 128.67
Table 2: Portfolio Quality Indicators
Variable Mean Std. Dev. Min Max
Portfolio at Risk >30 days .083 .11 0 1
Table 3: Firm Characteristics
Variable Mean Std. Dev. Min Max
Age 14.50 10.36 0 109.9
Operating Expense / GLP .254 .22 .01 1.97
Net Income 807582.9 7569132 -111 Million 110 Million
Average Loan Size (Dollars) 1410.38 3068.83 9.1 64087.2
Average Loan Size (GNI/Capita) 61.45 120.72 .9 1915.4
Return on Assets .26 10.12 -68.24 61.93
Return on Equity -.36 48.60 -398.91 147.03
Gross Loan Portfolio 43 Million 170 Million 18093.8 3.5 Billion
Cost per Borrower 219.1923 387.98 0 6258
Borrowers per Staff 129.25 110.83 2 1388
Total Women Borrowers 70146.06 413713.5 0 622597
Number of Active Borrowers 91471.75 485802.1 16 7543960
Portion of Women Borrowers
.60 .313 0 7536960
Table 4: Firms by Region
Region Freq. Percent
Africa 116 12.29
East Asia and the Pacific 101 10.70
Eastern Europe and Central Asia 189 20.02
Latin America and the Caribbean 328 34.75
Middle East and North Africa 44 4.66
Table 5: Firms by Legal Status
Legal Freq. Percent
Bank 71 7.52
Credit Union 135 14.30
NBFI 341 36.12
NGO 349 36.97
Rural Bank 48 5.08
Table 6: Dummy Variables
Variable Mean Std. Dev.
Profit Status .398 .489
Regulated .534 .499
Savings .547 .498
Table 7: Macro Variables
Variable Mean Std. Dev. Min Max
Regulatory Environment 60.92 16.27 25 87.5 Investment Climate 45.09 10.81 20.8 73.3 Institutional Development 46.95 19.75 8.3 75
Table 8: Firm Data on Limited Data Set
Variable Mean Std. Dev. Min Max
Real Yield 24.14 18.29 -8.59 128.67 Cost of Funds 6.58 3.92 0 32.93475 Real Premium 17.56 18.22 -18.81 128.6665 Write-off Ratio .0230 .047 0 .56 Age 16.86 12.27 -.75 60.312 Operating Expense / GLP 24.38 21.14 1.16 129.63
Net Income 1153056 9323719 -110 Million 110 Million
Gross Loan Portfolio 48 Million 158 Million 18093.8 230 Million
Average Loan Size (Dollars) 945.4218 1164.809 9.1 9261.1
Average Loan Size / GNI per capita 40.037 62.44291 .9 550.3
Number of Borrowers 144,782 613638.8 16 6400000
Portion of Women Borrowers .602 .336 0 1
Total Women Borrowers 133,773.6 610029.1 0 6200000
Cost per Borrower 154.89 163.75 3 1173
Profit Status .399 .49 0 1
Regulated .486 .500 0 1
Table 9: Macro variables for limited data set
Variable Mean Std. Dev. Min Max
Regulatory Environment 67.33265 12.78091 43.8 87.5
Investment Climate 48.32517 9.260968 27.5 57.5
Table 10: The Original Model1
Number of obs = 943 R-squared = 0.5989 Adj R-squared = 0.5916
Real Yield Coef. Std. Err. T P>t
Average Loan Size / GNI per capita*** -.0095 .0036 -2.67 0.008 Operating Expense / GLP*** 41.95 1.986 21.12 0.000 Portion of Women Borrowers*** 5.436 1.571 3.46 0.001
Age* .071 .0427 1.65 0.099 Cost of Funds*** .998 .0634 15.75 0.000 Savings -.094 1.019 -.09 0.927 For-Profit 1.383 1.442 .96 0.338 Regulated** -2.024 1.021 -1.98 0.048 Bank*** -5.37 1.78 -3.02 0.003 Credit Union*** -8.4 1.69 -4.97 0.000 NGO -1.856 1.549 -1.20 0.231 Rural Bank** -5.71 2.37 -2.41 0.016 Africa -1.46 1.460 -1.00 0.319
East Asia and the Pacific 2.156 1.706 -1.26 0.207 Eastern Europe and Central Asia 1.468 1.235 1.19 0.235 Middle East and North Africa -1.69 1.944 -.87 0.383
South Asia*** -17.41 1.291 -13.49 0.000
Constant*** 9.52 2.079 4.58 0.000
1
Table 11: Interacting Region with Legal Status
Number of obs = 943 R-squared = 0.6171 Adj R-squared = 0.6032
Real Yield Coef. Std. Err. T P>t
Average Loan Size / GNI per capita*** -.0100047 .0036 -2.76 0.006 Operating Expense / GLP*** 41.37204 1.979 20.90 0.000 Portion of Women Borrowers*** 6.057095 1.579 3.85 0.000
Age .0549582 .043 1.28 0.201 Cost of Funds*** 1.028522 .063 16.22 0.000 Savings .4263191 1.107 0.38 0.700 For-Profit 2.315331 1.498 1.54 0.122 Regulated*** -3.106347 1.056 -2.94 0.003 Bank*** -7.10216 2.673 -2.66 0.008 Credit Union** -8.985174 2.432 -3.69 0.000 NGO* -4.055475 2.097 -1.94 0.053 Rural Bank -7.064287 4.977 -1.42 0.156 Africa*** -7.928278 2.327 -3.41 0.001
East Asia and the Pacific -1.059899 3.183 -.33 0.739 Eastern Europe and Central Asia 2.737762 1.792 1.53 0.127 Middle East and North Africa -2.167602 4.448 -0.49 0.626
South Asia*** -21.54792 1.889 -11.41 0.000
Bank in Africa*** 13.0987 4.960 2.64 0.008
Bank in East Asia and the Pacific 7.726873 7.818 0.99 0.323 Bank in Eastern Europe and Central Asia -3.421097 3.747 -0.91 0.361 Bank in Middle East and North Africa -6.270341 12.657 -0.50 0.620
Bank in South Asia 5.903976 5.5860 1.06 0.291
Credit Union in Africa*** 11.79129 3.553 3.32 0.001 Credit Union in East Asia and the Pacific -1.844081 8.975 -0.21 0.837 Credit Union in Eastern Europe and Central Asia** -6.609697 2.975 -2.22 0.027 Credit Union in Middle East and North Africa (omitted)
Credit Union in South Asia* 7.960309 4.433 1.8 0.073
NGO in Africa** 6.944501 3.115 2.24 0.026
NGO in East Asia and the Pacific 3.791955 3.827 0.99 0.322 NGO in Eastern Europe and Central Asia 3.364407 3.836 0.88 0.381 NGO in Middle East and North Africa 1.502814 4.975 0.30 0.763
NGO in South Asia*** 6.90368 2.543 2.72 0.007
Rural Bank in Africa .8555197 12.77 .07 0.947
Rural Bank in East Asia and the Pacific 4.104319 6.086 0.67 0.500 Rural Bank in Eastern Europe and Central Asia (omitted)
Rural Bank in Middle East and North Africa (omitted) Rural Bank in South Asia (omitted)
Table 12: Country Dummies
Number of obs = 412 R-squared = 0.7656 Adj R-squared = .7517
Real Yield Coef. Std. Err. T P>t
Average Loan Size / GNI per capita*** -.0515 .011 -4.65 0.000 Operating Expense / GLP*** 38.744 2.913 13.30 0.000 Portion of Women Borrowers* 3.784 2.138 1.77 0.078
Age** .1094 .051 2.15 0.032 Cost of Funds*** .8557 .127 6.76 0.000 Savings* 2.554 1.34 1.90 0.058 For-Profit*** 7.020 2.121 3.31 0.001 Regulated*** -5.929 1.498 -3.96 0.000 Bank -1.81 3.473 -.52 0.602 Credit Union -2.385 2.087 -1.14 0.254 NGO -2.373 2.335 -1.02 0.310 Rural Bank*** -12.23 3.761 -3.25 0.001 Bangladesh** 6.283 2.535 2.48 0.014 Bolivia*** 20.198 2.665 7.58 0.000 Brazil*** 18.141 2.619 6.93 0.000 Colombia*** 12.847 2.399 5.35 0.000 Ecuador*** 12.005 2.195 5.47 0.000 Mexico*** 31.08 2.349 13.23 0.000 Nicaragua*** 22.22 2.66 8.35 0.000 Peru*** 21.89 2.006 10.91 0.000 Philippines*** 25.189 2.753 9.15 0.000 Tajikistan*** 35.25 2.997 11.76 0.000 Constant*** -8.446 2.917 -2.9 0.004
Table 13: Macro Variables
Number of obs = 412 R-squared = 0.6792 Adj R-squared = 0.56662
Real Yield Coef. Std. Err. T P>t
Average Loan Size / GNI per capita** -.0213265 .0107 -1.99 0.047 Operating Expense / GLP*** 47.65102 3.162 15.07 0.000 Portion of Women Borrowers** -4.639531 2.085 -2.22 0.027
Age*** .14996 .0558 2.69 0.008 Cost of Funds*** .8297238 .1379 6.02 0.000 Savings 2.015642 1.279 1.58 0.116 For-Profit*** 6.38208 2.303 2.77 0.006 Regulated*** -11.16924 1.565 -7.14 0.000 Bank .8212383 3.931 0.21 0.835 Credit Union -.4517635 2.154 -0.21 0.834 NGO .1648441 2.504 0.07 0.948 Rural Bank*** -13.5283 4.0723 -3.32 0.001 Regulatory Environment*** .5679366 .062 9.12 0.000 Investment Climate** .1734526 .068 2.57 0.011 Institutional Development*** -.4634731 .045 -10.24 0.000 Constant -8.318928 5.11 -1.63 0.105
Table 14: Robustness
Number of obs = 745 R-squared = 0.5854 Adj R-squared = 0.5769
Real Yield Coef. Std. Err. T value P>t Average Loan Size / GNI per capita*** -.0102953 .0039 -2.61 0.009 Operating Expense / GLP*** 45.07709 2.245 20.08 0.000 Portion of Women Borrowers* -3.347637 1.727 -1.94 0.053
Age* .0918598 .0513 1.79 0.074 Cost of Funds*** 1.105639 .075 14.74 0.000 Savings -1.196229 1.075 -1.11 0.266 For-Profit -.9220765 1.725 -0.53 0.593 Regulated*** -7.985083 1.276 -6.26 0.000 Bank -1.125913 2.061 -0.55 0.585 Credit Union** -4.740648 2.154 -2.20 0.028 NGO* -4.137492 1.909 -2.17 0.031 Rural Bank -3.512996 2.267 -1.55 0.122 Regulatory Environment*** .2546383 .0359 7.09 0.000 Investment Climate .0581246 .0468 1.24 0.215 Institutional Development*** -.2448405 .0298 -8.21 0.000 Constant 8.631682 3.264 2.64 0.008
9
References
Armendariz, de Aghion, and Jonathan Morduch. 2005. The economics of microfinance. Cambridge and London:; MIT Press.
Caudill, Steven B., Daniel M. Gropper, and Valentina Hartarska. 2009. Which microfinance institutions are becoming more cost effective with time? Evidence from a mixture model. Journal of Money, Credit and Banking 41 (4) (Jun.): pp. 651-672.
Chaves, Rodrigo A., and Claudio Gonzalez-Vega. 1996. The design of successful rural financial intermediaries: Evidence from indonesia. World Development 24 (1) (01): 65-78. Robert Cull, Asli Demirguc-Kunt and Jonathan Morduch, "Does Regulatory Supervision Curtail
Microfinance Profitability and Outreach?" The World Bank, Policy Research Working Paper Series: 4948, 2009),
http://search.ebscohost.com/login.aspx?direct=true&db=ecn&AN=1046320&site=ehost-live;
http://www-wds.worldbank.org/servlet/WDSContentServer/WDSP/IB/2009/06/01/000158349_20090601114 132/Rendered/PDF/WPS4948.pdf.
———. 2009. Microfinance meets the market. Journal of Economic Perspectives 23 (1) (Winter): 167-92.
———. 2007. Financial performance and outreach: A global analysis of leading microbanks. Economic Journal 117 (517) (02): F107-33.
Economist Intelligence Unit. Global microscope on the microfinance business environment. in The Economist [database online]. Online, 20092011]. Available from
http://www.eiu.com/site_info.asp?info_name=Global_Microscope_2009&page=noads&rf=0. Fred De Sam Lazaro. 2011. Regulators crack down on microfinance industry in India. PBS2011. Gutiérrez-Nieto, B., C. Serrano-Cinca, and C. Mar Molinero. 2009. Social efficiency in microfinance
institutions. The Journal of the Operational Research Society 60 (1) (Jan.): pp. 104-119. Hardy, Daniel C., Paul Holden, and Vassili Prokopenko. 2003. Microfinance institutions and public
policy. Journal of Policy Reform 6 (3) (09): 147-58.
Hartarska, Valentina. 2005. Governance and performance of microfinance institutions in central and eastern europe and the newly independent states. World Development 33 (10) (10): 1627-43. Hartarska, Valentina, and Denis Nadolnyak. 2008. An impact analysis of microfinance in bosnia and
herzegovina. World Development 36 (12) (12): 2605-19.
———. 2007. Do regulated microfinance institutions achieve better sustainability and outreach? cross-country evidence. Applied Economics 39 (10-12) (June): 1207-22.
Hubert Tchakoute-Tchuigoua. 2010. Is there a difference by the legal status of microfinance institutions? The Quarterly Review of Economics and Finance 50 : 436-42.
Hudon, Marek. 2010. Management of microfinance institutions: Do subsidies matter? Journal of International Development 22 (7) (10): 890-905.
Yunus, Muhammad. The founder of Grameen Bank, received the Nobel Peace Prize. 2011. Sacrificing microcredit for megaprofits. The New York Times, January 15, 2011, sec A; Editorial Desk; OP-ED CONTRIBUTOR.
Mersland, Roy, and R. Oystein Strom. 2009. Performance and governance in microfinance institutions.
Journal of Banking and Finance 33 (4) (04): 662-9.
Mersland, Roy, and R. O. Strom. 2010. Microfinance mission drift? World Development 38 (1) (01): 28-36.
Mix Market. 2009 data on MFIs. in The Mix [database online]. [cited 2011 Available from
www.mixmarket.org.
Mohan, Lakshmi, and Devendra Potnis. 2010. Catalytic innovation in microfinance for inclusive growth: Insights from SKS microfinance. Journal of Asia-Pacific Business 11 (3) (July): 218-39.
Jonathan Morduch, Asli Demirguc-Kunt and Robert Cull, "Financial Performance and Outreach : A Global Analysis of Leading Microbanks" The World Bank, Policy Research Working Paper Series: 3827, 2006),
http://search.ebscohost.com/login.aspx?direct=true&db=ecn&AN=0814370&site=ehost-live;
http://www-wds.worldbank.org/servlet/WDSContentServer/WDSP/IB/2006/01/24/000016406_20060124163 013/Rendered/PDF/wps3827.pdf.
Navajas, Sergio, Jonathan Conning, and Claudio Gonzalez-Vega. 2003. Lending technologies, competition and consolidation in the market for microfinance in bolivia. Journal of International Development 15 (6) (08): 747-70.
Ahmad Nawaz, "Performance of Microfinance: The Role of Subsidies" Universite Libre de Bruxelles, Solvay Brussels School of Economics and Management, Centre Emile Bernheim (CEB), Working Papers CEB: 10-008.RS, 2010),
http://search.ebscohost.com/login.aspx?direct=true&db=ecn&AN=1089798&site=ehost-live; http://www.solvay.edu/EN/Research/Bernheim/documents/wp10008.pdf.
Polgreen, Lydia, and Vikas Bajaj. 2010. Microcredit is imperiled in india by defaults. The New York Times, November 18, 2010, sec A; Foreign Desk.
World Bank. Data: Poverty. in World Bank [database online]. 20112011]. Available from