Persistent Price Dispersion in Online Markets
by
Michael R. Baye, John Morgan, and Patrick Scholten
Authors’ Blurb
Michael R. Baye is a professor in the Department of Business Economics and Public Policy, Kelley School of Business, Indiana University, Bloomington, IN 47405
John Morgan is the corresponding author. He is a professor in the Woodrow Wilson School and Department of Economics, Princeton University, Princeton NJ, 08544. e-mail: rjmorgan@princeton.edu
Patrick Scholten is a graduate student in the Department of Economics, Indiana University, Bloomington, IN 47405
Abstract
Using data from one of the Internet’s leading price comparison sites for consumer electronics products, we present evidence for the persistence of price dispersion for 36 homogeneous products. The markets for these products are “thick” with an average of over 20 firms selling each product. We show that prices do not converge to the “law of one price” even after an 18 month period. This finding is robust to controls for differences in shipping charges and inventories. Further, we show that product life cycle effects lead to changes in the number of competing firms and the range of price dispersion consistent with the theoretical predictions of the Varian (1980) model. The average number of competing firms declines from about 28 to 10 during the final five months of our dataset. Over this same period, the average range in prices decreases from about 75 percent to 30 percent. After accounting for firm heterogeneities in costs, branding, reputation, trust, product availability and shipping costs, 28 percent of the variation in prices charged for homogeneous products remains unexplained. This is also consistent with the Varian model.
Keywords: Price dispersion, Internet, Law of One Price JEL Numbers: D4, D8, M3, L13
1. Introduction
The failure of the “law of one price” has been widely observed in non-Internet markets. In his seminal paper, Hal Varian quipped that when it came to prices for identical products in conventional retail markets, “… the ‘law of one price’ is no law at all.” (Varian 1980, 651) Beginning with Stigler (1961), a large and successful theoretical literature has arisen explaining how dispersed prices can comprise
equilibrium in the presence of price-sensitive consumers and homogeneous products. One approach generates price dispersion in pure strategies, where different firms charge different prices because of heterogeneities in costs or service levels. The other approach generates price dispersion through randomized pricing strategies by firms.1 As Varian points out, the former type of price dispersion is unlikely to be long-lived, as consumers will eventually learn which firms are charging the best prices and shop from them exclusively. Varian argues that the latter type of price dispersion will persist over time.
Price dispersion has also been observed in Internet markets (see Smith, Bailey, and Brynjolfsson, 1999 for a useful survey of results2); however, little is known about the empirical persistence of this price dispersion over long periods of time. In contrast to Varian’s explanation, Brynjolfsson and Smith (2000) argue that price dispersion is largely due to retailer heterogeneity with respect to branding, awareness, and trust. If this is the case, price dispersion should be modest after controlling for such
The present paper examines the persistence of price dispersion in a
well-established online retail market. Using data collected over an 18-month period from one of the leading price comparison sites on the Internet, we show that prices for identical consumer electronics products listed by multiple retailers display considerable and persistent price dispersion. On average, the highest price for a consumer electronics product is 57% above the lowest available price. The savings to a consumer simply from consulting the comparison site are also significant—on average, the difference in prices paid by consumers shopping at a randomly selected firm rather than from the firm offering the lowest price is about $31.
Price dispersion persists across products and across time. We find no convergence to the “law of one price” over an 18 month period even after controlling for
differences in shipping charges and inventories. We also use time variation in the data to make an additional inference. Specifically, we show that Varian’s model implies that as the reservation value of consumers seeking to purchase an item decreases, (1) the number of firms listing the product declines and (2) the range of prices offered decreases. The methodology we employ to test these predictions is to use the short life cycles of consumer electronics products as a means of obtaining variation in consumer reservation values. Reservation values are presumably lower later in the product lifespan. Empirically, we find evidence consistent with these hypotheses. The number of competing firms declines by over 60 percent in the final seven months of our dataset. Over this same period, the average range in prices decreases by $31 or 54% of the range at the start of the sample period.
We find that even after controlling for differences in costs, reputation, awareness, and trust, a significant fraction of the observed price dispersion is unexplained. Specifically, regressions controlling for the presence of banner ads, consumer feedback ratings, firm disclosures about shipping costs, and inventory availability as proxies for these factors explain only about 17% of the observed dispersion in prices. Further, regressions using individual firm dummies and allowing the coefficients on these dummies to vary across multiple products offered by the same firm still leave 28% of price dispersion unexplained.
The nearest antecedent to this paper is Sorensen (2000).3 Sorensen showed that there was considerable price dispersion in retail prescription drug markets in upstate New York. Moreover, this dispersion cannot be accounted entirely for by firm heterogeneities.4 He finds that, consistent with equilibrium search models such as Burdett and Judd (1983), prescriptions that consumers purchase more frequently display less dispersion than those that are purchased less frequently. Our approach is similar in that we too seek to establish the empirical importance of price dispersion unaccounted for by firm heterogeneities.
It is important to stress that our data comes from online markets where consumers have access to a list of prices. In this setting, information flows are “costless” inside the market. This suggests that models such as Varian (1980) or Baye and Morgan (2001) are probably more appropriate for generating testable implications for our data than models such as Reinganum (1979) or Burdett and Judd (1983) where equilibrium price dispersion stems from costly sequential or fixed-sample search.
The remainder of the paper proceeds as follows. The next section derives three empirically testable implications of the Varian model. Section 3 describes our dataset, while Section 4 presents the analysis of the persistent price dispersion hypothesis. Section 5 examines the alternative hypothesis: that price dispersion is mainly due retailer heterogeneities. Finally, Section 6 concludes.
2. Theory
Unlike costly search models, which generate price dispersion from consumers’ positive search costs, the model of Varian postulates that I “informed” consumers have access to the complete list of firm prices for some homogeneous product, as would be the case were these consumers to consult a price comparison site. The remaining consumers, perhaps unaware of the site or without Internet access, simply shop at a randomly selected firm and purchase from it if the price offered is less than the reservation value, r. There are M of these “uninformed” consumers in this market. All consumers have unit demand.
Firms are assumed to be identical, there is free entry, and all firms have declining average cost curves.5 We make the additional assumption that average cost curves are convex. 6 Since firms pricing at the reservation price sell only to uninformed
consumers at a price of r each, free entry implies that
where AC() is the average cost function of each firm and n is the equilibrium number of firms. Since average costs are declining, this implies:
Hypothesis 1: As the reservation value decreases, the equilibrium number of firms
declines.
Intuitively, a shrinking reservation value reduces the overall surplus in the market. As a consequence, the market can support fewer firms’ fixed costs, and the
equilibrium number of competing firms declines.
Varian shows that in a symmetric equilibrium, prices are dispersed over the interval [p*, r], where
(2) p* = AC(M/n + I).
The convexity of the average cost curves together with equilibrium conditions (1) and (2) implies:
Hypothesis 2: As the reservation value decreases, the range in prices declines.
The intuition for the decrease in the range in prices is as follows. As the
reservation value decreases, the lowest price a firm is willing to charge if it is assured of attracting all shoppers declines, since the opportunity cost of this discount in terms
of foregone revenue to loyal customers is reduced. This lowest price is p* in equation
(2) above. However, because of equilibrium exit, a larger fraction of a firm’s fixed costs are being covered by uninformed consumers; hence, the gains in terms of reduced average costs from selling to informed consumers is smaller when
reservation values are lower than when they are higher. The upshot is that the range of prices offered is reduced under this circumstance.
Finally, in Varian’s model, the symmetric equilibrium consists of all firms pricing according to an atomless cumulative distribution function over the range [p*, r]. This implies:
Hypothesis 3: Price dispersion for products will persist over time.
In the sequel, we examine empirically these three hypotheses.
3. Data
Tests of the above hypotheses require data from an environment where some consumers have access to the complete list of prices while others do not. Further, products sold must be fairly homogeneous and (for the symmetric equilibrium to be appropriate) the firms must have similar costs. While none of these conditions is likely to be exactly met in field data, Internet price comparison sites offer a
reasonable approximation of these conditions. To this end, we assembled a dataset consisting of monthly price observations for 36 consumer electronics products offered
for sale at the price comparison site Shopper.com for the period from November 1999 through May 2001. Initially, we collected these data by saving web pages for each of the products listed. After August 2000, we automated this process by constructing an Internet “spider” written in the PERL programming language to automatically
download this information.
The set of products in our dataset were selected because they were the 36 highest ranked products, in terms of popularity, at the Shopper.com site at the start of the study. We inferred that the markets for these products were likely to be thick on the consumer side. Thus, the incentives for sellers to balance between posting a high price to make higher margin sales to uninformed consumers versus selling at a low price to attract the informed consumers at Shopper.com were likely to be large. The product rankings given at Shopper.com are a function the number of unique consumer requests for either product or price comparison information from the Shopper.com site. This amounts to a “click through” from a general Shopper.com page to a specific product information page.
One potential problem in studying price dispersion on a product-by-product basis is that the relevant consumption component for consumers might be a bundle of products rather than an individual product. For two reasons, this problem is mitigated in our data. First, the products we study do not have obvious purchase
complementarities. Indeed, many of the products listed in Table 5 (such as the Palm III, IIIx, and Palm V) are in fact substitutes. Second, the products we study are fairly expensive (averaging about $500), so consumers are unlikely to purchase multiple
products at the same time in order to economize on shipping costs. This aspect of our data differs from earlier studies of less expensive items, such as books and CDs, where these effects might be more important.
We grouped products into one of three broad categories: software, peripherals, and accessories. Software is self-explanatory. Peripherals were items that would typically be installed as part of an existing PC. Video boards are a representative item in this category. Finally, accessories are consumer electronics items that are usable with or without a PC. The Palm handheld is a typical item in this category.
The cost structure of Shopper.com provides disincentives for dishonest or otherwise obfuscating pricing strategies.7 A firm pays Shopper.com a fixed monthly fee plus an additional fee per “qualified lead” (defined as a click through by a consumer from the Shopper.com site to the merchant’s site). Thus, the strategy of posting a low price for a product which is unavailable in hopes of driving consumer traffic to one’s site does not come without cost. An additional concern is that merchants might choose to price discriminate between consumers coming to their website from Shopper.com and those accessing it directly. To deal with these issues, we conducted random audits of merchant listings. We found no obfuscation strategies being employed for the products we study nor did we find evidence of discriminatory pricing. Hence, we are confident that the prices listed on Shopper.com represent actual prices for actual products that can be obtained.8
There were a few instances of prices that were obviously inputted incorrectly by firms. Specifically, there were a couple of prices that were listed at $0 on the site. To
deal with this issue, we dropped all prices of $5 or less from the sample. This
eliminated six observations from the sample of 9,441 observations. Results presented below are robust to a variety of different approaches to “cleaning” the data.9
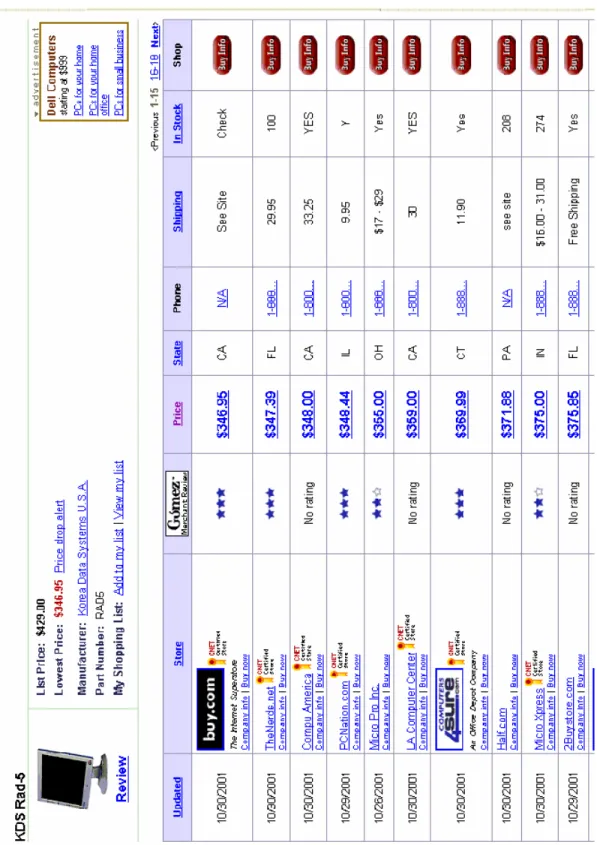
Figure 1 illustrates the information available to consumers searching for a particular product from Shopper.com's database. At the top of Figure 1, the product name, manufacturer name, manufacturer part number, list price, and the lowest price is listed. The information also includes, in tabular form, each firm’s name, the firm’s price, Cnet Certified Store status, Gomez merchant rating, state, telephone number, shipping cost, product availability, and the date on which the firm last updated its information. Consumers can sort the relevant information by clicking on the column header. For example, a consumer wanting to sort the firms by price can click on the price column header.
Further product information and how to purchase an item from a particular firm can be obtained by ‘clicking’ either the “Buy info,” “firm name,” or “price” link.10 Consumers can access information about a firm’s return policies, acceptable methods of payment, delivery options, and other special features by clicking the “Company info” link below a firm’s name. Also, clicking the Certified Store logo brings up the requirements firms must meet in order to maintain its certified status. Finally, consumers can view the criteria on which a firm was evaluated and read the overall review by clicking on the stars from the Gomez.com firm review.
<A> Branding, Reputation and Trust
Shopper.com provides firms with other opportunities to distinguish themselves in the market. For an additional fee, a firm can complement its merchant name with its company logo or participate in a revolving targeted banner advertising campaign in several locations.
Shopper.com provides two firm quality ratings with each product search. The first is the Cnet Certified Store rating. All firms displaying the Cnet Certified Store logo have met a set of seven criterion that include: providing Cnet with up-to-date pricing, shipping cost, and stock information; providing Cnet with a customer service policy; honoring prices displayed on the firm's web site; using encryption technology so all transactions are made in a secure environment; providing order confirmation within one business day of order and process orders promptly; providing professional packaging; and responding to customer service emails and phones call within two business days. It would seem that stores that are Cnet certified are likely to be perceived as more reputable than those who are not.
Shopper.com also retains the services of an independent firm rating service. During the early part of our study, Shopper.com used Bizrate.com to survey
consumers shopping experience with firms advertising on its web site and compiled ratings of the firms in several areas. An overall rating, between 1 and 5 stars (in half-star increments) was assigned to each firm and displayed next to the firm's name. This allowed consumers to assess overall firm quality. Bizrate.com's services are provided for free to consumers and retail Internet firms. Bizrate.com provided these services
for a fee to Shopper.com. In November, 2000, Shopper.com terminated its relationship with Bizrate.com.11
Firms may differ not only with respect to their use of banner ads, Cnet certified merchant status, and Bizrate ratings, but also with respect to their disclosure policies regarding shipping and inventory.
In principle, all of these variables represent observable heterogeneities among firms. In Section 5, we examine how much of the observed price dispersion these heterogeneities explain.
4. Analysis
<A> Summary of Price Variation
Table 1 presents a list of prices for products offered in common by the four merchants covering the largest number of products in our dataset at the beginning of the dataset. The first column of the table lists the 27 products sold by all four firms on November 5, 1999. The type of product (S for software, P for peripherals, A for accessories) is listed in the second column. The last four columns show the listed price by the four firms on this date.
The price dispersion observed for these products on this date is representative of the entire dataset. A consumer shopping for a digital camera, the Nikon Coolpix 950 can save about $100 by simply buying from the lowest rather than the highest priced of these four merchants. Among these four firms, pcWonders offers the low price for 24 out of the 27 products on this date. Interestingly, pcWonders is the high-price
seller among the four for the remaining three products for which it lists a price. Likewise, there is no firm among the four that is the high price seller for all products, but McGlen Micro comes close—its price is the highest for 19 out of the 27
products. The remaining two sellers split second and third place fairly evenly. It is important to stress that none of these four firms consistently offers the lowest price across all products and time.
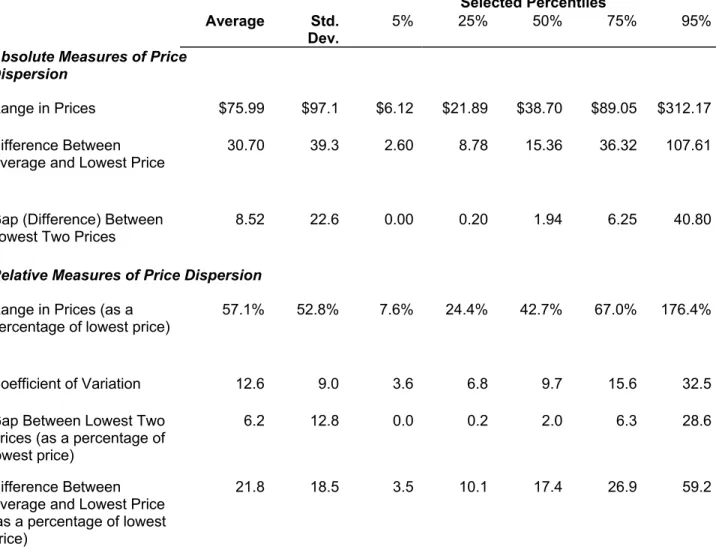
Table 2 presents summary statistics of various measures of price dispersion for the entire period of the study. The results here confirm the impressions in Table 1— price dispersion is a significant and persistent phenomenon in these markets. Table 2 shows that the range in prices is $75.99 on average. The table also shows that a consumer shopping from the low price firm, rather than from a firm charging the average price, stands to save $30.70 on a purchase. Even a conservative measure of price dispersion, the difference between the two lowest listed prices, shows an average gap between these two prices of $8.52. The coefficient of variation—a unit-free measure of price dispersion defined as the ratio of the standard deviation to the mean—averages 12.6%. Thus, the price dispersion is substantial, although somewhat lower than what Sorensen found in conventional retail markets for prescription drugs.12
<B> Price Dispersion over Time
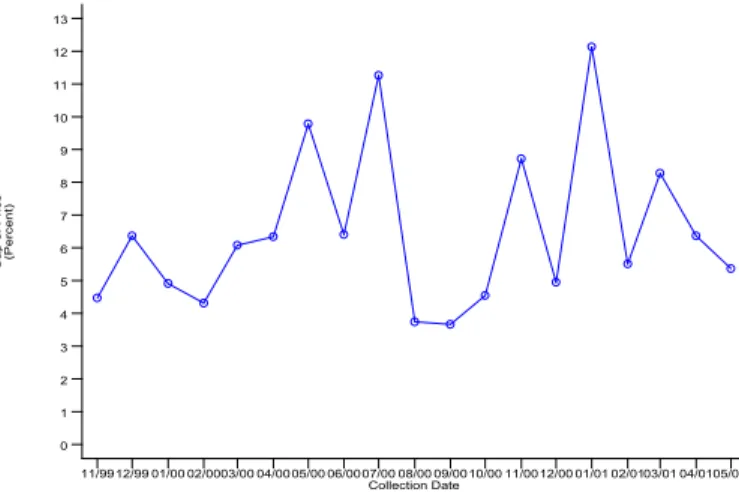
In figures 2 through 4, we present evidence of persistent price dispersion over the 18 month period covered in our dataset using three measures of price dispersion. Two
of the measures, the coefficient of variation and range, were discussed earlier. In this case, the range in price is reported as a percentage of the lowest price offered for each product. The graph also shows the difference between the two lowest price listings, expressed as a percentage of the lowest listed price. This measure, which we shall refer to as the gap between the two lowest prices, is a very conservative measure of price dispersion. Moreover, it places no weight on high price outliers, which would affect the other two measures.13
In figure 2, we show the average level of price dispersion giving equal weight to each product date in our dataset over the 18 month period of our study. As the three panels of the figure show, there is persistent price dispersion using all three measures. Panel 2a displays the percentage gap over the 18 month period covered by our
dataset. The percentage gap starts at around 5% and ends at slightly above this level. In between, the measure displays considerable volatility with upward spikes reaching over the 10% level in the middle of 2000 and the beginning of 2001. If anything, there is a slight upward trend in this measure.
Panel 2b displays monthly percentage range figures. Unlike the percentage gap, this measure of price dispersion displays a distinct downward trend starting at between 70% and 80% and ending under 30% by May 2001. The trend in this measure of dispersion is consistent with the theoretical prediction of hypothesis 2 derived in the previous section. Finally, panel 2c displays the coefficient of variation on a monthly basis. There is a slight downward trend in this measure of dispersion. At the start of our study, coefficient of variation averages around 13% whilst it falls to
around 9% by the May 2001. Despite the downward trend displayed in the coefficient of variation and percentage range measures of price dispersion, prices are still
significantly dispersed even after 18 months of price discovery by consumers and rival firms.
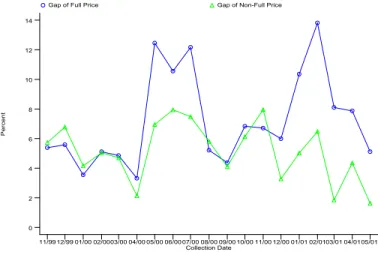
The panels shown in figure 3 display the same three dispersion measures adjusted for shipping costs. While the prices used to compute the price dispersion measures in figure 2 and elsewhere are based on list prices, in figure 3 we adjust the prices for shipping and handling charges. Specifically, we divide the dataset into firms that report shipping and handling charges and those that do not. Of those firms that do report a shipping cost, if they suggest a range of prices, we take the midpoint of the range. Otherwise, we adjust the listed price for the shipping charge shown on the site and compute dispersion with these adjusted prices.
It is theoretically possible to observe persistent dispersion in list prices, yet for all firms to be charging the same “full price” once one accounts for shipping costs. Figure 3, however, shows that this is not the case. Including shipping charges lowers the coefficient of variation, but typically by less than 1%. Shipping adjusted prices also lower the price range by less than 5% for each monthly period. Shipping adjusted prices have the least effect when one looks at the gap between the lowest two prices. Here, there is little to distinguish between dispersion using the adjusted and
unadjusted prices.
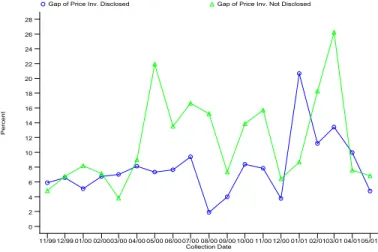
Figure 4 examines these same dispersion measures dividing firms into those that positively disclose that a particular item is in stock and those that do not. The idea is
that firms that do not have an item in stock may list a price simply as a device to divert traffic to their site in hopes consumers will buy some other, presumably higher margin item. This could cause various measures of price dispersion to indicate dispersion even though all of the firms that actually have goods to sell charge the same price. As figure 4 shows, focusing solely on firms positively having the item in stock slightly decreases the coefficient of variation and range measures of price dispersion and does little to affect the gap measure. Regardless of the measure used, persistent price dispersion remains.
To summarize, we find evidence of persistent price dispersion using a variety of dispersion measures and controlling for differences in shipping costs and whether the item is in stock. This is consistent with hypothesis 3.
<C> Testing Comparative Static Implications
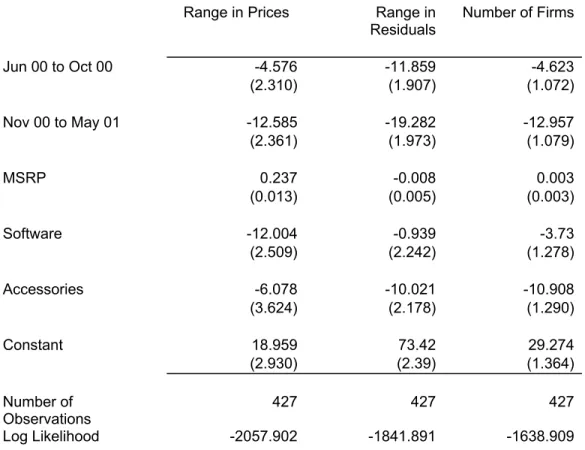
We now turn to hypotheses 1 and 2, which predict that as reservation values decline, the equilibrium number of firms and the range in prices should both decline. Our data tracks 36 products over an 18 month period, starting at the point when they were the most popular products listed at Shopper.com. As products get older in our sample, one would expect consumer reservation values to decline. To get at this effect, we run the following regression:
RANGEit is the range in prices for product i on date t expressed in dollars. D1 is a dummy for whether the observation comes six to ten months from the end of the dataset. D2 is a dummy for whether the observation comes from the last five months of the dataset. The variable MSRPit is the manufacturers suggested retail price for product i on date t. The vector Xi consists of dummies for the type of product
(software, peripherals, or accessories). The idea behind these controls is that if demand or costs vary systematically with product type, this variation will be absorbed.
Using GLS to correct for the presence of heteroscedasticity in the error term, table 3 presents the coefficient estimates for equation (3). The first column of the table displays the estimates of equation (3) when the dependent variable is simply the range in prices expressed in dollars. The coefficient associated with D1 is -4.576 indicating that the range in prices is compressed by about $4.58 within ten months of the end of the dataset. The compression in the range of prices approximately doubles to $12.59 in the last five months of the dataset. Both coefficients are of the sign predicted in Hypothesis 1 and are significant at conventional levels. Moreover, both coefficients display the expected magnitudes—coefficient D1 is statistically significantly smaller than the D2 coefficient.
The second column of Table 3 displays the coefficients when we estimate the “corrected” range in prices using the procedure described in Sorensen (2000) to control for the effects of observable firm heterogeneities. Following Sorensen (2000), we estimate the range of the residuals from a fixed effects regression of price on
product dummies and dummies for product type, certified merchant status, banner status, whether shipping cost and product availability were disclosed. The coefficient associated with the period from June to October 2000 indicates a compression of this “corrected” range measure of $11.86 while the coefficient for the final five months of the dataset shows compression of $19.28. Once again both coefficients are of the expected sign and significant. Also, the magnitudes of the coefficients are in the expected pattern; that is, we reject the null hypothesis that the coefficients D1 = D2 against the one-sided alternative that D1 is smaller than D2. Taken together, the results are supportive of Hypothesis 1.
Next, we examine the relationship between the age of the product and the number of listing firms. We do this by estimating the following regression:
(4) NUMFRMit = β0 +β1D1 + β2D2 +β3MSRPit + γXi +εit,
where NUMFRMit denotes the number of firms listing prices for product i on date t. Once again, we estimate this regression using GLS and correcting for
heteroscedasticity. The estimated regression coefficients are reported in the third column of table 3. The number of competing firms declines by about 4.6 firms, as the coefficient on the dummy variable for the period June 2000 through October 2000 indicates. Similarly, from November 2000 until the end of the dataset, the table shows that the number of firms further declines by about 13 firms. Both coefficients are of
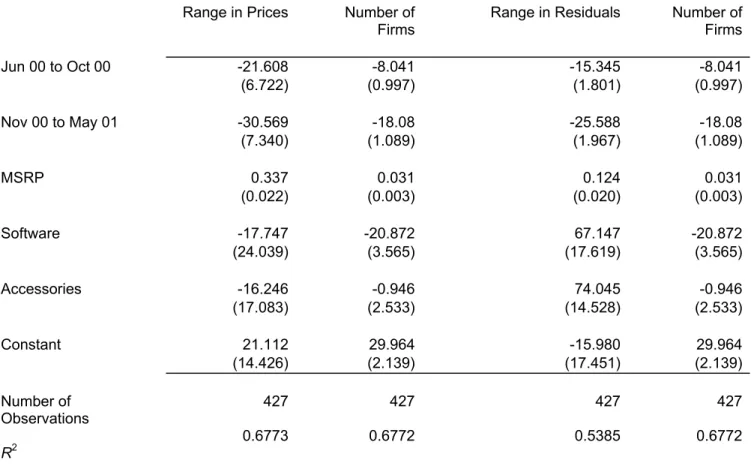
the expected signs and magnitudes and both are significant at conventional levels. Thus, the results of the fourth column of table 3 are consistent with hypothesis 2. Neither hypothesis 1 nor hypothesis 2, are made in isolation in Varian’s model. Indeed, that model predicts that changes in the range of prices and numbers of listing firms should be correlated with one another. This suggests that a more efficient estimation approach is to use Zellner’s Seemingly Unrelated Regressions to
simultaneously estimate equations (3) and (4). The results of this approach are shown in Table 4. The first two columns of this table present the coefficient estimates using the raw dollar value of the range in prices. The second two columns present the coefficient estimates using the “corrected” price range using the residuals from the fixed effects regression described earlier.
Once again, the coefficients on D1and D2 are of the expected signs and magnitudes and are significant at conventional levels. The correlation coefficient between these two variables is estimated to be 0.3783, which is positive and significant, again consistent with the theoretical predictions.
5. Firm Heterogeneity and Price Dispersion
The analysis above indicates not only that price dispersion persists over time, but that the pattern of observed dispersion is consistent with predictions of the Varian model. In this section, we examine alternative explanations based on differences in branding, reputation, and trust as well as cost heterogeneities.
For a given product listed at Shopper.com, all retailers are offering the same item. Yet, retailers do differ in their restocking policies, exchange policies, shipping
speeds, and so on. Thus, it is possible that the observed price dispersion merely reflects quality differences among retailers, although the differences in the price rankings of the portfolio of products offered by the same retailer does cast some doubt on this explanation.
Brynjolfsson and Smith (2000) identified branding, reputation, and product awareness as key factors in generating price dispersion on the Internet. To quantify the impact of these factors on the dispersion observed in our dataset, we consider the following model separately for each product in our dataset:
(5) PRICEjt = β0 + β1CNETjt +β2BANNERjt + β3SHIPjt +β4STOCKjt + εjt
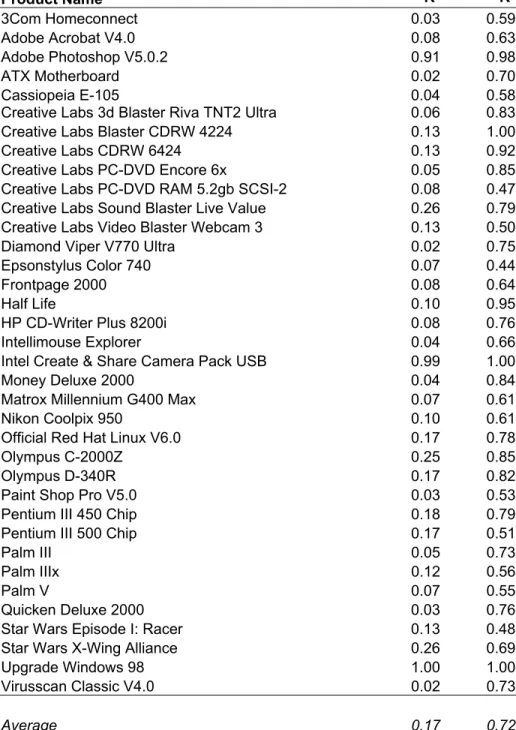
As equation (5) shows, for each product, we regress the list price of firm j in period t on dummy variables for whether firm j is a Cnet certified merchant (the variable CNETjt), whether it posted a banner ad on that date (BANNERjt), whether it disclosed shipping costs on that date (SHIPjt), and whether it had the item in stock on that date (STOCKjt). The resulting R-squared values are reported in the first column of Table 5 (model 1).
Notice that the R-squared values reported for model 1 represent the percentage of the total variation in the prices charged for each product that can be explained purely by observable differences in these firm characteristics. The R-squared values range
from 2 percent to 100 percent. The average value is 17 percent, indicating that 83 percent of the variation in the prices for these products cannot be explained by observable differences in firms’ reputations, advertising strategies, or disclosure policies regarding shipping costs or product availability. If price dispersion were an artifact purely of these observable differences, the R-squared values would all have been close to 1.
Model 1 controls only for firm heterogeneities that are observable to consumers visiting the Shopper.com site. One might speculate that unobserved heterogeneities in firms’ costs or other factors explain the observed price dispersion. In order to quantify the impact on price dispersion of both observed and unobserved firm heterogeneities, we also regressed the list price of firm j in period t on dummy variables for each firm j. The R-squared values from this specification (model 2) are given in column 2 of table 5.
The R-squared values reported for model 2 represent, for each product, the percentage of the total variation in prices explained by both firm differences
observable by looking at the Shopper.com site as well as heterogeneities not directly observable (such as cost differences). Not surprisingly, including all of these dummy variables greatly increases the percentage of the observed price dispersion that can be explained. However, even with individual dummies for every firm in the sample and controls for each product in our sample, 28 percent of the dispersion in prices remains unexplained.
To summarize, after accounting for firm heterogeneities in costs, branding,
reputation, trust, product availability and shipping costs, 28 percent of the variation in prices charged for homogeneous products remains. This finding is consistent with Hypothesis 3.
6. Discussion
George Stigler noted that in practice there is never absolute homogeneity of commodities in naturally occurring markets. However, Stigler was loathe to attribute all of observed price dispersion to heterogeneities. He writes: “…a portion of the observed dispersion is presumably attributable to such [product] differences. But it would be metaphysical, and fruitless, to assert that all dispersion is due to
heterogeneity.” (Stigler, 1961 p.214)
The primary purpose of this paper is to assess whether a significant fraction of the price dispersion observed on a leading Internet price comparison site owes its
existence to forces of persistent price dispersion hypothesized in Varian as opposed to being an artifact of differences in costs, branding, reputation, or trust among
competing retailers. Our central finding is that price dispersion is remarkably
persistent over the 18 month period of our study—even after controlling for shipping costs and firm heterogeneities.
If temporal price dispersion, as hypothesized by Varian, is indeed an empirically important component of observed price dispersion, then an important implication of that model is that both the number of firms listing prices for a given product and the
range of prices offered should decline as the product ages. We find evidence consistent with this prediction.
Finally, we note that while a fraction of observed price dispersion may be
explained by appealing to firm heterogeneities, 28 percent of the observed dispersion remains unexplained. We contend that this is further evidence in support of the empirical relevance of equilibrium models of persistent price dispersion.
References
Bakos, Yannis, “The Emerging Landscape of Retail E-Commerce,” Journal of Economic Perspectives, 15 (2001), pp. 69-80.
Baye, Michael R. and John Morgan, “Information Gatekeepers on the Internet and the Competitiveness of Homogeneous Product Markets,” American Economic Review, 91 (2001), pp. 454-74.
Baye, Michael R. and John Morgan, “Information Gatekeepers and Price Discrimination on the Internet,” Economics Letters, forthcoming.
Baye, Michael R., John Morgan, and Patrick Scholten, “Price Dispersion in the Small and in the Large: Evidence from an Internet Price Comparison Site,” mimeo,
Princeton University, 2001.
Baye, Michael R., John Morgan, and Patrick Scholten, “Pricing and Reputation in an Online Consumer Electronics Market,” mimeo, Princeton University, 2002a.
Baye, Michael R., John Morgan, and Patrick Scholten, “The Value of Information in Online Markets: Theory and Evidence,” mimeo, 2002b.
Brynjolfsson, Erik and Michael D. Smith, “The Great Equalizer? Consumer Choice Behavior at Internet Shopbots,” MIT Sloan School of Management Working Paper, August 1999.
Brynjolfsson, Erik and Michael D. Smith, “Frictionless Commerce? A Comparison of Internet and Conventional Retailers,” Management Science, 46 (2000). pp. 563-585.
Burdett, Kenneth and Kenneth L. Judd, “Equilibrium Price Dispersion,” Econometrica (1983) 51, pp. 955-969.
Carlson, John A. and Pescatrice, Donn R., “Persistent Price Distributions,” Journal of Economics and Business (1980) 33, pp. 21-27.
Ellison, Glenn and Sara Fisher Ellison, “Search, Obfuscation, and Price Elasticities on the Internet,” mimeo, MIT, January 2001.
Gatti, J. Rupert J., “Equilibrium Price Dispersion with Sequential Search,” mimeo, Cambridge University, November 2000.
Janssen, Maarten and Jose Luis Moraga, “Pricing, Consumer Search and the Size of Internet Markets,” mimeo, Tinbergen Institute, June 2000.
Narasimhan, Chakravarthi, “Competitive Promotional Strategies,” Journal of Business, (1988) 61, pp. 427-449.
Pratt, John W., David A. Wise, and Richard Zeckhauser, “Price Differences in Almost Competitive Markets,” Quarterly Journal of Economics (1979) 93, pp. 189-211.
Reinganum, Jennifer F., “A Simple Model of Equilibrium Price Dispersion,” Journal of Political Economy (1979) 87, pp. 851-858.
Rosenthal, Robert W., “A Model in Which an Increase in the Number of Sellers Leads to a Higher Price,” Econometrica (1980) 48, pp. 1575-1580.
Salop, Steven C. and Joseph E. Stiglitz, “Bargains and Ripoffs: A Model of
Monopolistically Competitive Price Dispersion,” Review of Economic Studies (1977) 44, pp. 493-510.
Scholten, Patrick and Adam Smith, “Persistent Price Dispersion,” Advances in Applied Microeconomics, forthcoming 2002.
Shapiro, Carl and Hal R. Varian, Information Rules: A Strategic Guide to the Network Economy, Harvard Business School Press, 1999
Shilony, Yuval, “Mixed Pricing in Oligopoly,” Journal of Economic Theory (1977) 14, pp. 373-388.
Smith, Michael, Joseph Bailey, and Erik Brynjolfsson, “Understanding Digital Markets: Review and Assessment” in Understanding the Digital Economy, Brynjolfsson and Kahin, eds., MIT Press, 1999.
Sorensen, Alan, “Equilibrium Price Dispersion in Retail Markets for Prescription Drugs,” Journal Political Economy (2000) 108, pp. 833-50.
Spulber, Daniel F., “Bertrand Competition when Rivals’ Costs are Unknown,” Journal of Industrial Economics (1995) 43, pp. 1-11.
Stahl, Dale O. II., “Oligopolistic Pricing with Sequential Consumer Search,” American Economic Review (1989) 79, pp. 700-712.
Stahl, Dale O. II., “Strategic Advertising and Pricing in E-Commerce,” Advances in Applied Microeconomics 9, (2000) 79, pp. 69-100.
Stigler, G. “The Economics of Information,” Journal of Political Economy (1961) 69, pp. 213-225.
Varian, H., “A Model of Sales,” American Economic Review (1980) 70, pp. 651-659.
Villas-Boas, M., “Models of Competitive Price Promotions: Some Empirical
Evidence from the Coffee and Saltine Crackers Markets,” Journal of Economics and Management Strategy, (1995) 4, pp. 85-107.
Figure 2: Raw Measures of Price Dispersion Over Time
Panel 2a: Average Percentage Gap Over Time
G ap o f P ri ce (Perc ent) Collection Date 11/9912/99 01/00 02/0003/00 04/0005/00 06/0007/00 08/00 09/0010/00 11/0012/00 01/01 02/0103/01 04/0105/01 0 1 2 3 4 5 6 7 8 9 10 11 12 13
Panel 2b: Average Percentage Range over Time
P ri ce R ange (Perc ent) Collection Date 11/9912/99 01/00 02/0003/00 04/0005/00 06/0007/00 08/00 09/0010/00 11/0012/00 01/01 02/0103/01 04/0105/01 0 10 20 30 40 50 60 70 80 90 100
Panel 2c: Average Coefficient of Variation Over Time
C oe ffi c ient o f V ar iat ion (Perc ent) Collection Date 11/9912/99 01/00 02/0003/00 04/0005/00 06/0007/00 08/00 09/0010/00 11/0012/00 01/01 02/0103/01 04/0105/01 0 2 4 6 8 10 12 14 16 18
Figure 3: Measures of Price Dispersion Controlling for Differences in Shipping
Panel 3a: Percentage Gap of Firms Disclosing Full Price (List Price + Shipping Cost) Compared to Firms that Do Not Disclose Shipping Cost
P
erc
ent
Collection Date
Gap of Full Price Gap of Non-Full Price
11/99 12/99 01/00 02/0003/00 04/00 05/00 06/00 07/00 08/00 09/00 10/00 11/00 12/00 01/01 02/0103/01 04/0105/01 0 2 4 6 8 10 12 14
Panel 3b: Average Percentage Range of Prices for Firms Disclosing Full Price (List Price + Shipping Cost) Compared to Firms that Do Not Disclose Shipping Cost
P
erc
ent
Collection Date
Range of Full Price Range of Non-Full Price
11/99 12/99 01/00 02/0003/00 04/00 05/00 06/00 07/00 08/00 09/00 10/00 11/00 12/00 01/01 02/0103/01 04/0105/01 0 10 20 30 40 50 60 70 80 90
Panel 3c: Average Coefficient of Variation for Firms Disclosing Full Price (List Price + Shipping Cost) Compared to Firms that Do Not Disclose Shipping Cost
P
erc
ent
CV of Full Price CV of Non-Full Price
2 4 6 8 10 12 14 16 18
Figure 4: Measures of Price Dispersion Controlling for Inventory Differences
Panel 4a: Average Gap for Firms Disclosing Inventory Compared to Those Not Disclosing Inventory
P
erc
ent
Collection Date
Gap of Price Inv. Disclosed Gap of Price Inv. Not Disclosed
11/99 12/99 01/00 02/0003/00 04/00 05/00 06/00 07/00 08/00 09/00 10/00 11/00 12/00 01/01 02/0103/01 04/0105/01 0 2 4 6 8 10 12 14 16 18 20 22 24 26 28
Panel 4b: Average Percentage Range of Prices for Firms Disclosing Inventory Compared to Those Not Disclosing Inventory
P
erc
ent
Collection Date
Price Range Inv. Disclosed Price Range Inv. Not Disclosed
11/99 12/99 01/00 02/0003/00 04/00 05/00 06/00 07/00 08/00 09/00 10/00 11/00 12/00 01/01 02/0103/01 04/0105/01 0 10 20 30 40 50 60 70 80
Panel 4c: Average Coefficient of Variation for Firms Disclosing Inventory Compared to Those Not Disclosing Inventory
P
erc
ent
CV of Price Inv. Disclosed CV of Price Inv. Not Disclosed
0 2 4 6 8 10 12 14 16 18
Table 1: Sample Prices Posted By Four Firms on November 5, 1999
Product Type AccessMicro.com Computer411 McGlen Micro pcWonders.com 3Com Homeconnect P $ 120.42 $ 131.40 $ 128.42 $ 115.89
Adobe Acrobat V4.0 S 210.42 221.32 218.42 196.89 ATX Motherboard P 134.98 136.72 150.95 117.89 Cassiopeia E-105 A 530.73 537.13 534.73 579.95 Creative Labs 3d Blaster Riva TNT2 Ultra P 162.07 164.95 170.07 146.89 Creative Labs PC-DVD Encore 6x P 202.37 199.95 210.37 183.95 Creative Labs Video Blaster Webcam 3 P 59.66 64.95 67.66 53.89 Diamond Viper V770 Ultra P 162.29 151.95 170.29 149.89 Epsonstylus Color 740 P 194.19 196.00 202.19 179.89 Frontpage 2000 S 122.65 124.95 130.65 109.89 Half Life S 33.47 31.95 39.00 24.95 HP CD-Writer Plus 8200i P 191.44 194.95 199.44 185.89 Intellimouse Explorer P 50.99 63.23 58.99 45.89 Money Deluxe 2000 S 46.94 49.95 54.94 44.89 Matrox Millennium G400 Max P 200.29 208.88 208.29 197.88 Nikon Coolpix 950 A 851.28 879.52 855.28 786.95 Olympus C-2000Z A 784.79 779.95 788.79 698.89 Olympus D-340R A 258.82 264.95 266.82 298.95 Pentium III 450 Chip P 189.95 184.95 209.95 172.89 Pentium III 500 Chip P 231.95 229.95 254.95 224.89 Palm III A 247.00 219.95 255.00 189.89 Palm IIIx A 330.00 249.95 338.00 209.50 Palm V A 381.95 339.95 389.95 279.89 Quicken Deluxe 2000 S 45.25 49.95 53.25 42.89 Star Wars Episode I: Racer S 35.13 35.55 39.13 27.95 Star Wars X-Wing Alliance S 24.75 23.95 26.02 31.95 Virusscan Classic V4.0 S 12.85 13.95 48.57 9.95
Table 2: Summary Statistics for Dispersion Measures
Selected Percentiles Average Std.
Dev. 5% 25% 50% 75% 95%
Absolute Measures of Price
Dispersion
Range in Prices $75.99 $97.1 $6.12 $21.89 $38.70 $89.05 $312.17
Difference Between Average and Lowest Price
30.70 39.3 2.60 8.78 15.36 36.32 107.61
Gap (Difference) Between Lowest Two Prices
8.52 22.6 0.00 0.20 1.94 6.25 40.80
Relative Measures of Price Dispersion Range in Prices (as a
percentage of lowest price)
57.1% 52.8% 7.6% 24.4% 42.7% 67.0% 176.4%
Coefficient of Variation 12.6 9.0 3.6 6.8 9.7 15.6 32.5
Gap Between Lowest Two Prices (as a percentage of lowest price)
6.2 12.8 0.0 0.2 2.0 6.3 28.6
Difference Between Average and Lowest Price (as a percentage of lowest price)
Table 3: Product Life Cycle and Range of Prices
Range in Prices Range in
Residuals Number of Firms Jun 00 to Oct 00 -4.576 -11.859 -4.623 (2.310) (1.907) (1.072) Nov 00 to May 01 -12.585 -19.282 -12.957 (2.361) (1.973) (1.079) MSRP 0.237 -0.008 0.003 (0.013) (0.005) (0.003) Software -12.004 -0.939 -3.73 (2.509) (2.242) (1.278) Accessories -6.078 -10.021 -10.908 (3.624) (2.178) (1.290) Constant 18.959 73.42 29.274 (2.930) (2.39) (1.364) Number of Observations 427 427 427 Log Likelihood -2057.902 -1841.891 -1638.909
GLS estimates with heteroscedastic error structure across panels. Asymptotic standard errors in parentheses.
Table 4: Product Life Cycle, Range of Prices, and Number of Firms
Range in Prices Number of
Firms
Range in Residuals Number of
Firms Jun 00 to Oct 00 -21.608 -8.041 -15.345 -8.041 (6.722) (0.997) (1.801) (0.997) Nov 00 to May 01 -30.569 -18.08 -25.588 -18.08 (7.340) (1.089) (1.967) (1.089) MSRP 0.337 0.031 0.124 0.031 (0.022) (0.003) (0.020) (0.003) Software -17.747 -20.872 67.147 -20.872 (24.039) (3.565) (17.619) (3.565) Accessories -16.246 -0.946 74.045 -0.946 (17.083) (2.533) (14.528) (2.533) Constant 21.112 29.964 -15.980 29.964 (14.426) (2.139) (17.451) (2.139) Number of Observations 427 427 427 427 R2 0.6773 0.6772 0.5385 0.6772 SUR estimates.
Table 5: Percentage of Price Dispersion Explained by Observable and Unobservable Firm Heterogeneities
Model 1 Model 2 Product Name R2 R2 3Com Homeconnect 0.03 0.59 Adobe Acrobat V4.0 0.08 0.63 Adobe Photoshop V5.0.2 0.91 0.98 ATX Motherboard 0.02 0.70 Cassiopeia E-105 0.04 0.58
Creative Labs 3d Blaster Riva TNT2 Ultra 0.06 0.83
Creative Labs Blaster CDRW 4224 0.13 1.00
Creative Labs CDRW 6424 0.13 0.92
Creative Labs PC-DVD Encore 6x 0.05 0.85
Creative Labs PC-DVD RAM 5.2gb SCSI-2 0.08 0.47
Creative Labs Sound Blaster Live Value 0.26 0.79
Creative Labs Video Blaster Webcam 3 0.13 0.50
Diamond Viper V770 Ultra 0.02 0.75
Epsonstylus Color 740 0.07 0.44
Frontpage 2000 0.08 0.64
Half Life 0.10 0.95
HP CD-Writer Plus 8200i 0.08 0.76
Intellimouse Explorer 0.04 0.66
Intel Create & Share Camera Pack USB 0.99 1.00
Money Deluxe 2000 0.04 0.84
Matrox Millennium G400 Max 0.07 0.61
Nikon Coolpix 950 0.10 0.61
Official Red Hat Linux V6.0 0.17 0.78
Olympus C-2000Z 0.25 0.85
Olympus D-340R 0.17 0.82
Paint Shop Pro V5.0 0.03 0.53
Pentium III 450 Chip 0.18 0.79
Pentium III 500 Chip 0.17 0.51
Palm III 0.05 0.73
Palm IIIx 0.12 0.56
Palm V 0.07 0.55
Quicken Deluxe 2000 0.03 0.76
Star Wars Episode I: Racer 0.13 0.48
Star Wars X-Wing Alliance 0.26 0.69
Upgrade Windows 98 1.00 1.00
Virusscan Classic V4.0 0.02 0.73
Endnotes
1 Typical of the first approach are Salop and Stiglitz (1977), Reinganum (1979), and Spulber (1995). Typical of the second approach are Shilony (1977), Rosenthal (1980), Varian (1980), Narasimhan (1988), Baye and Morgan (2001), and Baye and Morgan (forthcoming). Stahl (1989) and Janssen and Moraga (2000) combine both approaches. 2 See also Brynjolfsson and Smith (1999), Stahl (2000), and Bakos (2001).
3 Our paper is also in the spirit of Villas-Boas (1995), who looks at prices for coffee and
saltine crackers and examines whether the empirical distribution of prices is consistent with the theoretical distribution induced by Varian’s model. Baye, Morgan, and Scholten (2001, 2002a,b) also examine comparative static implications of mixed strategy models of price dispersion using data from Internet price comparison sites.
4 See Pratt, Wise and Zeckhauser (1979) and Carlson and Pescatrice (1980) for additional
studies of price dispersion in conventional retail markets. See Brynjolfsson and Smith (2000) and Scholten and Smith (2002) for a studies comparing conventional retail markets and Internet markets.
5 Shapiro and Varian (1999) argue that declining average cost curves are characteristic of many aspects of Internet markets.
6 Shapiro and Varian (1999) argue that cost curves consisting of a fixed cost and a constant (and low) marginal cost characterize many online markets. This type of cost function satisfies the convexity assumption.
7 Ellison and Ellison (2000) find considerable evidence of the use of obfuscation
strategies in selling memory on a rival price comparison site.
8 Of course, the listed price is not the final price that a consumer pays for the item. This final price will typically include shipping and handling charges and possibly tax
depending on the state in which the consumer resides. Both of these costs are variable depending on the bundle of items purchased by the consumer and his state of residence. Thus, we treat the listed price as the relevant price. Calculations of price dispersion where we assume consumers buy only a single item, do not live in the state where the retailer is located, and use the information about shipping costs available on the Shopper.com site to calculate the final purchase price do not lead to qualitatively different results regarding price dispersion nor are the magnitudes of the observed dispersion much affected. See figure 3 for some evidence on this.
9 While we have 9,441 individual price observations, our unit of observation in examining summary statistics of price dispersion is the product-date. This pools all price
observations for a given product on a given date. There are 427 product-dates in our dataset.
10 Each firm's web site also provides consumers with different information. Some firms include a photograph and detailed description of the product offered for sale, while others list only the price and shipping information.
11 On December 20, 2000, Cnet announced that Gomez.com would serve as its new,
that Gomez.com's overall rating systems are based on a 3-star scheme in full-star
increments.
12 As a basis for comparison, Sorensen observes a coefficient of variation of 22% in retail prescription drugs markets.
13 See Baye, Morgan, and Scholten (2001) for a discussion of the theoretical rationale for using the gap measure of price dispersion. Some other researchers use the trimmed range to deal with outliers. Note, however, that the trimmed range has the undesirable property of dropping low-priced outliers, which presumably get a large volume of sales.