Investigating Early Web Size Measures for Web Cost Estimation
Emilia Mendes
Computer Science DepartmentThe University of Auckland Auckland, New Zealand [email protected]
Nile Mosley
Okki Software Auckland, New ZealandSteve Counsell
Computer Science DepartmentBirkbeck College, University of London
London, UK [email protected]
Abstract
This paper’s aim is to bring light to this issue by identifying early size metrics and cost drivers for Web cost estimation based on current practices of several Web Companies worldwide. This is achieved using two surveys and a case study. The first survey (S1) used a search engine to obtain Web project quote forms employed by Web companies worldwide to provide initial quotes on Web development projects. The 133 Web project quote forms gathered data on early size metrics, cost factors, contingency and possibly profit metrics. These metrics were organised into categories and ranked. Results indicated that the two most common early size metrics used for Web cost estimation were “total number of Web pages” (70%) and “which features/functionality to be provided by the application” (66%).
The results of S1 were then validated by a mature Web company that has more than 12 years of experience in Web development and a portfolio of more than 50 Web applications. The analysis was conducted using an interview.
Finally, once the case study was finished, a second validation was conducted using a survey (S2) involving local New Zealand Web companies. The results of both validations were used to prepare Web project data entry forms to gather data on Web projects worldwide. After gathering data on 67 real Web projects worldwide, multivariate regression applied to the data confirmed that the number of Web pages and features/functionality provided by the application to be developed were the two most influential effort predictors.
1. Introduction
The World Wide Web (Web) has become the best known example of a hypermedia system. Numerous organisations world-wide are developing thousands of commercial and/or educational Web applications. Recently, growth of the Web as a delivery environment has given birth to a new research field - Web engineering, so applying engineering principles to develop quality Web applications (Pressman, 2000). A variety of technological solutions are available for Web developers to facilitate the delivery of quality Web applications and bring them quickly to market, with typical durations ranging from 3 to 6 months (Reifer, 2000; Pressman, 2000). However, there are no standardised development techniques or large data sets of historical data on Web development projects.
For Web development, cost is difficult to estimate because:
• There is no standard to sizing Web applications. Each can be created using diverse technologies such as several forms of Java (Java, servlets, Enterprise java Beans, applets, and Java Server Pages), HTML, JavaScript, XML, XSL, and so
on. Attempts have been made to apply Function points principles to sizing Web applications (Rollo, 2000; Mendes et al., 2002), however Mendes et al. did not find any improvement in estimation accuracy using Function points-based size metrics, when compared to other size metrics (e.g. number of Web pages, number of images).
• Web development processes differ substantially from traditional approaches (Reifer, 2002; Baskerville et al., 2003). A recent survey of Web development practices by Barry and Lang (2001) showed that practitioners are not using development processes proposed in the literature (e.g. UML). They often develop their own in-house methods, which often include prototyping.
• Web project’s primary goal is to bring quality applications to market as quickly as possible, varying from a few weeks to 6 months (Pressman, 2000; Reifer, 2002; Offutt, 2002).
• People involved in Web development are represented by less experienced programmers, users as developers, graphic designers and new hires straight from university (Reifer, 2002; Standing, 2002).
• Processes employed are in general ad hoc (Standing, 2002), although some organisations are starting to look into the use of agile methods (Ambler, 2002).
In terms of the types of Web applications we consider for our research, we include two categories of applications which broadly represent the applications delivered using the Web: Web hypermedia applications and Web software applications (Christodoulou et al., 2000). A Web hypermedia application is a non-conventional application characterised by the authoring of information using nodes (chunks of information), links (relations between nodes), anchors, access structures (for navigation) and its delivery over the Web. Technologies commonly used for developing such applications are HTML, JavaScript and multimedia. In addition, typical developers are writers, artists and organisations who wish to publish information on the Web and/or CD-ROM without the need to use programming languages such as Java. These applications have great potential in areas such as software engineering (Fielding and Taylor, 2000), literature (Tosca, 1999), education (Michau et al., 2001), and training (Ranwez et al., 2000).
Conversely, a Web software application represents conventional software applications that depend on the Web or use the Web's infrastructure for execution. Typical applications include legacy information systems such as databases, booking systems, knowledge bases etc. Many e-commerce applications fall into this category. Typically they employ development technologies (e.g., DCOM, ActiveX etc), database systems, and development solutions (e.g. J2EE). Typical developers are young programmers fresh from a Computer Science or Software Engineering degree, managed by more senior staff. The motivation for documenting both types of applications is to help readers understand Section 2 and to avoid misunderstanding.
We use Web application to refer to both Web hypermedia and software applications.
This work investigates metrics that can be used for Web cost estimation at an early stage of a Web development project. One example would be that of estimating effort at the bidding stage, where application requirements are not yet fully-known. Similarly to Kitchenham at al. (2003) we consider a project price quote to have three components: estimated cost,
profit and contingency. We are interested in early metrics used to estimate cost (effort), and therefore leaving aside profit and contingency.
This paper is organised in three parts:
Part I, described in Section 2, provides an overview of Web size metrics aimed at Web cost estimation. This overview is provided such that we can compare it to our findings, discussed in Section 5.
Part II, described in Section 3, presents two surveys, a case study, and how the results of these three investigations were used to inform a research project named Tukutuku. The objective of the first survey (S1) was to identify early size metrics and cost factors for Web cost estimation using data collected from 133 Web project price quote forms from companies worldwide. The sample population was that of Web companies that use Web forms to give price quotes on Web development projects. The gathered metrics were organised into six categories: three (Web application static metrics, Web application dynamic metrics, Cost drivers) consisted of candidates for early size metrics and cost drivers for effort estimation; one (Web project metrics) incorporated metrics we believe can have a bearing on the contingency and/or profit costs that are provided in a price quote (Kitchenham et al., 2003) and to help set priorities and decide on the skills necessary/available to the project; one (Web company metrics) included metrics that characterise a customer; one (Web interface design metrics) contains interface design metrics. The objective of the case study and second survey (S2) was to validate the results obtained in S1. Validation in the scope of our work represents identifying size metrics and cost factors important to be used in the Web cost estimation process early in the development life cycle. The first validation used a case study and consisted of interviewing a mature Web Company. The second validation employed a survey investigation (S2), where the sample population was that of Web companies in New Zealand.
Part III, described in Section 4, presents the results of a multivariate regression analysis using data from 67 industrial Web projects from the Tukutuku database. It also compares the regression analysis results to those presented in Parts I and II. The database used is part of the Tukutuku research project, which aims to gather data from Web companies to benchmark development productivity and to develop cost estimation models. The Web project data entry form employed in the Tukutuku project was prepared based on feedback from S1, S2 and the case study mentioned above. The two out of three effort predictors selected for the best fit regression model correspond very closely to the two highest ranked size metrics from S1 – Web pages and features/functionality.
2. Web size metrics for Web Cost Estimation
To date few papers have proposed Web size metrics aimed at Web cost estimation (Cowderoy, 1998; Mendes et al., 1999; Cowderoy, 2000; Mendes et al., 2000; Reifer, 2000; Rollo, 2000; Cleary, 2000; Mendes et al., 2001). Cowderoy (1998;2000), Reifer (2000) and Cleary (2000) have used industrial data sets of Web projects to justify their size metrics and to generate corresponding cost models, each collecting their data from just one Web company, possibly affecting the external validity of their results. Mendes et al. (2001) proposes size metrics for static and dynamic Web applications and Mendes et al. (2000) proposes size metrics for Web hypermedia applications. However the data sets employed in these studies are based on Web applications developed by students, which may also affect the external validity of their results.
Each of these papers is presented in the following sub-Sections chronologically.
2.1
Size Metrics by Cowderoy1 (1998; 2000)Cowderoy (1998; 2000) recommends several size metrics for cost estimation and risk assessment of Web application development projects. Metrics were organised by the Entities to which they apply.
Web application
Web pages (WP): the number of Web pages in an application
Home pages (HP): the number of major entry points to the Web application
Leaf nodes (LN): the number of leaf Web pages in an application, i.e., pages that have no siblings
Hidden nodes (HN): the number of Web pages excluded from the main navigation buttons
Depth (DE): the number of pages on the second level that have siblings
Application Paragraph count (APC): the sum of Page paragraph count for all Web pages in an application
Delivered images (DI): the number of unique images used by the Web application
Audio files (AF): the number of unique audio files used in a Web application
Application movies (AM): the sum of Page movies for all the Web pages in an application
3d objects (3DO): the number of files including one or more 3D objects used in a Web application
Virtual worlds (VW): the number of files including one or more virtual worlds used in a Web application
External hyperlinks (EH): the number of unique URLs in the Web application Web page
Actions (AC): the number of independent actions provided from a Web page by use of Javascript, Active X and Java applets.
Page paragraph count (PPC): the number of paragraphs in a Web page
Word count (WC): the number of words in a Web page
Navigational structures (NS): the number of different structures in a Web page
Page movies (PM): the number of movie files used in a Web page
Interconnectivity (IN): the number of URLs that link to other pages in the same application Media
Image size (IS): computed as width * height
Image composites (ICS): the number of layers from which the final image was created
Language versions (LV): the number of versions of an image that must be produced to accommodate different languages or different cultural priorities
Duration (DU): summed duration of all sequences within an audio file
Audio sequences (AS): number of sequences within the audio file
Imported images (IMI): the number of separate graphics images imported into an interactive audio file Program
Lines of source code (LOC): the number of lines of code in a program/script
McCabe ciclomatic complexity (MCC) (Fenton and Pfleeger, 1997):the structural complexity of a program/script.
2.2
Size Measures by Mendes et al. (1999; 2000; 2001)Mendes et al. (1999; 2000; 2001) propose size metrics to be used to predict authoring effort for hypermedia applications and then for Web applications. All metrics are presented organised by Entities to which they apply.
Hypermedia application
Hyperdocument size (HS): the number of documents that the hypermedia application has. Documents are considered here to be either HTML files or any kind of file that is defined as a document in the hypermedia systems used in the evaluations.
Connectivity (CON): the number of links that the hypermedia application has. These links can be internal or external. Dynamically generated links are excluded
Compactness (Botafogo et al., 1992) (COM): measures how inter-connected the nodes are)
Stratum (Botafogo et al., 1992) (STR): measures to what degree the hypermedia application is organised for directed reading.
Link Generality (LG): measures if the link applies to a single instance, for example point-to-point links, or whether it applies (or can be applied) to multiple instances.
Later Mendes et al. (2000) proposed a new set of size metrics, all targeting at Web applications:
Page count (PAC): the number of HTML or SHTML files used in a Web application.
Media count (MEC): the number of unique media files used in a Web application.
Program count (POC): the number of CGI scripts, JavaScript files, Java applets used in a Web application.
Total page allocation (TPA): the total space allocated for all HTML or SHTML pages (Mbytes) used in a Web application.
Total media allocation (TMA): total space allocated for all media files (Mbytes) used in a Web application.
Total code length (TCL): total number of lines of code for all programs used in a Web application.
Reused program count (RPC): the number of reused or modified programs used in a Web application.
Total reused media allocation (TRM): total space allocated for all reused media files used in a Web application (Mbytes).
Total reused code length (TRC): total number of lines of code for all programs reused by a Web application.
Code comment length (CCL): total number of comment lines in all programs in a Web application.
Reused code length (RCL): total number of reused lines of code in all programs in a Web application.
Reused comment length (ROL): total number of reused comment lines in all programs in a Web application.
Total page complexity (TPC): the average number of different types of media used in the Web application, excluding text.
Connectivity (CON): measures the total number of internal links, not including dynamically generated links.
Connectivity density (COD): computed as Connectivity divided by page count.
Cyclomatic complexity (Fenton and Pfleeger, 1997) (CCO): computed as Connectivity -page count) + 2.
This list was revised to include also bottom-up metrics (Mendes et al., 2001): Web page
Page allocation (PAL): measures the allocated space of a HTML or SHTML file (Kbytes).
Page complexity (PCO): the number of different types of media used on a page, not including text. Graphic complexity (GRC): the number of graphics media used in a page.
Audio complexity (AUC): the number of audio media used in a page.
Video complexity (VIC): the number of video media used in a page.
Animation complexity (ANC): the number of animations used in a page.
Scanned image complexity (SIC): the number of scanned images used in a page.
Page linking complexity (PLC): the number of links per page. Media
Media duration (MED): the duration of audio, video, and animation (minutes).
Media allocation (MEA): the size of a media file (Kbytes). Program
Program Code length (POL): the number of lines of code in program.
2.3
Size Metrics by Rollo (2000)Rollo (2000) did not suggest any new size metric, however, as far as we know, he was the first researcher to investigate the issues of measuring the size of Web hypermedia and Web software applications, aiming at cost estimation, using several function point analysis methods. He measures the size of two applications in both IFPUG, MKII, and
COSMIC-FFP2 methods. Rollo (2000) concludes that COSMIC-FFP proved to be the most flexible approach for counting the functional size of Web hypermedia and Web software applications and can be applied to any Web application.
2.4
Size Metrics by Cleary (2000)Cleary (2000) proposes size metrics for Web cost estimation dividing them into two types: size metrics for Web hypermedia applications and size metrics for Web software applications.
Web hypermedia application
Non-textual elements (NTE): the number of unique non-textual elements within an application.
Externally sourced elements (ESE): the number of externally sourced elements.
Customised infra-structure components (CIC): the number of customised infra-structure components.
Total Web points (TWP): the total size of a Web hypermedia application in Web points by adding:
o number of Web pages of “Low” complexity multiplied by the value for “Low” Web points; with
o number of Web pages of “Medium” complexity multiplied by the value for “Medium” Web points; with
o number of Web pages of “High” complexity multiplied by the value for “High” Web points. Web software application
Function points (FPS): the functionality of a Web software application. Does not specify any particular method. Web page
Non-textual elements page (NTP): the number of non-textual elements within a Web page.
Words Page (WOP): measures the number of words in a Web page.
Web points (WPP): the length of a Web page. Scale points are “Low”, “Medium” and “High”. Each scale point is attributed a number of Web points, previously calibrated to a specific Web projects data set.
Number of links into a Web page (NIL): the number of incoming links; can be internal or external links.
Number of links out of a Web page (NOL): the number of outgoing links; can be internal or external links.
Web page complexity (WPC): the complexity of a Web page based upon its number of words, and combined number of incoming and outgoing links, plus the number of non-textual elements. The scale points are “Low”, “Medium” and “High”. Value ranges are provided for each scale point, for number of words and combination of incoming links +
outgoing links + non-textual elements. These values have been calibrated based on a specific Web projects data set.
2.5
Size Measures by Reifer (2000)Reifer (2000) proposes a size metric called Web Objects, which measures the number of Web Objects. Size is measured using an adaptation of Halstead’s equation for volume, tuned for Web applications. The equation is as follows:
V = N log2(n) = (N1 + N2) log2 (n1 + n2) (1)
where:
N = number of total occurrences of operands and operators
n = number of distinct operands and operators
N1 = total occurrences of operand estimator
N2 = total occurrences of operator estimators
n1 = number of unique operands estimator
n2 = number of unique operators estimators
V = volume of work involved represented as Web Objects
Operands are comprised of the following metrics:
Number of building blocks (NBB): number of components, e.g., Active X, DCOM, OLE.
Number of COTS (NCO): number of COTS components (including any wrapper code).
Number of multimedia files (NMM): number of multimedia files, except graphics files (text, video, sound etc).
Number of object or application points (Cowderoy et al., 1998; 2000) (NOA): the number of object or application points or others proposed (# server data tables, # client data tables etc).
Number of Lines (NLI): number of xml, sgml, html and query language lines (# lines including links to data attributes).
Number of Web components (NCM): number of applets, agents etc.
Number of graphics files (NGR): number of templates, images, pictures etc.
Number of scripts (NSC): number of scripts for visual language, audio, motion etc.
All size metrics presented in this Section were invariably related to implemented Web applications. Even when targeted at measuring functionality based on function point analysis, researchers only considered the final Web application, rather than requirements documentation generated using any existing Web development methods. This makes their usefulness as early effort predictors questionable. The surveys and case study presented in Section 3 aim to bring light to this issue, not only by identifying early size metrics and cost drivers based on current practices of several Web companies worldwide, but also by comparing these identified metrics to those that have been proposed in the past, looking for possible convergence.
3. Identifying Early Web Size Metrics and Cost Factors for Web Cost Estimation
The purpose of this survey (S1) was to identify early Web size metrics and factors used by Web companies to estimate effort for Web projects early on in the development cycle. The target population was that of Web companies that offer on-line Web project price quotes to customers. There was no need to contact Web companies directly, only to download their on-line Web project price quote forms from the Web.
The four research questions we were interested in answering were as follows:
Question 1. What are the early size metrics and factors used as effort estimators by Web companies? Question 2. Which early size metrics are used the most?
Question 3. Which early size metrics are characteristic of Web hypermedia applications? Question 4. Which early size metrics are characteristic of Web software applications?
Figure 2 – Example of a general Web form with a very simple quote
To obtain a sample of our population of interest, we used a Web search engine (www.google.com) to carry out a search, on the 7th of August 2002, using the sentence “quote Web development project”. Google.com was chosen because at the time it was the fourth most popular search engine in the world, where numbers 1 and 3 both licence Google technology for their Web searches. About half of all Web searches in the world are performed with Google, and is translated into 86 languages.
Our objective was to obtain Web addresses (URLs) for Web companies that had on-line price quotes for Web development projects where these quotes could be used to identify early size metrics and cost factors. Two hundred and fifty nine (259) Web addresses were retrieved. Of those, 38 did not contain any forms or useful description. Of the remaining 221 URLs, 88 presented on-line quotes that were too general to obtain any useful information. An example of a general Web form is given in figure 2.
Survey Results
The data collected from 133 on-line quotes was organised into six categories:
• Web application static metrics
• Web application dynamic metrics
• Cost Drivers
• Web project metrics
• Web company metrics
• Web interface style metrics
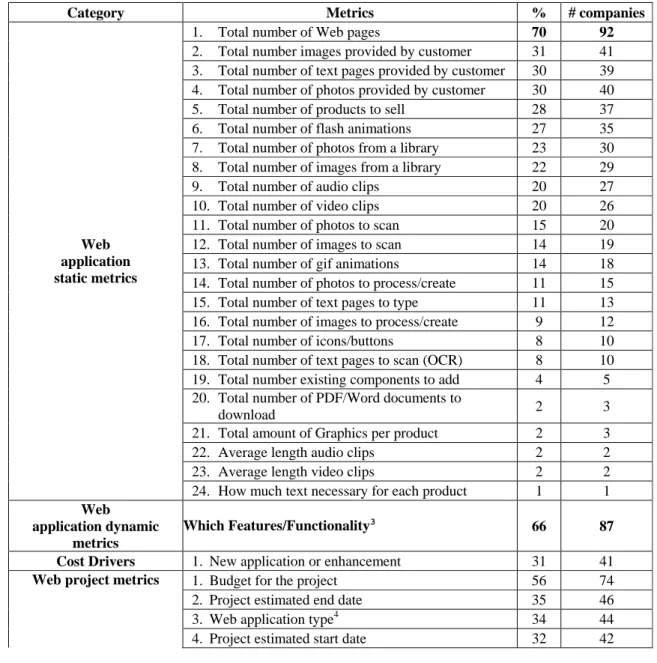
Web application static metrics correspond to attributes that have been commonly used to size Web hypermedia applications (e.g., number of Web pages, number of graphics etc). Web application dynamic metrics refer to any features or functionality mentioned (e.g., database integration, on-line secure order form etc), which is taken as an abstract measure of functionality and therefore size (Fenton and Pfleeger, 1997). Cost drivers correspond to attributes that may influence effort but do not characterise application size. Web project metrics incorporated metrics we believed may have a bearing on the contingency and/or profit costs that are provided in a price quote (Kitchenham et al. 2003) (e.g., project budget). Web company metrics are attributes that characterise a Web company (e.g., target audience), and Web interface design metrics are attributes that characterise the final appearance of the Web application (e.g., background colour, style etc). The full list of metrics per category is given in Table 1. Table 1 also shows the percentage and corresponding number of Web companies that have included that metric in their quote form. Two metrics stood out, total number of Web pages and which features/functionality. Both can be taken as size metrics where the first is a typical length size metric and the second an abstract measure of functionality (Fenton and Pfleeger, 1997).
Seventy four (74) Web companies also asked for the available Web project budget. We believe this metric can have a bearing on the contingency and/or profit costs that are provided in a price quote (Kitchenham et al., 2003). Project estimated end date, project estimated start date and application type also were important. We believe these help set priorities and perhaps decide on what skills are necessary and available to the project.
Table 1 – Metrics organised by category and ranking
Category Metrics % # companies
1. Total number of Web pages 70 92
2. Total number images provided by customer 31 41 3. Total number of text pages provided by customer 30 39 4. Total number of photos provided by customer 30 40 5. Total number of products to sell 28 37 6. Total number of flash animations 27 35 7. Total number of photos from a library 23 30 8. Total number of images from a library 22 29 9. Total number of audio clips 20 27 10. Total number of video clips 20 26 11. Total number of photos to scan 15 20 12. Total number of images to scan 14 19 13. Total number of gif animations 14 18 14. Total number of photos to process/create 11 15 15. Total number of text pages to type 11 13 16. Total number of images to process/create 9 12 17. Total number of icons/buttons 8 10 18. Total number of text pages to scan (OCR) 8 10 19. Total number existing components to add 4 5 20. Total number of PDF/Word documents to
download 2 3
21. Total amount of Graphics per product 2 3 22. Average length audio clips 2 2 23. Average length video clips 2 2
Web application static metrics
24. How much text necessary for each product 1 1
Web
application dynamic metrics
Which Features/Functionality3
66 87
Cost Drivers 1. New application or enhancement 31 41
1. Budget for the project 56 74
2. Project estimated end date 35 46
3. Web application type4 34 44
Web project metrics
4. Project estimated start date 32 42
3 All have been considered as functionality/features for the sake of our ranking. Features/functionality are: Auction/Bid utility, Bulletin
Boards, Discussion Forum/Newsgroups, Chat Rooms, E-postcard, Email-a-Friend, Mailing List for Site, Subscriptions, Vote System, Web-based e-mail, Database creation, Database integration, Other persistent storage integration (e.g. flat files), Credit Card Authorization, Member login, Online Secure Order Form, Password protected pages, Online Content Updating, Online feedback form, Shopping Cart Services, Invoices/ Billing, Calendars/Event Calendar, Display current date, CSS (Style sheets) Charts, File upload/download, HR Handbooks, Job Accounting, Job Scheduling, Specialized Reports, Live data (stock quotes etc), Performance reviews, Time Tracking, Traffic Statistics, Knowledge Base, Language Translation, Page counters, Personalisation, Search Engine, User Guest book, Visitor statistics, Cell Phone Optimisations, Palm PDA Web Clipping.
4
Academic, Corporate, eCommerce, eTrading, Educational, Entertainment, Extranet, Family, Functional, Intranet, Media, Multimedia Presentation, News and Information, Non-Profit, Online community/forum, One Page Presence, Personal, Political, Portal (vertical or horizontal), Professional, Promotional, Search engine, Short-Term Promotion, Small Business, Support site/video chat, Virtual marketplace (B2B)
5. Will customer provide page mock-ups? 4 4 6. Will the application be translated to different
idioms? 3 4
7. Will customer provide website map? 3 4 8. What kind of Internet access most likely for
customers?5 1 1
1. Contact information (e-mail) 100 133 2. Description of company’s business 19 25
Web company metrics
3. Company’s target audience6 18 24
1. What is the preferred style for the site7 17 23 2. Give three URLs for sites you like 17 23
3. What type of colours for the site?8 13 17 4. What type of colours for the background?9 5 7
Web interface style metrics
5. What type of colours for pages?10 5 7
Answering Survey 1 research questions:
• What are the early size metrics and factors used as effort estimators by Web companies?
Size metrics identified in the survey are presented in Table 1, under Web application static metrics and Web application dynamic metrics. Those that have been ranked highest are possibly the most important, given that they were suggested by the greatest number of Web companies. For static metrics, Web companies require from the beginning how much information (text, photos, images), which is “ready to use”, is provided by customers, how much information needs to be digitized or needs to be created from scratch. Number of pages was also important information. We believe this to be the case as most Web companies use number of pages as one of the core components for Web applications (e.g., 5 pages with text only, 5 pages with text, images etc). Regarding dynamic metrics, Web companies listed features and functionality, rather than using a more sophisticated mechanism to measure functionality. This may suggest development practices where functional components are not well defined at the start of the project.
• Which early size metrics are used the most?
According to the survey, the two metrics used the most are total number of Web pages and which features/functionality. Together they represent seventy (70) and sixty-six (66) percent respectively of those Web companies included in the survey. This suggests that they are the two strongest effort predictors obtained from the survey, supported empirically in Section 4. It is interesting to note that total number of Web pages represents a static size metric, characteristic of Web
5
T1 or better, DSL, IDSN, Dial Up (56K), Dial Up (33.6K)
6
Business people and professionals, mainly women, mainly men, teenagers and twenty something, children, students, college or trade schools, anyone and everyone
7
whimsical, bright and vivid, techno-futuristic, gritty, aggressive, mass-consumer oriented, really 'clean' looking, sports-oriented, fun and wacky, for women only, other
8
primary colours, pastel colours
9
solid colour background, image background
10
hypermedia applications and which features/functionality represents more closely an abstract measure of functionality, characteristic of Web software applications. We believe this is an attractive result as it seems to suggest a balance between static and dynamic characteristics which may be present in Web applications. In addition, total number of Web pages has also been the size metrics chosen by most literature described in Section 2. Conversely, the measurement of functionality, as suggested in the previous studies described in Section 2, is quite different from what the survey results suggest.
• Which size metrics are characteristic of Web hypermedia applications?
The category Web application static metrics characterise closely Web hypermedia applications.
• Which size metrics are characteristic of Web software applications?
The category Web application dynamic metrics characterise closely Web software applications.
3.2
Case Study: Validating the results obtained for S1The survey presented in Section 3.1 identified metrics related to a project’s price quote. We apply to our work the same model employed in (Kitchenham et al., 2003), where price is the results of three components: estimated effort, contingency and profit. Since our objective was to identify only those metrics specifically targeted at effort estimation, we employed a case study and a second survey (S2) to identify the subset of metrics obtained in S1 directly related to effort estimation. The case study is presented in this Section and the second survey is presented in Section 3.3.
The case study consisted of contacting an experienced Web company to confirm/deny, based on the ranking provided, those metrics they consider important for early Web cost estimation.
The Web company contacted is based in Rio de Janeiro, Brazil. Five people work in Web design and development within the company. Three of those are company directors, also managing Web projects, preparing quotes for customers and developing applications.
This company was established in 1993 and has to date a portfolio of more than 50 Web applications. They document their development process and record size and effort metrics from past projects. Depending on the type of project, one out of two types of process models are used: prototyping or waterfall. The choice depends on the Company’s familiarity with the application domain. The Company’s effort estimation practices are based solely on expert opinion, where the average estimation accuracy for their Web projects, based on effort estimates obtained early in the life cycle, is 10%.
The types of services they provide are: Web application design, Web application development, Web application enhancement, e-commerce/shopping cart Development, Database Integration, Flash Animation Design, Graphic Design, Web application Maintenance, Training and Consulting.
The types of industry representative of their customers are Finance/Investment/Brokerage, Government, Insurance, Legal, Non-Profit, Telecommunications and Utilities.
One of the directors was contacted by one of the authors to help validate those metrics obtained from S1. As mentioned previously, validation here represents identifying size metrics and cost factors important to be used in the Web cost estimation process early in the development life cycle. Therefore all metrics from S1 selected by the Company director
were actually employed on their Web cost estimation process. This person has worked in software development for more than 20 years and is experienced in management of large projects, conventional or Web-based.
For Web application static metrics agreement was reached for most metrics (from number 1 to 18, see Table 1). More were added to the list, and some were re-arranged, as presented in Table 2.
For Web application dynamic metrics more features/functionality were added to the list and the director suggested that adding a complexity level to each feature/functionality would help discern more difficult implementations. More specifically, this Company groups functions/features within three groups: simple, complex and very complex. Each has an associated baseline, which represents a percentage to be added to estimated effort. The Company’s baselines reflect average percentages based on past experience. These metrics were also confirmed as suitable for early Web cost estimation.
For Web Project metrics, numbers 1, 2, 3 and 4 (see Table 1) are employed by the Company for deciding on a project’s contingency/risks and profit components (1,2 and 4 for profit and 3 for risks/contingency). Therefore, these metrics are important for pricing, however not for effort estimation.
For Web company metrics, number 2 (see Table 1) is also taken into consideration for deciding on a project’s profit component.
Table 2 – Size metrics after first validation
Size metrics
Total number of Web pages in the Web applicationNumber of Web pages created from scratch (new Web pages) Number of Web pages provided by the customer
Number of outsourced Web pages
Total number of text pages (A4 size) that had to be typed: (Take each A4 Page to be 600 words)
Number of text pages provided by the customer in electronic format
Web page
s
Number of text pages provided by the customer that had to be scanned with OCR Total number of new images/photos created: (images also include icons and buttons) Number of images/photos provided by the customer in electronic format
Number of images/photos provided by the customer that need to be scanned Total number of images obtained from an image/photo library or outsourced Total number of new animations (Flash/gif/3D etc) created from scratch
Total number of animations (Flash/gif/3D etc) obtained from a library or outsourced Total number of new audio/video clips created
Total number of audio/video clips obtained from a audio/video library or outsourced
G
raphi
cs
Total number of products to sell
None of the Web interface design metrics were seen as relevant for effort estimation.
Jørgensen and Sjøberg (2001) found that the Web companies they have interviewed place a strong emphasis on interface design and this activity incorporates a large amount of the total effort spent in developing an application. The metrics we have obtained as a result of our first survey (S1) and validated by the mature Web company corroborate their findings. Table 2 shows under the “graphics” group several size metrics that are directly related to interface design and the
implementation of graphics to be added to a given Web application. Although none of the “graphics” metrics identified using S1 have been used by more than 31% of the Web forms we used, they were confirmed as important effort predictors by the mature Web company and by all Companies that participated in the second survey (S2), to be described in the next Section.
3.3
Survey S2: Validating the results obtained for S1The purpose of this second survey was also to validate the results that have been obtained from S1. We have also considered in this survey some of the results obtained from the case study, more specifically regarding Web application dynamic metrics.
The target population was that of Web companies in New Zealand that estimate effort for their Web projects. The survey instrument was a questionnaire with nine questions was prepared by one of the authors, and the method of gathering data was via interviews over the phone. A pilot study involving three Web companies from overseas was used to validate a previous version of this questionnaire. Based on their feedback it was decided that the questionnaire should not have too many questions in order to engage as many Web Companies as possible to participate. We have also discussed the possibility of using a Web-based on-line questionnaire instead, and emailing invitations to Web companies in New Zealand, followed by a telephone call. However, this choice was discarded since nowadays Companies in general often receive many, even hundreds of unsolicited emails, which we believe would reduce dramatically the chances of obtaining volunteers for our survey, even if we employed a follow-up telephone call.
Contact information was obtained for 100 Web companies in New Zealand, using the NZ Yellow pages. 32 Companies (32%) accepted to be interviewed. Remaining companies declined the invitation on the basis of being busy, or not interested. The questionnaire took on average 15 to 20 minutes to answer.
We organised the Web application static size metrics into four categories (e.g. Web pages, Images/photos, animations and audio/video clips) and provided more general questions, such as the one presented below. This was done in order to have a simpler and smaller questionnaire.
Question 1. If you use application size to estimate the effort to develop a Web application, what aspects of size do you consider?
. The size of the application in number of images/photos.
. The size of the application in number of animations (Flash/gif/3D/2D). . The size of the application in number of audio/video clips.
. The size of the application in number of Web pages.
. Other? ________________________________________________
All the 32 companies use all four categories of size to estimate effort to develop a Web application.
In relation to the Web application dynamic metrics, rather than listing all functions/features we obtained from S1 and the case study, we chose to ask the following two questions:
Question 2. If you use the functions/features to be added to a Web application to estimate the effort to develop this application, how do you identify what functions/features to develop?
. Do you give clients a list of functions/features and ask them to pick the ones they want? . Do you ask clients what they want without using a list or offering suggestions?
. Do you ask clients what they want and offer suggestions without using a list? . Other? ___________________________________________________________
Question 3. Do you differentiate between complex and simple functions/features to estimate effort? Yes No
For question number two, 19 companies (59%) provide a list of functions/features for clients to choose from. 13 companies (41%) ask clients what functions/features they want and offer suggestions without using a list.
For question number three, seven companies (22%) differentiate between complex and simple functions/features to estimate effort. However, the remaining 25 (78%) assume all functions/features to have the same complexity.
The remaining six questions used in our questionnaire are as follows: Question 4. How many people work in your Company?
Question 5. Do you generally prepare a quote for a project or do you charge by time? Question 6. Do you refine your effort estimate later on in the development?
Question 7. What factors do you use to estimate the effort for a project? (a) Size of the application
(b) Functions/features to be offered by the application
(c) Experience of the developers with the development environment (d) Development tools used
(e) Project Budget
(f) Project estimated end date (g) Project estimated start date (h) Web application type
(i) What is the preferred style for the site (j) What type of colours for the site (k) What type of colours for the background (l) What type of colours for pages
(m) Customer will provide page mock-ups
(n) Application will be translated to different idioms (o) Customer will provide website map
(p) Internet access most likely for customers (q) Description of company’s business (r) Company’s target audience
(s) Other(s): ______________________________________
Question 8. Do you use the same factors to estimate effort for new and enhancement projects? Question 9. At what phase of a project does your Company prepare an initial effort estimate?
(a) Before Requirements gathering phase (b) During Requirements gathering phase (c) After Requirements gathering phase (d) During Design phase
(e) After Design phase
(f) During Implementation phase
(g) Other(s): ______________________________________
The sequence that was actually used during the interview is provided in the Appendix.
Relative to question four, Figure 3 shows a histogram for number of people per Company. The companies surveyed had from one person to 20 people, with median of 4.5 and mean of 5.44. 16 Companies (50%) have no more than four people, and 25 companies (78.1%) have no more than six people, suggesting that Web companies may fit the profile of small companies.
For question five, 30 Companies (94%) always charge by project and the other two (6%) charge by time spent.
For question six, 12 Companies (38%) do not refine their effort estimate, whereas the remaining 20 (62%) refine their estimates, although not often. This may indicate that at least the Web companies we surveyed use their initial effort estimate as their “final” effort estimate and adjust their work to fit their initial estimate. Our results corroborate those of Jørgensen and Sjøberg (2001).
Figure 3 – Histogram of Number of people per Company
Number of people 20 16 10 8 7 6 5 4 3 2 1 Frequency 7 6 5 4 3 2 1 0
For question seven, eight companies (25%) used size, functions/features, experience and tools. The remaining 24 companies (75%) all used size and functions/features. However only occasionally experience and tools were used as the people involved in Web development projects would remain unchanged and so would the tools employed. None of the Web project metrics, Web Company metrics or Web interface design metrics were selected as factors used for effort estimation. Eight Companies (25%) also suggested an extra factor they employ when preparing an effort estimate: how well known the requirements are. We believe that for early effort estimation, most notably for effort estimation to be used at the bidding stage (Kitchenham et al., 2003), this factor would have similar value throughout projects since early on in a project requirements are seldom well known.
Table 3 – S2 Metrics organised by category
Category Metrics % # companies
1. Total number of Web pages 100 32
2. Total number of images/photos (images also include icons
and buttons) 100 32
3. Total number of animations (Flash/gif/3D etc) 100 32 Web
application static metrics
4. Total number of audio/video clips 100 32 Web
application dynamic
metrics
Which Features/Functionality 100 32
1. New application or enhancement 59 19
2. Experience of development team 25+ 8+
Cost Drivers
3. Tools employed 25+ 8+
1. Budget for the project 0 0
2. Project estimated end date 0 0
3. Web application type 0 0
4. Project estimated start date 0 0
5. Will customer provide page mock-ups? 0 0
6. Will the application be translated to different idioms? 0 0
7. Will customer provide website map? 0 0
Web project metrics
8. What kind of Internet access most likely for customers? 0 0
1. Description of company’s business 0 0
Web Company
metrics 2. Company’s target audience 0 0
1. What is the preferred style for the site 0 0
2. What type of colours for the site? 0 0
3. What type of colours for the background? 0 0 Web Interface
Design metrics
4. What type of colours for pages? 0 0
For question eight, 13 Companies (41%) answered that they always consider the same factors for estimating effort for new or enhancement projects; nine Companies (28%) use different factors and 10 Companies (31%) sometimes employ the same factors for either new or enhancement projects and sometimes employ different factors. If we relate these answers to
those of question seven, we can argue that size and functions/features are factors used by all Companies when estimating effort for either new or enhancement projects. What differs is the use of experience and/or tools.
For question nine, 10 Companies (32%) prepare an effort estimate during the Requirements gathering phase and 20 Companies (62%) prepare an effort estimate during the Design phase. Two Companies (6%) did not answer this question since they do not have to provide customers with effort estimates, i.e., customers always pay for the Companies’ actual effort.
The results of our second survey are summarised in Table 3.
3.4
Using Feedback to Inform the Tukutuku Benchmarking ProjectThe feedback obtained from Surveys 1 and 2 and the case study was used to prepare Web forms to gather data on Web projects worldwide. This data gathering initiative was called the Tukutuku benchmarking project11. The Tukutuku project aims to gather data on Web projects worldwide to be used to develop Web cost estimation models based on early effort predictors and to benchmark productivity across and within Web Companies.
While preparing the project data entry forms used in Tukutuku, careful consideration was given to differentiate more complex features/functions from less complex ones, as this was the current practice of some of the Web companies surveyed in S2 and also by the mature Web company from our case study. We had a detailed list of features/function obtained from S1 and the case study. Although some certainly seemed more complex than others we did not want to suggest or impose any complexity, leaving it for each Web company to decide. The solution was devised as follows:
• Companies contributing Web project data to Tukutuku would be asked to indicate (tick) all the features/functions that the application has.
• For each feature/function they would also indicate if it was a black box reuse, reuse with adaptation, or new development.
• They were also asked to indicate if a given feature/function employed high effort to be developed/adapted.
• To be familiar with what each Company understood by high effort we also asked them to indicate the effort in person hours that would be automatically representative of high effort to develop or adapt a feature/function.
• Companies would be able to provide features/functionality that we had not considered.
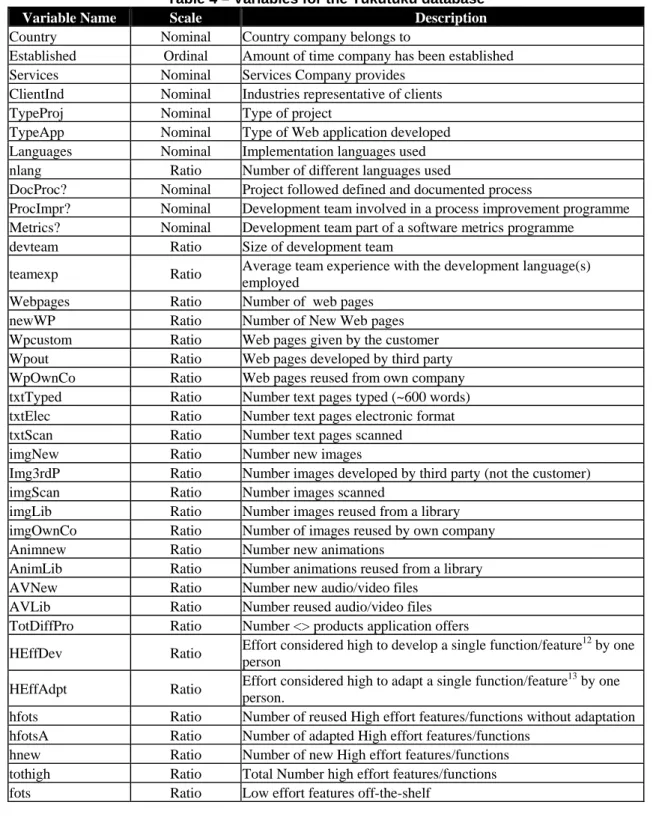
The Tukutuku Benchmarking project started officially on October 2002. Invitation letters were e-mailed to Web companies in different countries and, in some cases (e.g. New Zealand, UK) with a follow up phone call a few days later, seeking participation. To date we have received 67 Web projects from 25 Web companies in 9 different countries. 27 projects come from two companies (13 and 14 respectively). Each Web project in the database provided 43 variables to characterise a Web application and its development process (see Table 4). We are aware that the data obtained is a result of a self-selected sample. However we believe the data in the Tukutuku database can be very useful as an indicator, provided one is aware of the limitations.
Table 4 – Variables for the Tukutuku database
Variable Name Scale Description
Country Nominal Country company belongs to
Established Ordinal Amount of time company has been established Services Nominal Services Company provides ClientInd Nominal Industries representative of clients
TypeProj Nominal Type of project
TypeApp Nominal Type of Web application developed Languages Nominal Implementation languages used nlang Ratio Number of different languages used
DocProc? Nominal Project followed defined and documented process
ProcImpr? Nominal Development team involved in a process improvement programme Metrics? Nominal Development team part of a software metrics programme
devteam Ratio Size of development team
teamexp Ratio Average team experience with the development language(s) employed
Webpages Ratio Number of web pages newWP Ratio Number of New Web pages Wpcustom Ratio Web pages given by the customer Wpout Ratio Web pages developed by third party WpOwnCo Ratio Web pages reused from own company txtTyped Ratio Number text pages typed (~600 words) txtElec Ratio Number text pages electronic format txtScan Ratio Number text pages scanned
imgNew Ratio Number new images
Img3rdP Ratio Number images developed by third party (not the customer) imgScan Ratio Number images scanned
imgLib Ratio Number images reused from a library imgOwnCo Ratio Number of images reused by own company Animnew Ratio Number new animations
AnimLib Ratio Number animations reused from a library AVNew Ratio Number new audio/video files
AVLib Ratio Number reused audio/video files TotDiffPro Ratio Number <> products application offers
HEffDev Ratio Effort considered high to develop a single function/feature
12 by one
person
HEffAdpt Ratio Effort considered high to adapt a single function/feature
13 by one
person.
hfots Ratio Number of reused High effort features/functions without adaptation hfotsA Ratio Number of adapted High effort features/functions
hnew Ratio Number of new High effort features/functions tothigh Ratio Total Number high effort features/functions fots Ratio Low effort features off-the-shelf
11 http://www.cs.auckland.ac.nz/tukutuku
12 this number is currently set to 15 hours based on the collected data. 13 this number is currently set to 4 hours based on the collected data.
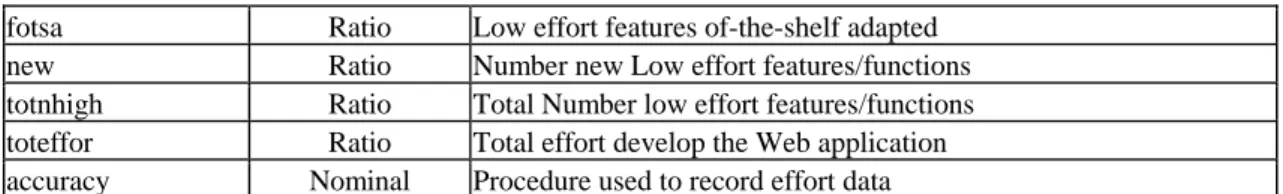
fotsa Ratio Low effort features of-the-shelf adapted new Ratio Number new Low effort features/functions totnhigh Ratio Total Number low effort features/functions toteffor Ratio Total effort develop the Web application accuracy Nominal Procedure used to record effort data
No automated measurement tools were used by the Web companies that volunteered data for the Tukutuku database. Therefore the accuracy of their data cannot be determined. In order to identify guesstimates from more accurate effort data, we asked companies how their effort data was collected (see Table 5).
Two companies used different data collection levels depending on the type of project (i.e. they used level 1 for some projects and levels 3 and 4 for other projects). Of the two companies that volunteered more than 10 projects, one used level 3 to record effort for all its 13 projects and the other used level 4 to record effort for all of its 14 projects. At least for 77.6% of Web projects in the Tukutuku database effort values were based on more than guesstimates. However, we are also aware that the use of timesheets does not guarantee 100% accuracy in the effort values recorded.
Table 5 – What Effort Data Was Gathered
effort data Scale Number of Projects and Companies
# and % projects # different companies
No timesheets 1 12 (17.9%) 8
Total hours worked each day or week 2 3 (4.5%) 3 Hours worked per project per day/week 3 24 (35.8%) 12 Hours worked per project task per day 4 28 (41.8%) 8
The data collected to date for the Tukutuku project has not followed rigorous quality assurance procedures to validate the data and the projects’ application domains are mixed.
4. Using Multivariate Regression to Identify Early Web Size Metrics and Cost Factors
All the statistical analyses reported in this paper were accomplished using SPSS v.10.01.The technique employed to build the cost model presented in this paper was forward stepwise regression.
The set of variables used for building the cost models is shown in Table 6. This is a subset of the Tukukuku data set since several variables had to be excluded if they were within the following constraints:
• Most instances of a variable were zero.
• The variable was categorical.
• The variable was related to another variable, in which case both could not be included in the same model. This was investigated using a Spearman’s rank correlation analysis (α = 0.05).
Whenever variables were highly skewed they were transformed to a natural logarithmic scale to approximate a normal distribution (Maxwell, 2002). In addition, whenever a variable needed to be transformed but had zero values, the natural logarithmic transformation was applied to the variable’s value after adding 1.
Table 6 – Variables Used in the Stepwise Regression
Variable Meaning
lntoteff Natural log. of the total effort to develop a Web application. nlang Number of different languages used on the project
devteam The number of people who worked on the project
teamexp Average team experience with the development language(s) employed lnnewwp Natural log. of (1+ number of new Web pages)
lnimgnew Natural log. of (1+ number of new images in the applications) lnimglib Natural log. of (1+ total number of images reused from a library) lnimg3p Natural log. of (1+ total number of images developed by a third party) hfotsa Total number of adapted high effort functions.
lntoth Natural log. of (1+ total number of high effort functions). totnhigh total number of low effort functions
Natural log. = Natural logarithm
The cost model presented here was initially proposed and detailed in Mendes and Kitchenham (2004). The model’s stability was verified using two steps, which were (Maxwell, 2002):
Step 1. Use a residual plot showing residuals vs. fitted values to investigate if the residuals are random and normally distributed.
Step 2. Calculate Cook’s distance values for all projects to identify influential cases. Any projects with distances higher than 4/n, where n represents the total number of projects, were considered to have high influence on the results. When there were projects with high influence the stability of the model was tested by removing these projects, and observing the effect their removal had on the model.
The cost model is presented in Table 7. Its adjusted R2 was 0.67
Table 7 - Best Fitting Model to calculate lntoteff
Independent Variables Coefficient Std. Error t p>|t| 95% Confidence Interval (constant) 2.154 0.260 8.281 0.000 1.634 – 2.674
lnnewwp 0.435 0.061 7.184 0.000 0.314 – 0.556
lntoth 0.671 0.160 4.198 0.000 0.352 – 0.991
devteam 0.239 0.083 2.876 0.005 0.073 – 0.406
The equation as read from the final model’s output is:
which, when transformed back to the raw data scale, gives the equation:
toteffor = 8.619 ×× (newWP+1)0.435× (tothigh+1)0.671××e0.239 ×× devteam (2) When there is no reuse, Webpages is the same as newWP.
The model’s prediction accuracy was checked by using the ‘omit one project at a time’ procedure (leave one out cross-validation). The rationale is to use different sets of projects to build and to validate a model. Projects used to build a model are called the training set and projects used to validate the model are called the validation set. The prediction accuracy of the model was tested on the raw data, using accuracy statistics such as MMRE, Median MRE, Pred(25), the median and mean absolute residuals, and the Companies own estimates (based on an educated guess).
In relation to Companies estimates, their accuracy rate is overall 61.09%, and all underestimates.
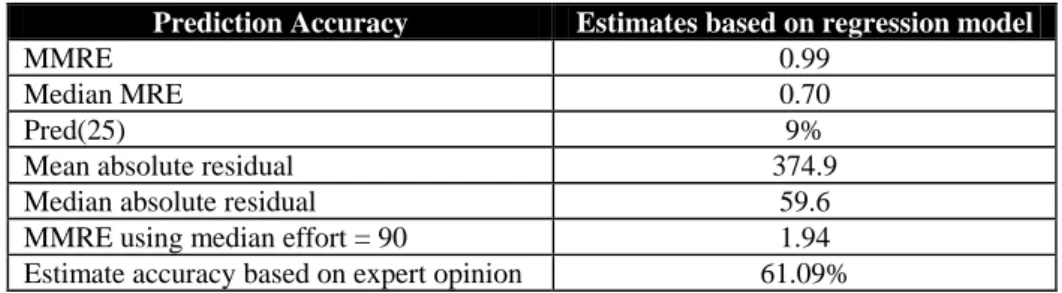
Table 8 - Prediction accuracy statistics (Mendes and Kitchenham, 2004)
Prediction Accuracy Estimates based on regression model
MMRE 0.99
Median MRE 0.70
Pred(25) 9%
Mean absolute residual 374.9
Median absolute residual 59.6
MMRE using median effort = 90 1.94 Estimate accuracy based on expert opinion 61.09%
The prediction accuracy statistics are presented in Table 8, where we can see that the model’s prediction accuracy was worse than the mean estimate accuracy provided using expert opinion, which was 61.09% (underestimate). Its accuracy was not significantly different from predictions based on the median of the data set (median = 90), confirmed by their MMREs and the Wilcoxon matched-paired signed rank test (α=0.05). This results suggest that the data set is not homogeneous and there are possibly several outliers, which would explain the differences between values obtained for medians and means, for the MREs and absolute residuals.
Despite this cost model not presenting a good estimation accuracy, its main objective in the context of this paper is to indicate that two of the variables selected by the best fit model are a very close match to the two variables ranked highest in our first survey (S1) – number of Web pages and number of high effort features/functions. We believe this result to be very promising, suggesting that these metrics can be estimated by customers early in the development life cycle and are suitable for building Web cost models at, for example, the bidding stage. Note that to obtain the number of high effort functions it is necessary to provide the client with a list of high effort functions and to count those that have been selected. In addition, the development team size must be already known by the Web company.
Finally, in relation to the size metrics and cost drivers that were presented in Section 2, number of Web pages have been proposed previously as a size metric useful for Web cost estimation. This same metric was identified by our survey S1 as a strong candidate for effort prediction and our model has also selected number of new Web pages. Any of the function-orientated metrics presented in Section 2 were always geared towards measuring functionality using a function points-like approach (e.g. Full-function points, Object points). Our results show that a simpler approach represented simply by a list of features/functions that require high effort to develop from scratch or adapt seems sufficient for early cost estimation, at least based on the data we have gathered. Finally, our model selected the number of people in the development team as a cost driver. It also shows that more people in a project use more effort, comparatively than less people in a project.
This paper investigated early metrics that can be used for Web cost estimation at an early stage of a Web development project. One example would be that of estimating effort at the bidding stage, where application requirements are not yet fully-known.
Section 2 provided an overview of Web size metrics aimed at Web cost estimation. This overview was then compared to our findings, in Section 5.
Section 3 presented two surveys, a case study, and how the results of these three investigations were used to inform a research project named Tukutuku. The objective of the first survey (S1) was to identify early size metrics and cost factors for Web cost estimation using data collected from 133 Web project price quote forms from companies worldwide. The sample population was that of Web companies that use Web forms to give price quotes on Web development projects. The gathered metrics were ranked and organised into six categories: Web application static metrics, Web application dynamic metrics, Cost drivers, Web project metrics, Web company metrics, and Web interface design metrics. The two most used metrics, according to the ranking, were “total number of Web pages” and “features/functionality to be provided by the application”, where the former was used 70% of the time and the latter was used 66% of the time.
A case study and a second survey (S2) were then used to validate the results obtained in S1. Validation in the scope of our work represented identifying size metrics and cost factors important to be used in the Web cost estimation process early in the development life cycle.
The first validation, a case study, consisted of interviewing a mature Web Company. The second validation employed a survey investigation (S2), where the sample population was that of Web companies in New Zealand. 32 Web companies participated in S2. The feedback obtained from Surveys 1 and 2 and the case study was used to prepare Web project data entry forms to gather data on Web projects worldwide. This data gathering initiative was called the Tukutuku benchmarking project14. After gathering data on 67 industrial Web projects worldwide we conducted a multivariate regression analysis in order to identify which variables would be selected by the best model fit and to compare these results to those from S1. The two out of three effort predictors selected for the best fit regression model correspond very closely to the two highest ranked size metrics from S1 – Web pages and features/functionality.
We believe this result to be very promising, suggesting that these metrics can be estimated by customers early in the development life cycle and are suitable for building Web cost models at, for example, the bidding stage.
As part of our future work we are gathering more data on Web projects in order to further the studies presented herein and also to benchmark development productivity and to compare prediction accuracy between cross-company cost models and models built using data from a single company (within-company models).
5. Acknowledgments
We would like to thank Dr. Chris Triggs for his help during the initial stage of the survey, Mr. Marcos Villas for all his help in the Tukutuku benchmarking project and Dr. Khaled El-Emam for forwarding on our invitation letter to Web companies in Canada. We would also like to thank all those companies that have volunteered data on their Web projects.
6. References
Ambler, S.W. 2002. Lessons in Agility from Internet-Based Development, IEEE Software, Mar.-Apr. : 66--73.
Barry, C., and Lang, M., 2001. A Survey of Multimedia and Web Development Techniques and Methodology Use, IEEE Multimedia, 8:2:52--60, Apr-Jun 2001.
Baskerville, R.; Ramesh, B.; Levine, L.; Pries-Heje, J.; Slaughter, S. 2003. Is internet-speed software development different?, IEEE Software, 20(6), 70—77, November-December.
Botafogo, R., Rivlin, A.E. and Shneiderman, B. 1992. Structural Analysis of Hypertexts: Identifying Hierarchies and Useful Metrics, ACM TOIS,10:2:143--179.
Christodoulou, S. P., Zafiris, P. A., Papatheodorou, T. S. 2000. WWW2000: The Developer's view and a practitioner's approach to Web Engineering, Proc. 2nd ICSE Workshop Web Eng. 75--92.
Cleary, D. 2000. Web-based development and functional size measurement. Proc. IFPUG 2000 Conference.
Cowderoy, A.J.C., Donaldson, A.J.M., Jenkins, J.O. 1998. A Metrics framework for multimedia creation, Proc. 5th IEEE International Software Metrics Symposium, Maryland, USA.
Cowderoy, A.J.C., 2000. Measures of size and complexity for web-site content, Proc. Combined 11th ESCOM Conference and the 3rd SCOPE conference on Software Product Quality, Munich, Germany, 423--431.
Fenton, N. E. and Pfleeger, S. L. 1997. Software Metrics, A Rigorous & Practical Approach, 2nd edition, PWS Publishing Company and International Thomson Computer Press.
Fielding, R.T., and Taylor, R.N. 2000. Principled design of the modern Web architecture. Proc. ICSE. ACM. New York, NY, USA, 407--416.
Jørgensen, M. and Sjøberg, D. 2001. Impact of Effort Estimates on Software Project Work, Information and Software Technology, 43:939--948.
Kitchenham, B.A., Pickard, L., Linkman, S., and Jones, P. Modelling Software Bidding Risks, Transactions on Software Engineering, 29:6:542--554, June 2003.
Mendes, E., and Kitchenham, B.A. 2004. Further Comparison of Cross-company and Within-company Effort Estimation Models for Web Applications, submitted manuscript.
Mendes, E., and Mosley, N. 2000. Web Metrics and Development Effort Prediction, Proc. ACOSM 2000, Sydney, Australia.
Mendes, E., Hall, W., Harrison, R. Applying measurement principles to improve hypermedia authoring, New Review of Hypermedia and Multimedia, 5:105--132, Taylor Graham Publishers. 1999.
Mendes, E., Mosley, N., and Counsell, S. 2001. Web Metrics – Estimating Design and Authoring Effort. IEEE Multimedia, Special Issue on Web Engineering, Jan.-Mar., 50--57.
Mendes, E., Mosley, N., and Counsell, S., 2002. Comparison of Length, complexity and functionality as size measures for predicting Web design and authoring effort, IEE Proc. Software, 149:3:86--92.
Michau, F., Gentil, S., and Barrault, M. 2001. Expected benefits of web-based learning for engineering education: examples in control engineering. European Journal of Engineering Education, 26:2:151--168, June.
Offutt, J. 2002. Quality attributes of Web software applications, IEEE Software, 19:2: 25-32, Mar/Apr 2002. Pressman, R.S. What a tangled web we weave. IEEE Software, (Jan/Feb), 2000,18--21.
Ranwez, S., Leidig, T., and Crampes, M. 2000. Formalization to improve lifelong learning. Journal of Interactive Learning Research, 11:3-4:389--409. Publisher: Assoc. Advancement Comput. Educ, USA.
Reifer, D.J. Web development: estimating quick-to-market software. IEEE Software, (Nov/Dec), 2000, 57-64. Rollo, T. 2000. Sizing e-commerce. Proc. ACOSM 2000, Sydney, Australia.
Standing, C. 2002. Methodologies for Developing Web Applications. Information and Software Technology, 44, 151--159.
Tosca, S.P. 1999. The lyrical quality of links hypertext, Proc. 10th ACM Hypertext Conference. ACM. 217--218.
Note. The data set can be made available to the reviewers for independent assessment of the statistical analyses presented in this paper but cannot be published for confidentiality reasons. Please contact Emilia Mendes at
Appendix
Q 1. How many people work in your Company?
Q 2. At what phase of a project does your Company prepare an initial effort estimate? a. Before Requirements gathering phase
b. During Requirements gathering phase c. After Requirements gathering phase d. During Design phase
e. After Design phase f. During Implementation phase
g. Other(s): ______________________________________ Q 3. What factors do you use to estimate the effort for a project?
a. Size of the application
b. Functions/features to be offered by the application
c. Experience of the developers with the development environment d. Development tools used
e. Project Budget
f. Project estimated end date g. Project estimated start date h. Web application type
i. What is the preferred style for the site j. What type of colours for the site k. What type of colours for the background l. What type of colours for pages
m. Customer will provide page mock-ups
n. Application will be translated to different idioms o. Customer will provide website map
p. Internet access most likely for customers q. Description of company’s business r. Company’s target audience
s. Other(s): ______________________________________
Q 4. Do you use the same factors to estimate effort for new and enhancement projects?
Q 5. If you use application size to estimate the effort to develop a Web application, what aspects of size do you consider?