THE INFLUENCE OF NATIVE WHEAT LIPIDS ON THE RHEOLOGICAL PROPERTIES AND MICROSTRUCTURE OF DOUGH AND BREAD
by
SHERRILL LYNE CROPPER
B.S., The Ohio State University, 2006 M.S., The Ohio State University, 2008
AN ABSTRACT OF A DISSERTATION
submitted in partial fulfillment of the requirements for the degree
DOCTOR OF PHILOSOPHY
Department of Grain Science and Industry College of Agriculture
KANSAS STATE UNIVERSITY Manhattan, Kansas
Abstract
Bread quality and final crumb grain are reflective of the ability for wheat flour dough to retain and stabilize gas cells during the baking process. The visco-elastic properties of dough allow for the incorporation of air cells and expansion during fermentation and baking. The gluten-starch matrix provides the backbone support. However, following the end of proofing and during the beginning of baking, the structure weakens due to over-extension and expansion and the matrix begins to separate and eventually break down. Native wheat lipids, which are found in small quantities in wheat flour, provide a secondary support for gas cell stabilization because of their amphiphilic characteristics and ability to move to the interface and form condensed
monolayers. The objectives of this research were to evaluate the influence of native wheat lipids on the rheological properties of dough and the microstructure of bread.
Native wheat lipids were extracted from straight-grade flour and separated into total, free, bound, nonpolar, glycolipids, and phospholipids using solid-phase extraction (SPE) with polar and nonpolar solvents. Defatted flour was reconstituted using each lipid fraction at a range of levels between 0.2% and 2.8%. Dough and bread were made following AACC Method 10-10.03. Rheological testing of the dough and evaluation of the microstructure of the bread was conducted using small and large deformation testing, C-Cell imaging, and x-ray microtomography analysis to determine changes in visco-elastic properties and gas cell structure and distribution.
Rheological assessment through small amplitude oscillatory measurements demonstrated that nonpolar, phospholipids, and glycolipid fractions had a greater interaction with both proteins and starch in the matrix, creating weaker dough. Nonpolar, phospholipids, and glycolipids, varied in their ability to stabilize gas cells as determined by strain hardening index. C-Cell imaging and x-ray microtomograpy testing found that treatments containing higher
concentrations of polar lipids (glycolipids and phospholipids) had a greater effect on overall loaf volume, cell size, and distribution. This illustrates that level and type of native wheat lipids influence the visco-elastic properties of dough and gas cell size, distribution, cell wall thickness, and cell stability in bread.
THE INFLUENCE OF NATIVE WHEAT LIPIDS ON THE RHEOLOGICAL PROPERTIES AND MICROSTRUCTURE OF DOUGH AND BREAD
by
SHERRILL LYNE CROPPER
B.S., The Ohio State University, 2006 M.S., The Ohio State University, 2008
A DISSERTATION
submitted in partial fulfillment of the requirements for the degree
DOCTOR OF PHILOSOPHY
Department of Grain Science and Industry College of Agriculture
KANSAS STATE UNIVERSITY Manhattan, Kansas
2015
Approved by: Approved by:
Co-Major Professor Co-Major Professor
Copyright
SHERRILL LYNE CROPPER 2015
Abstract
Bread quality and final crumb grain are reflective of the ability for wheat flour dough to retain and stabilize gas cells during the baking process. The visco-elastic properties of dough allow for the incorporation of air cells and expansion during fermentation and baking. The gluten-starch matrix provides the backbone support. However, following the end of proofing and during the beginning of baking, the structure weakens due to over-extension and expansion and the matrix begins to separate and eventually break down. Native wheat lipids, which are found in small quantities in wheat flour, provide a secondary support for gas cell stabilization because of their amphiphilic characteristics and ability to move to the interface and form condensed
monolayers. The objectives of this research were to evaluate the influence of native wheat lipids on the rheological properties of dough and the microstructure of bread.
Native wheat lipids were extracted from straight-grade flour and separated into total, free, bound, nonpolar, glycolipids, and phospholipids using solid-phase extraction (SPE) with polar and nonpolar solvents. Defatted flour was reconstituted using each lipid fraction at a range of levels between 0.2% and 2.8%. Dough and bread were made following AACC Method 10-10.03. Rheological testing of the dough and evaluation of the microstructure of the bread was conducted using small and large deformation testing, C-Cell imaging, and x-ray microtomography analysis to determine changes in visco-elastic properties and gas cell structure and distribution.
Rheological assessment through small amplitude oscillatory measurements demonstrated that nonpolar, phospholipids, and glycolipid fractions had a greater interaction with both proteins and starch in the matrix, creating weaker dough. Nonpolar, phospholipids, and glycolipids, varied in their ability to stabilize gas cells as determined by strain hardening index. C-Cell imaging and x-ray microtomograpy testing found that treatments containing higher
concentrations of polar lipids (glycolipids and phospholipids) had a greater effect on overall loaf volume, cell size, and distribution. This illustrates that level and type of native wheat lipids influence the visco-elastic properties of dough and gas cell size, distribution, cell wall thickness, and cell stability in bread.
Table of Contents
List of Figures ... xi
List of Tables ... xiv
Acknowledgements ... xv
Dedication ... xvii
Chapter 1 - Literature Review ... 1
1.1 Bread ... 1
1.1.1. The bread-making process ... 1
1.2 Bread-making components ... 3
1.2.1. Gluten ... 4
1.2.2. Starch ... 5
1.2.3. Lipids ... 7
1.2.4. Native wheat lipids ... 7
1.2.4.1 Free lipids... 9
1.2.4.2. Bound lipids ... 11
1.2.4.3. Starch surface lipids ... 12
1.2.4.4. Starch lipids ... 12
1.2.4.5. Lipid interactions ... 13
1.2.5. Shortening ... 14
1.2.6. Air cells ... 14
1.2.7. Aqueous phase of dough ... 16
1.2.8. Aqueous phase formed by lipids and water ... 17
1.2.9. Role of native wheat lipids in bread... 19
1.2.10. Solvent extraction of lipids ... 22
1.3. Rheology ... 26
1.4. X-ray Microtomography (XMT) ... 27
1.5 Scope of the Study ... 29
1.5.1. Objectives ... 29
1.5.3. Chapter 3-The Influence of Native Wheat Lipid Fractions on the Rheological
Properties of Dough and Gas Cell Structure and Distribution in Bread ... 30
1.5.4. Chapter 4-The Effects of Varying Concentrations of Wheat Lipids Fractions on the Microstructure of Bread ... 31
1.6. References ... 33
Chapter 2 - Extraction and Fractionation of Native Wheat lipids ... 40
2.1 Introduction ... 40
2.2. Materials and Methods ... 41
2.2.1. Flour ... 41
2.2.2. Defatting and reconstitution of lipids from flour ... 41
2.2.2.1. Non-starch total lipid extraction ... 41
2.2.2.2. Free lipid extraction ... 42
2.2.2.3. Bound lipid extraction... 42
2.2.2.4. Lipid fractionation: nonpolar, glycolipids, and phospholipids ... 42
2.2.2.4.1. Nonpolar lipids (NPL) ... 43 2.2.2.4.2. Glycolipids (GL) ... 43 2.2.2.4.3. Phospholipids (PHL) ... 43 2.2.3. Lipid Profiling ... 43 2.3. Results ... 44 2.4 Conclusion ... 45 2.5 References ... 45
Chapter 3 - The Influence of Native Wheat Lipid Fractions on the Rheological Properties of Dough and Gas Cell Structure and Distribution in Bread ... 48
3.1. Introduction ... 48
3.2. Materials and Methods ... 53
3.2.1. Flour ... 53
3.2.2. Defatting and reconstitution of lipids from flour ... 53
3.2.3. Physical and chemical properties of wheat flour ... 53
3.2.3.1. Moisture analysis ... 53
3.2.3.2. Mixograph ... 53
3.2.5. Dough development ... 54
3.2.6. Dough rheology (small amplitude oscillatory measurements) ... 55
3.2.6.1. Stress sweep testing -linear visco-elastic region (LVR) ... 55
3.2.6.2. Frequency sweep testing ... 56
3.2.6.3. Temperature sweep testing ... 56
3.2.7. Dough Rheology (large deformation) ... 57
3.2.7.1. Biaxial extension (Kieffer Rig) ... 57
3.2.7.2. Strain Hardening ... 58
3.2.8. Flour reconstitution for microstructure bread analysis ... 58
3.2.9. Analytical baking ... 58
3.2.10. Bread macrostructure (C-Cell imaging) ... 59
3.2.11. Bread microstructure (x-ray microtomograhpy) ... 59
3.2.11.1. Macro testing (whole loaf) ... 59
3.2.11.2. Micro testing (center section) ... 60
3.2.12. Statistical analysis ... 61
3.3. Results ... 61
3.3.1. Physical and chemical properties of wheat flour samples ... 61
3.3.1 Mixograph ... 62
3.3.2. Mixolab ... 63
3.3.3. Dough development ... 68
3.3.2. Dough rheology (small deformation) ... 71
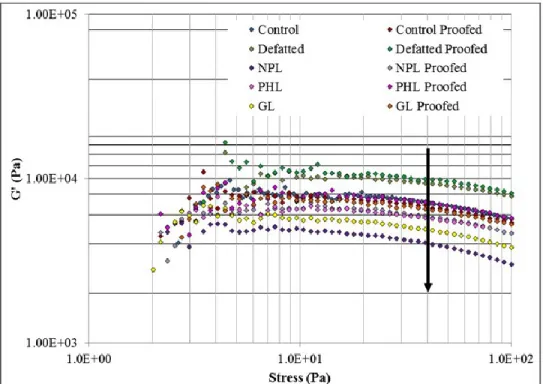
3.3.2.1. Stress sweep testing (LVR) ... 71
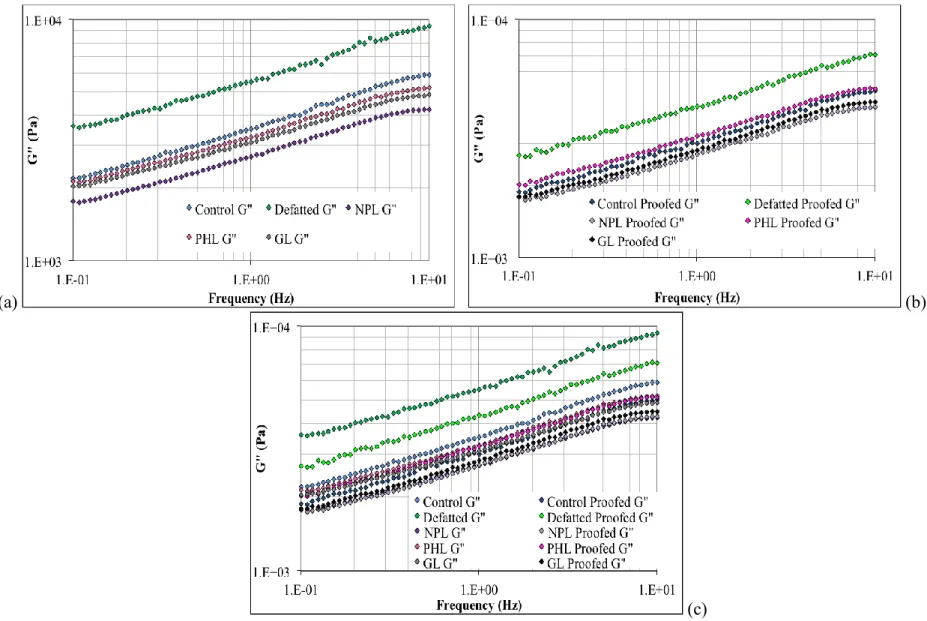
3.3.2.2. Frequency sweep testing ... 72
3.3.2.3. Temperature sweep testing ... 83
3.3.3 Dough Rheology (large deformation) ... 89
3.3.3.1. Biaxial extension (Kieffer Rig testing) ... 89
3.3.3.2. Strain Hardening ... 92
3.3.4. Physical parameters of breads for XMT macro testing ... 95
3.3.5. Physical parameters of breads for XMT micro testing ... 96
3.3.6 Macrostructure analysis (C-Cell) ... 98
3.3.6.2. C-Cell micro XMT treatment analysis ... 102
3.3.7. Microstructure analysis of bread (X-ray microtomography) ... 105
3.3.7.1. XMT macro testing ... 106
3.3.7.2. XMT micro testing ... 111
3.4. Discussion ... 114
3.5. Conclusion ... 119
3.6. References ... 120
Chapter 4 - The Effects of Varying Concentrations of Wheat Lipid Fractions on the Microstructure of Bread ... 128
4.1. Introduction ... 128
4.2. Materials and Methods ... 131
4.2.1. Physical and chemical properties of flour ... 131
4.2.1.1 Flour ... 131
4.2.1.2. Moisture analysis ... 131
4.2.1.3. Mixograph ... 131
4.2.2. Defatting and reconstitution of lipids from flour ... 132
4.2.3. Analytical baking ... 132
4.2.4. Bread macrostructure (C-Cell imaging) ... 132
4.2.5. Bread microstructure (x-ray microtomography) ... 133
4.2.6. Experimental design and statistical analysis ... 133
4.3. Results ... 134
4.3.1 Physical and chemical properties of flour ... 134
4.3.1.1. Moisture analysis ... 134
4.3.1.2. Mixograph ... 135
4.3.2. Physical properties of dough and bread ... 135
4.3.3. Macrostructure analysis of breads containing varying lipids treatments (C-Cell).... 137
4.3.4. Microstructure analysis of center pieces of bread containing varying lipids treatments (X-ray Microtomography)... 144
4.4. Discussion ... 165
4.4. Conclusion ... 169
Chapter 5 - Future Work ... 176
References ... 177
Appendix A - Flour Mixographs... 191
List of Figures
Figure 1.1. Wheat lipid classes in flour ... 9
Figure 1.2. Loaf volume distribution at varying lipid additions ... 10
Figure 1.3. Ternary phase diagram of wheat lipids in water ... 18
Figure 1.4. Multi-scale analysis of the microstructure of bread ... 30
Figure 3.1. Optimized mixograph results for sample flours used for testing ... 62
Figure 3.2 Mixolab results for control, defatted (0%), total 100g (50%), and total lipids-200 g (100%) ... 63
Figure 3.3. Changes in the dough during fermentation and proofing (Control) ... 68
Figure 3.4. Changes in the dough during fermentation and proofing (Defatted) ... 69
Figure 3.5. Stress sweep results for storage modulus (G’) of dough containing lipid treatments tested after mixing and proofing ... 71
Figure 3.6. Dependency of storage modulus (G’) on frequency (a) after mixing (b) after proofing and (c) both after mixing and after proofing ... 74
Figure 3.7. Dependency of loss modulus (G”) on frequency (a) after mixing (b) after proofing (c) after mixing and after proofing together ... 75
Figure 3.8. G' and G" values at 1 Hz after mixing (a) and after proofing (b) ... 77
Figure 3.9. Phase angle (loss tangent) measurements (tan δ) for lipid treatment additions (a) after mixing (b) after proofing ... 80
Figure 3.10. Dependency of viscosity on frequency (a) after mixing and (b) after proofing ... 82
Figure 3.11. Temperature sweep results for (a) storage (G’) and (b) loss (G”) moduli ... 86
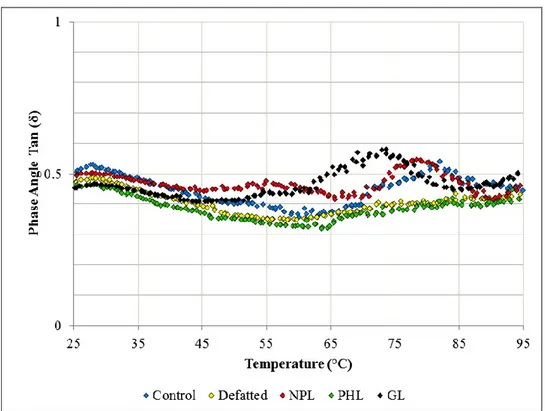
Figure 3.12. Phase angle (tan δ) results for temperature sweeps of treatments with varying lipids ... 87
Figure 3.13. Change in viscosity of lipid treatments as a function of temperature ... 88
Figure 3.14. Kieffer Rig (uniaxial) extensibility testing results for lipid treatments ... 89
Figure 3.15. Stress-strain curves used for determination of strain hardening behavior of doughs with varying lipid treatments ... 92
Figure 3.17. C-Cell raw images of micro XMT sample slices for control, NPL (0.6%, 1.2%, 2.5%), and PL (0.2%, 0.4%, 0.6%) lipid additions ... 102 Figure 3.18. Binary images of the control sample for XMT macro (a) and micro (b) testing.... 105 Figure 3.19 XMT loaf scans results for whole loaf samples for control, nonpolar (NPL),
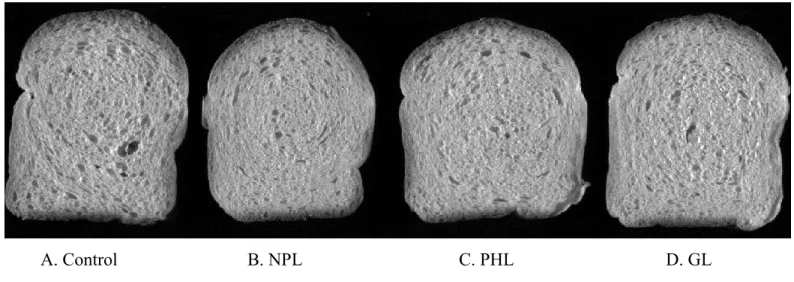
phospholipids (PHL), and glycolipids (GL) additions (a) cell wall thickness distribution, (b) cumulative cell wall thickness distribution, (c) gas cell size distribution, (d) cumulative gas cell size distribution. ... 107 Figure 3.20. XMT scan results for center section of bread slice for control, 0.6, 1.4%, and 2.8%
nonpolar (NPL) and 0.2%, 0.4%, and 0.6% polar (PL) (a) cell wall thickness distribution, (b) cumulative cell wall thickness distribution, (c) gas cell size distribution (d) cumulative gas cell size distribution. ... 110 Figure 4.1. Optimized mixograph results for sample flours used for testing ... 135 Figure 4.2. C-Cell raw images of control, defatted, reconstituted (Recon) (1.4%, 2.8%), and
bound (0.6%, 1.2%, 2.5%) lipid additions ... 139 Figure 4.3. C-Cell raw images of free (0.8%, 1.6%, 2.5%) and nonpolar (NPL) (0.6%, 1.2%,
2.5%) lipid additions ... 140 Figure 4.4. C-Cell raw images of polar (PL ) (0.2%, 0.4%, 0.6%) lipid additions ... 141 Figure 4.5. XMT scan results for center section of bread slice for bound samples at 0.6%, 1.2%,
and 2.5% addition (a) cell wall thickness distribution, (b) cumulative cell wall thickness distribution, (c) gas cell size distribution (d) cumulative gas cell size distribution ... 146 Figure 4.6. XMT scan results for center section of bread slice for free samples at 0.8%, 1.6%,
and 2.5% addition (a) cell wall thickness distribution, (b) cumulative cell wall thickness distribution, (c) gas cell size distribution, (d) cumulative gas cell size distribution. ... 148 Figure 4.7. XMT scan results for center section of bread slice for nonpolar (NPL) samples at
0.6%, 1.2%, and 2.5% addition (a) cell wall thickness distribution, (b) cumulative cell wall thickness distribution, (c) gas cell size distribution, and (d) cumulative gas cell size
distribution ... 151 Figure 4.8. XMT scan results for center section of bread slice for polar (PL) samples at 0.2%,
0.4%, and 0.6% addition (a) cell wall thickness distribution, (b) cumulative cell wall thickness distribution, (c) gas cell size distribution, (d) cumulative gas cell size distribution ... 154
Figure 4.9. XMT scan results for center section of bread slice for free (0.8-2.5%) vs bound samples (0.6-2.5%) (a) cell wall thickness distribution, (b) cumulative cell wall thickness distribution, (c) gas cell size distribution, (d) cumulative gas cell size distribution. ... 156 Figure 4.10. XMT scan results for center section of bread slice for all treatments at varying
concentrations (a) cell wall thickness distribution, (b) cumulative cell wall thickness
distribution, (c) gas cell size distribution, (d) cumulative gas cell size distribution. ... 158 Figure 5.1 Mixograph curves for control flour ... 191 Figure 5.2 Mixograph curves for defatted flour... 192
List of Tables
Table 1.1. Experimental approach for Chapters 3 and 4 ... 32
Table 2.1 Mean composition and levels of polar lipids found in control flour ... 47
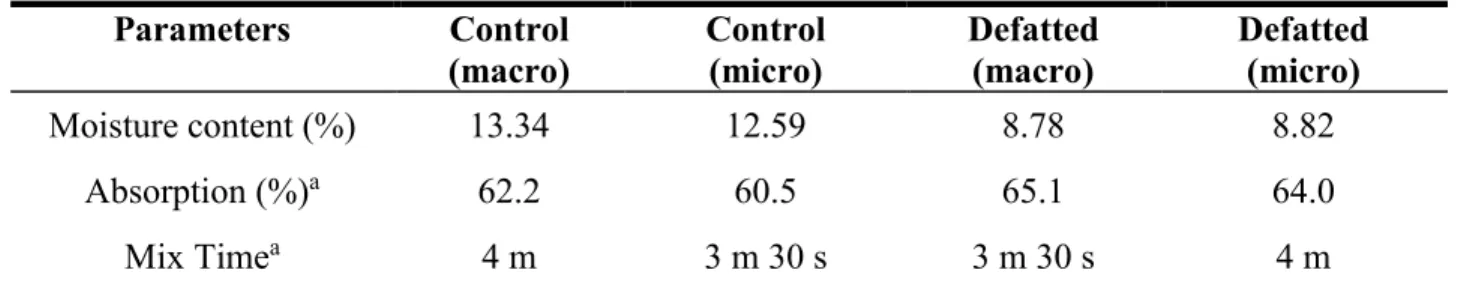
Table 3.1. Physical and chemical characteristics of control and defatted flours ... 62
Table 3.2. Mixolab parameters for control, defatted, and lipid treated flours ... 64
Table 3.3. Mixolab parameters for control, defatted, and lipid treated flours ... 64
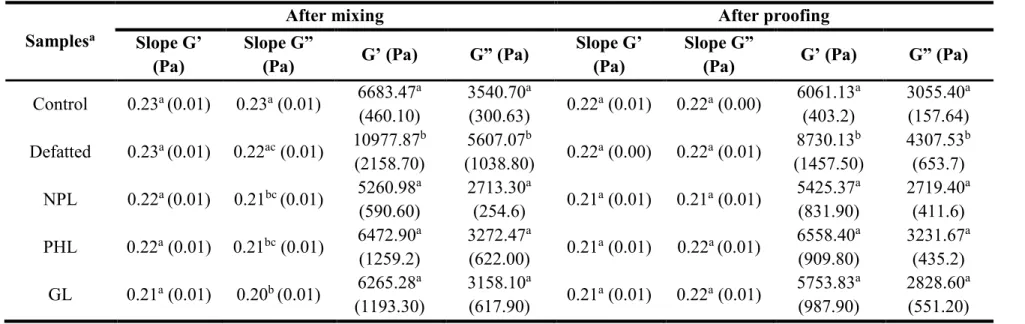
Table 3.4. Slopes of the G’ and G” verus frequency values at 1 Hz ... 76
Table 3.5 Kieffer Rig extensibility testing results for lipid treatments ... 89
Table 3.6 Strain hardening measurements results for lipid treatments ... 93
Table 3.7 Physical characteristics of whole loaf breads baked with different lipid treatments .... 96
Table 3.8. Average physical parameter measurements for center section breads baked with different lipid treatments ... 97
Table 3.9 Structure parameters measured by C-Cell Imaging ... 98
Table 3.10. C-Cell analysis of macro XMT sample breads containing varying lipid treatments 101 Table 3.11. C-Cell analysis of breads used for micro XMT analysis with varying lipid treatment additions ... 103
Table 3.12 Macro XMT results for whole loaf breads containing varying lipid treatments ... 108
Table 3.13 Gas cell size percentile distributions for whole loaf breads with added lipids ... 108
Table 3.14. XMT results for center section breads containing varying lipid treatments ... 112
Table 3.15 Gas cell size percentile distribution for center section breads at varying lipid treatments ... 113
Table 4.1. Physical and chemical characteristics of control and defatted flours ... 134
Table 4.2. Physical parameter measurements for breads baked with different lipid treatments 136 Table 4.3. C-Cell analysis of breads containing varying lipid treatments ... 142
Table 4.4. Structure parameters tested by X-ray microtomography ... 145
Table 4.5. XMT results for breads containing varying lipid treatments ... 161
Table 4.6 Gas cell size percentile distributions for lipid treatments ... 164
Acknowledgements
The author would like to acknowledge and thank Abigail Lape, Carrie Lendon, and Cargill’s Global Foods Research group for allowing the usage of their X-ray Microtomograph and for their time, guidance, and advice with the technique, methodology development, and interpretation of the results.
Also, the author would like to thank Mary Roth at the Kansas State University
Lipidomics Research Center for her assistance, guidance, and expertise in sample preparation and lipid profiling for this dissertation research.
Special thanks goes to Dr. Greg Aldrich, Dr. Cassie Jones, and Dr. Yong Cheng Shi for the allowed use of their labs and equipment.
Much gratitude goes to Chao-Feng Hsieh for kindly running starch damage analysis on the tested flour samples.
To my advisors, Dr. Jon Faubion and Dr. Hulya Dogan for their countless hours of leadership and guidance, for always taking the time to discuss with me about any topic, and for their endless support throughout this entire process.
Much appreciation goes to Dr. Becky Miller for her assistance with the research, use of her equipment, and advice.
Much gratitude goes to Dr. Kelly Getty for always sharing words of encouragement and support.
A special thanks goes to Dr. Sean Finnie for coming to the aid and rescue with providing endless advice on life, wheat lipid extractions, and technique assistance.
Much appreciation goes to Dr. Chris Miller for assistance with extraction techniques and knowledge on chemical analysis as well as any other help needed.
To Dave Krishock, for always being there to help and assist on anything and everything, for being an endless support and sounding board and for giving me the respect and opportunity to work and teach along side him. Not to forget, the chance to make donuts.
Many thanks goes to Michael Moore for always assisting with any of my research needs via equipment or water, for being a kind ear, and for all the encouragement.
Much appreciation goes to my lab mates, Gabriela Rattin, Andrew Mense, and Reona Oshikiri, for the countless hours of laughter, conversation, and support. My success was only as great as my team.
To Audrey Girard and my Emily’s (Emily Jackson and Emily Elliot), for the countless hours of conversation, laughter, research, and Baking Science Lab fun; you truly made my experience a lot brighter.
Much gratitude goes to all the bakery and milling science students, for allowing me the opportunity to teach, mentor, and for making me apart of the Grain Science and Industry family.
Special thanks goes to my OSU family, Dr. Jim Harper and Dr. Nurdan Kocaoglu-Vurma, for seeing potential in me and for the continued support and to Angela Eliardi, Thais de Nardo, and Ruth Luther, for being the three best friends a person could ever ask for.
Much appreciation goes to Anne Rigdon-Huss, Lauren Brewer, Sarah Gutkowski, Carlos and Keyla-Lopez Campabadal, Adrian Martinez-Kawas, and Kyle Probst for all the meals, the laughter, and all the memories.
Many thanks and appreciation to Deanna Scheff, Orelia Dann, Jennifer and Levi Fredrick, Sara Menard, and Cara Dennis for being great friends and support system.
And to my parents, Becky and Harold, brother, Scott, sister-in-law, Carrie, and niece, Clara, for being the foundation for everything that I am and for never faltering in their love, support, and allowing me to go and accomplish my dreams. For that, I am indebted.
Dedication
This dissertation is dedicated to all the dreamers who have undertaken the course to find their own personal greatness and to all those who have been a guiding light on my path to help me achieve my unthinkable.
Chapter 1 - Literature Review
Throughout history, bakery products have been a major part of the diet with much of the popularity being due to their nutritional value and the variety of goods found on the market. Bread was first discovered by the ancient Egyptians and today, it still remains as a widely
consumed product that provides energy as well as other essential nutrients (Jacob 1944). In 2009, 194.5 pounds of flour and cereal based foods were consumed per capita with 135 pounds coming from wheat-based goods (U.S. census 2009). During 2012, total U.S. bread sales reached a high of $6260 million dollars and provided 633,000 jobs (American Bakers Association 2010; AIB International 2012). Through scientific advances, research has helped to improve quality and increase shelf-life by providing a better understanding of bread ingredients, dough composition, and final product quality.
1.1 Bread
Bread is defined as “a yeast-leavened dough made from flour or treated flour that is hydrated by the addition of water, milk, eggs, and is leavened by yeast or a yeast by-product” (21CFR136.10). White pan bread can be made from a variety of different cereal grains, however, wheat is preferred as it contains storage proteins that form a continuous gluten network that traps air cells and affects loaf volume (Cauvain 1998). The dough, which is created by the addition of water and mixing, exhibits visco-elastic characteristics. Those extensible and elastic properties allow for easier dough handling and processing (Cauvain 1998). The visco-elastic characteristics of dough promote the incorporation and expansion of air/gas cells into the dough matrix. This influences the expansion of the dough during fermentation and proofing, ultimately affecting the final loaf volume and crumb.
1.1.1. The bread-making process
Mixing serves two principle purposes in breading-making: to form and develop the gluten network and to evenly incorporate and disperse the ingredients throughout the system (Serna-Saldivar 2010). Mixing determines initial size, amount, and distribution of air cells within the dough (Primo-Martin et al 2006). The mixing stage is the main determinant of initial air cell size and viscosity and this is based on the amount of energy applied and the type of mixer being used
(Salt et al 2006). Because of this, the addition of more pressure during mixing ultimately causes an increase in the number of air cells that are integrated into the dough (Mills et al 2003). The increase in air cells in the bread causes a drop in dough density at optimum mixing and “half of the total amount of air possible has been incorporated” (Hoseney 1985).
Water is required for the formation of the dough and the amount is critical for creating optimum dough. The hydration of the gluten proteins results in the morphology of the polymers (Delcour and Hoseney 2010). Water causes these proteins to undergo a glass transition at room temperature, allowing for the conversion of proteins into a rubbery state (Delcour and Hoseney 2010). For this state change to occur, the right environmental temperature and plasticizer (water) concentration is required (Delcour and Hoseney 2010). Dough that is mixed to optimum must have fully hydrated protein and starch. When properly hydrated, this is considered to be at the point where it can produce the best loaf of bread (Hoseney 1985). The addition of too much water results in longer mixing times as there is more water available for absorption and
oversaturation of the flour (Stear 1990). Insufficient water reduces the ability for certain fractions of the flour particles to hydrate (Stear 1990; Delcour and Hoseney 2010). Temperature affects dough development and initial ingredient temperatures, mixing, friction, and solubilizing of the molecules all create heat during dough formation (Stear 1990). Temperatures >30°C can increase the ability to hydrate inducing starch granule swelling and causing changes in the physical properties of the dough (Stear 1990). Overall, optimal dough development is influenced by the required mixing time, water absorption, and temperature (Serna-Saldivar 2010).
During the final stages of mixing, gluten proteins unfold due to the shear applied by the mixing pins and bowl (Stear 1990). This facilitates hydrogen and hydrophobic bonding while breaking internal disulfide bonds (Stear 1990; Delcour and Hoseney 2010). An optimal mixed dough can be divided into three different fractions: gluten structure in which starch granules and other compounds are dispersed, fractions that are water soluble and make up the liquid part of the dough, and air cells that were incorporated by mixing (Stear 1990). Once driven past the point of optimal mixing, the dough begins to lose its visco-elastic characteristics due to
degradation of disulfide bonds and the connection of thiol groups with carbonyl groups that are present in the dough (Delcour and Hoseney 2010). Over mixing has shown to be influenced by oxidation as well as by the presence of the water-soluble components in the dough (Hoseney 1985).
Following mixing, dough goes through fermentation. This allows the dough to relax in order to develop a network that is able to retain the air cells and for the yeast to become active and start producing CO2 gas (Belderok 2000). The dough is divided into balls of a predetermined weight and rounded. At this point, some of the gas created by the yeast is forced out of the dough (Belderok 2000). After fermentation, the dough rests for another 15-30 minutes (immediate proofing) and then moulded where it is sheeted and rounded into a cylinder fitted for the bread pan (Belderok 2000). The newly rounded cylinder is proofed one final time allowing for expansion in size to nearly 2X, before being baked (Belderok 2000).
Punching and moulding release some of the carbon dioxide created during fermentation by dividing the existing air cells, creating smaller cells (Serna-Saldivar 2010). During the
proofing stage, the dough undergoes changes in height and volume as well as texture and density (Serna-Saldivar 2010). Required proofing time is influenced by flour protein content, time, and desired loaf height (Serna-Saldivar 2010). The last step is baking (200-250°C, 12-45 min) and during the beginning stages, a final increase in volume occurs and the crust sets (Belderok 2000; Serna-Saldivar 2010). The increase in dough volume is created by more active yeast producing CO2 and the evaporation of water vapor, both resulting in expansion of the existing gas cells (Serna-Saldivar 2010). Also at this time, the starch gelatinizes (55-65°C), takes up most of the available water, and the gluten structure sets (Belderok 2000; Serna-Saldivar 2010). The gas cells continue to expand until the structure sets or until the cell wall begins to fail. At this point, the structure transforms from a foam to a continuous sponge (MacRitchie 2010). The crust also browns due to both chemical reactions of Maillard browning and caramelization (Serna-Salidvar 2010).
1.2 Bread-making components
The components that compose wheat flour provide the scaffolding and strength of the bread structure and are essential for maintaining air cells. Wheat is the only cereal grain that contains the specific gluten-forming proteins that allow for air cell incorporation while resisting coalescence, thus visco-elastic dough is a very important part of bread-making and production. Starch also plays a key part by serving as a filler in the protein matrix. Additionally, native and processed lipids are essential to maintain loaf volume and prevent gas cell coalescence during the
later stages of proofing and baking (Sroan et al 2009). Each component is needed to produce and maintain quality loaves of bread with good loaf volume and crumb grain.
1.2.1. Gluten
Gluten provides the basis, the structural backbone, and it is the gluten proteins
specifically that “form the continuous viscoelastic network in the dough” (Singh and MacRitchie 2001). It also serves as the network for which air cells are dispersed and held. In bread-making flours, the gluten protein makes up 80-90% of the total protein (Schofield 1987). Gluten consists of two protein families, glutenins and gliadins, which vary in their composition, but combined in equal proportions, give both viscous and elastic properties to dough (Schofield 1987; Singh and MacRitchie 2001). Gliadins are single chained polypeptides and have very similar molecular weight distributions. The glutenins are created by polymerization of glutenin subunits at a range of molecular weights (Singh and MacRitchie 2001). Both proteins contain disulphide bonds, but the nature of the linkage is different with gliadin having intra-chain linkages, while glutenin has mostly inter-chain linkages (Schofield 1987).
Gliadins and glutenins are not soluble in water, but are plasticized by water. Due to having non-polar amino acid side chains, solvents such as aliphatic alcohol, dilute acids, soaps, or ionic detergents are used as extractants (Schofield 1987; Singh and MacRitchie 2001). The gluten structure is highly dependent on the extent of bonding interactions between the polymers, specifically hydrogen, hydrophobic, and electrostatic interactions (Hamer and Van Vliet 2000). The resulting viscous and elastic properties of dough are important for gas cell incorporation and dough handling properties, both which are essential in bread-making (Schofield 1987). For dough to be elastic, the system must remain strong or have “continuity.” This is provided by the glutenin fraction, as it is likely to have more stable entanglements (Delcour and Hoseney 2010).
The mechanism of how gluten creates the dough is not completely understood, but several models exist. One of these theories, the “linear glutenin hypothesis,” suggests that extending units of long chain peptides come together in a head-to-tail manner connected by disulphide bonds (Schofield 1987). These connected chain units are thought to be able to extend under an applied strain. Once that strain is removed, they then return to their original
confirmation (Schofield 1987). These disulphide bond linked polypeptides contain regions of α-helix and β-turns and during mixing, these bonds are broken and become realigned,
strengthening the dough (Schofield 1987). Both components of the gluten protein have been found to be surface active where the gliadin fraction moves to the gas/liquid surface faster than does the glutenin, thus creating more pressure per area (Gan et al 1995; Primo-Martin et al 2006). Although, both components of gluten have minimal solubility in water, proteins, in
general, are best suited for movement to the interface as they can widely spread across its surface allowing for strong interactions between the phases (Primo-Martin et al 2006).
Another model of how gluten functions in dough comes from polymer science and
hypothesizes that long protein chains align at the gas liquid interface surface, with loops and tails that extend out into the other phases and then interact with other molecules (Singh and
MacRitchie 2001). The glutenins would align at the interface and the extended loops and tails would become “entangled” with other compounds in the structure or form “bridges” with starch (Singh and MacRitchie 2001). The entanglements caused by glutenin would provide more elastic dough properties, due to greater interactions between the proteins, increasing the viscosity of the dough. The gliadin would create a more viscous, liquid like system (Singh and MacRitchie 2001). The nature of the entangled network is highly dependent on size, shape, makeup, and amount of the specific polymers (Hamer and Van Vliet 2000). The “loop and train” model is a third theory of the gluten network. It suggests that the protruding loop or train subunits attached to the main linear chain actually interact with one another through hydrogen bonding. Some of these units will either be bound to one another (called loops) or connected and called trains (Belton 1999). When the loops are extended the proteins are more susceptible to moving over one another, but then can revert back to the loop-train equilibrium, providing elastic behavior (Belton 1999).
1.2.2. Starch
Starch is also a very important component needed for the development of dough and the final bread. Found in the endosperm of the wheat kernel, starch makes up almost 70% of its’ mass (Blanshard 1987). When milling wheat flour, the goal is to remove as much of the
endosperm as possible while minimizing the amount of starch damage during the process. Starch can be found in granular form as either polygonal or spherical in shape (Delcour and Hoseney 2010). The molecular structure of the starch granules consists of long chains of glucose that are either linear or branched (amylose and amylopectin) (Zobel 1988). Each polymer group consists
of one reducing end (O-H group) with the linear chain of both amylose and amylopectin
containing α-1-4 chain linkage (Delcour and Hoseney 2010). However, amylopectin differs from amylose in that it is also branched at some α-1-6 bonds creating a complex branched structure (Delcour and Hoseney 2010). Amylose is thought to exist in the amorphous region of the granule versus amylopectin located in the crystalline regions (BeMiller 2007).
Native starch doesn’t swell when mixed with cold water and depending on the starch origin, it undergoes gelatinization or “irreversible swelling” when heated in water to a specific temperature (Schoch 1965). Once the temperature has exceeded the temperature at which starch gelatinizes, the granule swells and takes up water (BeMiller 2007). The water and heat alters the crystalline morphology. The hydrogen bonds between the polymers begin to break and more and more water is absorbed into the swelled structure eventually disrupting the crystalline regions (BeMiller 2007). This change in the granular order of the polymers due to water and heat is described as a “loss of birefringence” and causes irreversible swelling of the granules and the leaching out of amylose (BeMiller 2007). Together, these changes increase the viscosity of starch-water solutions (Primo-Martin et al 2007). External factors that can alter the rate or temperature at which gelatinization occur include salt, pH, sugar and the ratio of water to starch (BeMiller 2007).
Starch interacts with sugar, lipids, proteins, pentosans, and water during the bread-making process, and this is very important for the development of dough (Blanshard 1987). Starch plays a role in the overall bread quality as it affects final product characteristics such as “structure and texture of the final product” (Primo-Martin et al 2007). The changes in texture and structure are heavily influenced by the starch going through the above described transitions (Blanshard 1987). It is suggested that starch acts as “high loading filler” in the dough system (Singh and MacRitchie 2001; Delcour and Hoseney 2010). The functions of starch in bread-making include diluting the amount of gluten so as to adjust the dough consistency, providing fermentable carbohydrates for yeast through the action of amylase, attaching and forming a bond with gluten and increasing the system’s elasticity and extensibility during gelatinization in order to allow for flexibility in the gas/air cell film (Hoseney et al 1971). In the crumb, starch creates regions that are amorphous after gelatinization, but as the bread cools and ages it becomes crystalline or retrogrades (Primo-Martin et al 2007).
1.2.3. Lipids
The wheat kernel is composed of approximately 2-4% total lipids that are found within the bran, germ, and endosperm (Pomeranz 1973). Most of the lipids are located in the germ, a fraction (8-15%) of the kernel that is removed during the milling process, followed by the bran and endosperm containing 6% and 8%, respectively (Pomeranz 1973). The germ contains approximately 80% of the total lipids with higher levels of free fatty acids, which are more sensitive to lipid oxidation and promote rancidity (Serna-Saldivar 2010). The total lipid fraction consists of primarily linoleic acid (Carr et al 1992). It makes up roughly 60% of the total lipid fraction and the wheat flour contains roughly 2.5% of total lipids (Carr et al 1992: Eliasson and Larsson 1993). During milling, triglycerides remain in the endosperm and can either be saturated or unsaturated (Sullivan 1940; Carr et al 1992).
In general, the function of lipids in bread-making helps improve textural properties, mouth-feel, dough handling, loaf volume, and increase shelf life (Ponte and Baldwin 1972). Lipids come from both, natural or native lipids in the endosperm and from processed shortenings or liquid oils that are added during production. The lipids in the system act to help stabilize the air cells and prevent coalescence during the growth and expansion of the dough (Chung et al 1978). Bread is considered to be foam and lipids act as “surfactants in stabilizing or destabilizing the foam structure during the expansion of the loaf,” thus acting as support and providing more stability to the foam (MacRitchie 1977). The lipids are influential in helping to maintain gas cell stability and loaf volume over time; however, the addition of up to 3% shortening has been shown to help increase final loaf volume and improve crumb softness (Pomeranz 1965; Chung et al 1978).
1.2.4. Native wheat lipids
Although the amount of native lipids that are present in the flour is small, these constituents have a large effect on final bread quality. Lipids in the endosperm of the kernel consist of various fractions that are both functional and nonfunctional in the dough and bread-making processes. Lipids in wheat can be classified as either simple or complex, meaning that they have either one or two structural components (simple) or greater than two structural
components (complex) (Chung et al 2009). Further classification of lipids can be done based on the type of extraction used and location within the flour (Chung et al 2009). For classification by
location, lipids can be separated into non-starch lipids, integral starch lipids, and starch surface lipids (Chung et al 2009). Figure 1.1. shows the classification of lipids found in wheat.
From an extraction standpoint, the lipids can be classified in two groups, non-starch lipids or total lipids, which include all the starch lipids and surface starch lipids (Finnie et al 2009). If the extraction process promotes the swelling of starch granules then these lipids fall under the category of total lipids because this includes those lipids that are tightly bound to the internal structure of the starch. However, if the technique doesn’t induce granular swelling then the lipids are categorized as being non-starch lipids as these lipids are not linked to the structure of the starch (Finnie et al 2009). The amyloplast is where the development of lipids are thought to originate, particularly, the polar fractions (glycolipids and phospholipids) (Morrison 1988). Lipids that are found inside the starch have been shown to be beneficial against starch
degradation as they are inhibitors of enzyme degradation by phosphorylase, α and β-amylase (Morrison 1988). The complexing of amylose with lipids has also shown to slow the rate that degradation occurs (Morrison 1988).
Classification by extraction also divides the non-starch lipids into “free” or “bound” fractions depending on the type of extraction solvent used (Finnie et al 2009). Free lipids are those lipids that can be separated using nonpolar solvents such as petroleum ether, hexane, and dimethyl ether, while the bound lipids are those that can be removed by using polar solvents such as chloroform, methanol, and water-saturated butanol (Hoseney et al 1969; Finnie et al 2009). The amount of free lipids extracted is dependent upon the technique used for the extraction, the temperature of the solvent, and the amount of moisture and particle size of the flour (Chung et al 1977a; Chung et al 1977b; Chung et al 2009). Both the free and starch lipids can further be classified as polar and nonpolar lipids and have the greatest impact on the quality of bread (Ohm and Chung 2002; Chung et al 2009). The removal of the lipids during extraction also has an effect on water absorption as it increases the amount of water needed by the dough (Chung et al 1980c).
(Chung et al 2009) Figure 1.1. Wheat lipid classes in flour
1.2.4.1 Free lipids
Free lipid composition consists of 0.8% free lipids of which 0.6% are nonpolar, while 0.2% are polar (Hoseney et al 1970). The nonpolar and polar lipids are defined by their ability to mix with water as some of these lipids have functional groups that are water miscible (Carlson et al 1978). Polar lipids are also more inclined to form “membrane-like” structures, whereas the nonpolar predominantly form drops that are similar to that of oil (Carlson et al 1978). The composition of polar lipids found in flour include: digalactosyldiglycerol (DGDG)
monogalactosyldiglycerol (MGDG), N-acyl-phosphatidylethanolamine (NAPE), and phosphohatidylcholine (PC) (Pareyt et al 2011). The nonpolar lipid fraction, consist of
triacylglycerols (TAG), diacylglycerols (DAG), monoacylgycerols (MAG), sterols, sterol esters and free fatty acids (Pomeranz 1973; Pareyt et al 2011). The polar lipids are a combination of glycolipids (galactolipids specifically) and phospholipids (Chung et al 1980a). Of the previously listed polar lipids, it is the MGDG and DGDG, which are found in the highest concentration and for the phospholipids, the PC and lysophosphatidylcholine (LPC) are the most common (Chung et al 1980a). Typically, phospholipids contain only one phosphorus group/mole, while the glycolipids contains 1-3 galactoses (Chung et al 1980a).
During the mixing stage, the free lipids become “bound” to other constituents in the dough, thus reducing the amount of extractable free lipids (Chung and Tsen 1975). This decrease
in free lipids is linked to the interaction of protein and lipids or starch and lipids. This causes a reduction of greater than 50% in the free lipids during dough mixing (Chung and Tsen 1975). Early studies of the influence of lipids on the loaf volume and crumb grain through the removal (defatting) and re-addition (reconstitution) of extracted total wheat lipids, found that they do play an important part in maintaining and strengthening the foam structure of the dough (MacRitchie and Gras 1973). The polar lipid fractions had the greatest effect on loaf volume; specifically, the glycolipids having a galactose group attached (Chung et al 1982). These differences can be seen in Figure 1.2. The galactolipids provide the greatest improvement in loaf volume as well as dough development time (Chung et al 1982). However, reduced amounts of polar lipids caused a decrease in loaf volume due to a greater association of protein-protein interactions thereby influencing the air cell distribution and expansion (Chung et al 1980c). The nonpolar lipids have a lower melting point than do the polar lipids and their crystalline state plays a role in
maintaining air cell structure as phospholipids are most beneficial when they are in a “liquid-crystalline” form (Pomeranz 1965; Leissner 1988). This phenomenon (improved loaf volume) was seen when polar lipids were added alone and when a combination of nonpolar/polar lipids fractions where added back together (Chung et al 1982).
Extraction studies determined that the glycolipids bind with both gliadin and glutenin through hydrophobic and hydrophilic interactions (Hoseney et al 1970). The glycolipids interact with gliadin by hydrophilic bonding and to glutenin through hydrophobic bonding (Hoseney et al 1970). Due to gliadin playing a bigger role influencing loaf volume, the interactions between the glycolipids and these proteins are more predominant in maintaining structural integrity of the dough (Hoseney et al 1970). From a molecular viewpoint, glutenin has a greater availability of nonpolar side chains that can attach to the lipids (Pomeranz 1973). This allows for more
association of lipids with the proteins because of the hydrophobic side chains (Pomeranz 1973). These interactions between lipids and proteins are not limited to hydrophobic bonding, but also include ionic, covalent, hydrogen, and Van der Waals bonding (Pomeranz 1973). During the beginning phase of the mixing process, most of the free lipids become bound and additional mixing time does not influence the amount of lipids that became bound (Chung and Tsen 1975).
The nonpolar components of free lipids are detrimental to loaf volume when they are added back independent of polar lipids or even shortening (Daftary et al 1968). Adding individual subfractions of nonpolar lipids (steryl esters, triglycerides, diglycerides, and fatty acids) back did not improve loaf volume (De Stefanis and Ponte 1976). Loaves made with individual nonpolar fractions were similar to those in which total amounts of nonpolar lipids were added back (De Stefanis and Ponte 1976). Increasing the amount of nonpolar lipids, while maintaining the polar lipid amount constant caused decreases in loaf volumes even with polar lipids present (Daftary et al 1968). However, adding more polar lipids along with increasing amounts of nonpolar lipids reversed the negative effects of the nonpolar lipids (Daftary et al 1968). The addition of free fatty acids decreased the loaf volume even more than did the other nonpolar fraction (De Stefanis and Ponte 1976). Particularly it was linoleic acid, which was the unsaturated fatty acid that had the greatest detrimental effect on loaf volume. De Stefanis and Ponte (1976) hypothesized that the influence of linoleic acid on loaf volume was due to their negative effects on both the gluten fractions and starch.
1.2.4.2. Bound lipids
The non-starch lipids classification also includes 0.6% bound lipids that are made up of primarily polar lipids (Hoseney et al 1970). These groups of bound lipids are those non-starch
Following the extraction of the free lipids, non-starch lipids (not associated with starch granules) can be extracted with polar solvents (e.g. water saturated butanol) without requiring heating (MacRitchie and Gras 1973; Chung et al 2009). Starch lipids and starch surface lipids vary among the wheat varieties as lipid content is dependent on the “size and type of starch granule” present (Chung et al 2009). These differences are seen with the variations between A and B starch granule types as well as with fine, course, and intermediate shaped starch granules (Chung et al 2009). Starch lipids also vary in soft versus hard wheat (Finnie et al 2009). Bound polar lipids aren’t as effective in maintaining and improving loaf volume as are the free polar lipids (Daftary et al 1968; Hoseney et al 1970).
1.2.4.3. Starch surface lipids
Starch surface lipids are bound lipids attached to the surface of the granule. These lipids are also strongly bound to gluten proteins and are a factor in distinguishing between flours from hard and soft wheat (Chung et al 2009). Typically, starch surface lipids are found in higher concentrations in soft wheat starches (Chung et al 2009). The surface components of the starch influence the rheological properties of the dough, particularly at the lamellar liquid-crystalline phase (Larsson et al 1997). Glycolipids are found in higher concentrations than other lipids on the surface of the starch and the main compounds are DGDG, MGDG, PC, and
lysophosphotidylcholine (LPC) (Finnie et al 2009; Finnie et al 2010). During mixing, polar lipids are removed from the surface of starch and incorporated into the gluten matrix (Finnie et al 2010).
1.2.4.4. Starch lipids
Starch lipids are those lipids that are found inside the granules. The abundance of these lipids are often directly and positively correlated to the amount of amylose in the starch
(Morrision 1988). Internal starch lipids can only be extracted by solvents (water saturated butanol) that are heated to 95-100°C, which induces starch gelatinization (Morrision 1988). The most common lipid classes here are the phospholipids with LPC and PC being the most prevalent (Galliard and Bowler 1987; Finnie et al 2010). Lipids within starch are often associated with the forming of amylose-lipid complexes (Delcour and Hoseney 2010). This occurs naturally in the starch granule or with unbound free lipids following the initiation of pasting or gelatinization of the starch (Delcour and Hoseney 2010).
The amylose-lipid complex is susceptible to leaching following hydration and heating of starch as it undergoes gelatinization (Morrison 1988). The presence of polar and nonpolar lipids during the gelatinization process influences the pasting properties of the starch during heating (Medcalf et al 1968). The readdition of polar lipids to defatted starch reduced the viscosity during pasting, while the addition of the nonpolar lipids reduced the paste viscosity initially, but resulted in higher peak pasting values than the defatted control (Medcalf et al 1968). The initial reduction in the pasting curve due to the presence of polar lipids was thought to be due to the binding of these lipids with starch, thus reducing the initial hydration of the starch granules (Medcalf et al 1968). Because the water is easily absorbed into the starch granule and nonpolar lipids are less likely to bind with components in starch, the nonpolar lipids cause an increase in the viscosity (Medcalf et al 1968).
1.2.4.5. Lipid interactions
Lipid-glutenin complexes that form during dough making have the greatest effect on mixing tolerance and mixing time especially in the presence of high levels of polar lipids (Chung et al 1980a). Interaction between lipids, proteins, and starch are affected by their polarities (Chung and Tsen 1975). The protein-protein interactions that form following the defatting process change during the reconstitution process as the addition of the lipids cause the intermingling of the polar fractions between the protein-protein bonds (Chung et al 1979). Defatting and reconstitution studies with protein showed that the addition of total lipid as opposed to nonpolar and polar fractions independently had greater interaction with protein, which suggests that the combination of both fractions together had a greater association with the protein (Chung et al 1979).
The increase in lipid-protein binding is influenced by the amount of work or mixing applied to the dough, as a more severe mixing action causes an increase in bound lipids (Daniels et al 1966). However, over-mixing causes a reduction in lipid binding (Pomeranz 1973). Marion et al (1987) also suggested that lipids, specifically phospholipids that bind during mixing, are not actually bound to the gluten phase, but rather these lipids are mixed in and are “physically embedded” in the gluten. The binding is associated with the friabilin or puroindolines, specifically PIN-A, one of the proteins associated with endosperm softness, which is a strong interaction with polar lipids (Dubreil et al 1997; Finnie et al 2010).
1.2.5. Shortening
The addition of shortening to the bread formula improves dough handling characteristics during production, enhances the ease of slicing, loaf volume, texture, crumb structure, and increases the shelf-life (Chung et al 1981). When shortening was added to defatted flour, there were both a positive and negative effect depending on the type of native lipid fractions remaining in the flour (Chung et al 1980c). Polar or total lipids must be present in order for shortening’s beneficial effects to be seen in a good quality bread flour (Chung et al 1980b; Chung et al 1980c). On the other hand, dough made from a flour of lower quality or lower protein content, shortening improves overall volume (Chung et al 1980b). In control flours (non-defatted), the addition of up to 3% shortening has shown to increase the overall loaf volume (Chung et al 1980c). As the amount of total lipids were lowered, slight volume increases result from the addition of shortening (Chung et al 1980c). However, shortening only caused a minimal increase in loaf volumes as the greater quantity of total lipids were removed (Chung et al 1980c).
Shortening is functional only up to a specific threshold when a certain amount of total lipids are removed. If nonpolar lipids are only added then there are no benefits from adding shortening (Chung et al 1980c). The polar lipid fraction works synergistically with shortening to help stabilize and maintain the foam structure and bubbles in the dough (Chung et al 1980b). Only small additions of polar lipids are needed in combination with shortening to increase or restore loaves to their original heights (Pomeranz et al 1968). It has been suggested that the addition of shortening in the absence of polar lipids may prevent protein-protein interactions and rather act as blocking agents for these type of interactions (Chung et al 1980b). During the bread production process, shortening promotes continued gas cell expansion at higher temperatures, thus allowing for a longer period of dough extensibility (Junge and Hoseney 1981).
1.2.6. Air cells
The internal crumb structure and loaf volume are highly dependent on the amount of gas cells incorporated into the dough system (Junge et al 1981). Fine grain is associated with many small cells incorporated during mixing (Junge et al 1981). Loaf volume, defined by the dough expansion capacity, is dependent on the air cell network and dough’s rheological characteristics following mixing (Gandikota and MacRitchie 2005; Sroan et al 2009). Expansion capacity is described as the maximum amount of growth the air cells can undergo without failing and when
this point is reached the loaf volume stops rising (Sroan et al 2009). This final growth is completed during the end of proofing in doughs made from flours with smaller loaf volume potential and at the start of baking for flours that have large loaf volume potential (Sroan et al 2009). The increase in air cell size, biaxial expansion, and the internal pressure causes a resulting strain on the dough (Sroan et al 2009).
Carbon dioxide produced by the yeast is not capable of creating the cells needed for the crumb. Instead, this happens during the later stages of mixing when the gas cells are incorporated and subdivided to create the bread crumb (Baker and Mize 1941). The rate that air cells are incorporated during mixing is greatest as the dough approaches optimal development (Baker and Mize 1946). Expansion of the dough does not occur until the dough has been fully saturated with gas formed by yeast fermentation. This process is regulated by the temperature and pH of the dough (Delcour and Hoseney 2010). The gas diffuses into the air cells and remains within the aqueous phase due to over saturation of the system caused by the fermentation process (Hoseney 1984). The greater rate in gas production causes an increase in the speed of cell expansion (Hoseney 1984). In order for cells to nucleate (or to be lost) from the system, the internal
pressure of the cells must be higher than the surface tension and the viscosity of the dough (Gan et al 1990). The pressure that is created within the newly formed air cell is a result of the radius and the interfacial tension of that particular cell (Hoseney 1984).
For foams, there is little to no effect of surface tension on the incorporation of air cells during mixing (Salt et al 2006). In foam systems, the energy input throughout mixing affects the size distribution of the incorporated bubbles and the resulting rheology (Mills et al 2003). The means to hold and maintain gas cells within a foam system has been described by the formation of a gel-like layer that can support the lamellar phase, which consists of proteins or other surface active groups that provide dough elastic properties (Mills et al 2003). Another mechanism is described best by the Gibbs-Marangoni process in which stabilization comes from surface active constituents such as surfactants or emulsifiers (Mills et al 2003). These surface active
components can move from a higher concentration to a lower concentration when the lamellae has broken down. This restores the differences in the lamellar regions that have weakened (Mills et al 2003).
The punching and moulding steps also add no new air cells to the dough. These steps instead increase the number of cells in the dough by dividing and splitting existing cells into
smaller, dispersed bubbles (Baker and Mize 1941; Gan et al 1995). The growth in volume is caused by size expansion of each gas cell and not by the incorporation of more cells (MacRitchie 1977). In some cases, the cells will expand so much that separation is only by a small film layer (Primo-Martin et al 2006). Gas cells are maintained within the dough matrix through the
presence of compounds with functional groups that allow them to move to the cell interface (Primo-Martin et al 2006). This phenomenon occurs because these compounds can lessen the potential for air cells to come together, coalesce, or undergo Ostwald ripening, thus stabilizing the cells in the system (Primo-Martin et al 2006). Carbon dioxide produced during fermentation and proofing move into the air cells that were incorporated during mixing. The air cells expand and grow causing internal pressure that inflates the incorporated air bubbles creating a system where the gas can be roughly 75% of the overall volume (Gan et al 1995: Salt et al 2006). During this expansion, cell walls may stretch causing them to be pushed together to a point where the thin wall fails and two gas cells become one (Salt et al 2006).
1.2.7. Aqueous phase of dough
Water influences dough formation as it is needed for the hydration and solubilization of flour as well as for chemical and physical reactions to occur. The addition of varying levels of water can cause the formation of two liquid phases within the dough if the appropriate amount of water is present (MacRitchie 1976a). If there is not enough water then only one liquid phase is created. One of the phases is the liquid phase and this is where chemical and physical changes occur within the dough by fermentation. It also allows for the expansion of air cells during the rest of the baking process (MacRitchie 1976a). It is this phase where the air cells are
incorporated and expansion happens due to fermentation (Sahi 1994; Primo-Martin et al 2006). Sahi (1994) described the development of this aqueous phase as when “there is a surplus of water above what is needed to hydrate the dry components (i.e. protein, pentosans, starch, etc) during mixing.” At least 35% of the total dough weight of water is required for hydration of the proteins to allow for entrapping air and gas expansion during fermentation within this phase (Gan et al 1995).
Mixing determines the distribution of the ingredients and flavor constituents within this liquid phase (MacRitchie 1976a). MacRitchie (1976a) described the structure and composition of the liquid phase, which is continuous in the dough, as being based on the “equilibrium between
the solutes present in the liquid phase and corresponding solid phase.” The make-up of this liquid phase or liquor is comprised of a combination of components including non-starch
polysaccharides, lipids and proteins as well as malto-oligosaccharides, and arbinoxylans (Salt et al 2006). The combination of these varying constituents in the liquid phase helps to promote stabilization of air cells and provides much of the dough structure allowing for the growth of the dough during fermentation, proofing, and baking.
1.2.8. Aqueous phase formed by lipids and water
The interaction of polar and nonpolar lipids with water plays an important role in understanding lipid functionality within a complex system such as dough. In this type of a system, polar lipids will more readily bind with water while nonpolar lipids will not (Carlson et al 1978). Looking at the internal phase behavior of wheat lipid-water interactions using x-ray diffraction, Carlson et al (1978) observed the phase behavior of this system and illustrated it using a ternary diagram (Figure 1.3). Both the nonpolar and polar lipid fractions make up the corners of the triangle. For this model, sufficient amounts of water must be present in order to hydrate the lipids and the ratio of nonpolar to polar lipids influence changes in crystalline phase behavior. Several different phases are seen including both an oil phase and a water phase that contained no polar lipids and two phases that consisted of a combination of lipids and water. The lipids + water combinations formed are described as an L2-phase and a liquid-crystalline phase. Depending on the water concentrations when added back with total extractable lipids (containing both polar and nonpolar), an oil phase formed on top and at lower concentrations of water. Two distinctive liquid-crystalline formations were created: hexagonal-liquid crystalline and lamellar-liquid crystalline (Carlson et al 1978).
(Carlson et al 1978) Figure 1.3. Ternary phase diagram of wheat lipids in water
The lamellar liquid crystalline phase is formed with varying compositions of lipids. However, increasing the quantity of water causes a conversion to an L2 phase. These phases (L2 and lamellar-liquid crystalline) are bilayers and the thicknesses of these complexes are dependent on the ratios of nonpolar and polar lipids (Carlson et al 1978). The greater the amount of polar lipids present in the layer causes a reduction in the thickness due to the ability to orient tightly. Nonpolar lipids, which are hydrophobic, must be oriented differently to avoid contact with water (Carlson et al 1978). Also, the varying types of polar lipids will cause or form different liquid-crystalline configurations, hexagonal liquid-liquid-crystalline or lamellar liquid-liquid-crystalline, with water (Carlson et al 1978). MGDG will form hexagonal configurations while phospholipids and DGDG form lamellar configurations (Carlson et al 1978). The L2 phase that is created by native wheat lipids is unique in that the oil layer is created only when extra water is available (Carlson et al 1978). This layer is made through the melting of the other two crystalline forms (hexagonal and lamellar) by the addition of heat (Carlson et al 1978). The formations of these crystalline phases influence dough rheological properties as the lamellar crystalline phase create “films at the interphase between starch/water, oil/water, and air/water” while the hexagonal phases create “aggregates” (Carlson et al 1978).
Carson et al (1979) studied the interaction and phase behavior of wheat lipids extracted from gluten and water. Similar to the wheat lipid-water ternary diagram determined by Carlson et al (1978), the gluten lipid-water combinations also produced four different phases: oil phase, water phase, L2 phase, and lipid-crystalline phase. Within the liquid-crystalline region, the solubility of the nonpolar lipids were directly correlated with the amount of water added, thus as water content increased, the more nonpolar lipids were dissolved into the system. Also, the addition of salt to the system caused a reduction in the amount of nonpolar lipids dissolved (Carslon et al 1979). The opposite was seen in the wheat lipid-water system for the nonpolar lipids as the water content increased, less nonpolar lipids were dissolved (Carlson et al 1978; Carlson et al 1979). The presence of salt in the gluten-lipid system caused a reduction in thickness of the lamellar liquid-crystalline phase (Carlson et al 1979). The liquid phase (L2) overall was smaller in the gluten-lipid system as compared to the wheat lipid system (Carlson et al 1979).
From the understanding of both of these complex systems (gluten-water and lipid-water), the lamellar liquid crystalline phase had the greastest effect on the baking characteristics. This was mainly due to surface active constituents that act at the air/water or oil/water interface (Carlson et al 1979). In dough systems, these lipids are able to move to the gas/liquid interface creating a “monolayer,” where they expand and stretch, which reduces the overall interfacial tension and promotes the stabilization of the air cell (Gan et al 1995). The lamellar-liquid crystalline phase easily assembles in small groups (liposomes) at the interface following the mixing of water with the flour (Gan et al 1995). The lamellar liquid-crystalline formation, which has a configuration more like shortening or structured lipid, is able to diffuse between the phases easier than the hexagonal liquid-crystalline arrangement (Gan et al 1995). These layers of lipids that are compacted together move to the surface of the gas/liquid layer throughout all stages of the bread development, making it better suited for gas cell stabilization (Gan et al 1995).
1.2.9. Role of native wheat lipids in bread
Sahi (1994) found through electrical conductivity testing, that this film lining the phase of the gluten-starch matrix is a “continuous phase throughout the dough instead of being in discrete droplets.” It was confirmed that there is an interface in which both protein and lipids are present and that more protein at the interface, provides more elastic behavior to the dough (Primo-Martin
et al 2006). Gan et al (1990) found, indirectly, that a “liquid film” layer that aligned the air cells and the gluten-starch matrix preventing gas loss or cell coalescences. This layer formed as an independent interface between the air cells and the liquid phase and contained components that were able to align at the interface due to their surface activity. A combination of proteins, lipids, pentosans, and other surface active compounds make up this film and they are able to move to that interface and give it stability over time (Gan et al 1990; Sahi 1994). During the later stages of proofing and baking when cell expansion is the greatest, the network begins to stretch then these surface active agents play the most functional role (Gan et al 1990; Gan et al 1995).
Without this film, if breakdown or excessive stretching weakens the network, the gas cells would be more susceptible to migrating towards one another or becoming lost to the environment (Gan et al 1990). The breakdown or separation of the thin liquid film appears to be the cause of the loss of gas cells to the environment during the later stages of proofing (Gan et al 1995). The polar lipids have shown to be able to interact to form a lipid bilayer, which consist of the lamellar liquid-crystalline phase and thus can move to the interface surface creating what is known as a lipid monolayer (Gan et al 1995).
The proteins can stabilize at the air/liquid interface because of their visco-elastic properties and ability to maintain integrity through expansion and movement of air cells (Sahi 1994). Lipids, on the other hand, exhibit or act by a mechanism described as the
Gibbs/Marangoni effect that is premised on the amount of lipids initially present (Primo-Martin et al 2006). This effect describes the shifting of the components in the film due to the pressure at the interface, moving them to or from areas where they come into contact with other dispersed droplets (MacRitchie 1976b). This mechanism that lipids use to stabilize the film has a greater surface tension than that produced by the fermentation of CO2, which allows it to maintain and prevent coalescence of cells (Sahi 1994). The combination of protein and lipid films is the most effective in securing and maintaining gas cells within the network (Sahi 1994). The maintenance of this liquid monolayer is dependent on several factors including “film viscosity, shear
resistance, and elasticity” of the dough (Gan et al 1995).
Originally, Gan et al (1990) based the theory of liquid lamellae from SEM images of gluten-starch matrix during the various phases of dough development (1990). Sroan et al (2009) reevaluated this hypothesis and determined that native lipids formed a film that stabilized the air cells and supported the gluten-starch matrix. Using two soft wheat varieties with protein contents