MONEY FOR GOOD UK
Understanding donor motivation and behaviour
Sally Bagwell, Lucy de Las Casas, Matt van Poortvliet, Rob Abercrombie
March 2013
Funded by:
Acknowledgements
We would like to thank our partners for their support and contributions to this research:
• Ipsos MORI worked with NPC on survey design, conducted all qualitative and quantitative research, provided initial analysis of results, and created the seven donor segments based on survey findings.
• Hope Consulting provided advice and access to materials from the original Money for Good research conducted in the US, and offered valuable support from survey design through to analysis of the results and segmentation.
This research was supported at all stages by the input of an advisory group, made up of experts in this field, who provided invaluable guidance through scoping and survey design; important insights and context for interpretation of findings; and feedback on outputs from the research. The advisory group comprised:
• Dr Beth Breeze, Researcher, Centre for the Study of Philanthropy, Humanitarianism and Social Justice, University of Kent
• Richard Harrison, Director of Research, Charities Aid Foundation
• Jen Lexmond, Learning Lead, Nesta
• Cathy Pharoah, Co-Director, Centre for Charitable Giving and Philanthropy
• Nick Mason, Head of Fundraising, Strategy and Development, Royal National Institute of Blind People (RNIB)
• Hugo Middlemass, Director of Fundraising, Leonard Cheshire Disability
• Amanda Shepard, Director of Organisational Membership, Institute of Fundraising
• Sarah Smith, Professor of Economics, Bristol University.
We would also like to thank Sarah Stachowiak, Senior Vice President at Organizational Research Services, and Victoria Vrana, Senior Program Officer at the Bill & Melinda Gates Foundation.
We are particularly grateful to the funders of this research for their generosity and flexibility. The report is funded by the Bill & Melinda Gates Foundation, Nesta, Oak Foundation and Pears Foundation.
FOREWORD
Using money to do more good
Charities are being asked to perform an ever-expanding role as the state withdraws financial support from a whole set of areas and activities, leaving the voluntary and community sector to pick up the slack. At the same time, many are receiving less income from government contracts and grants.
In this climate, funding from individual donors plays a particularly valuable role. Nearly half of UK voluntary organisations receive the majority of their funding from individuals1; last year donors gave £9.3bn.2 This funding tends to be flexible and unrestricted—it allows charities to innovate, invest in new approaches and explore better ways of doing things.
That makes a focus on who is donating, why they are doing so, and how we might get them to donate more, absolutely essential. So we are very pleased to produce Money for Good UK to help the sector think about these issues. We are grateful to our collaborators at Ipsos MORI and Hope Consulting, our advisory board, and of course our funders: the Bill & Melinda Gates Foundation, Nesta, Oak Foundation and Pears Foundation. This major research by NPC suggests that tax incentives are not the key here. Nor does ease of donating seem to be the main issue. Much more important is the lack of a culture of giving in the UK that says if you can afford to, you give. One outcome of this study should be a major push by government, academics, and the sector itself to consider why this is and to see if we can change it. ‘Nudge’ approaches and behavioural economics are bound to have a role to play here.
A key finding from our research is that donors find it hard to understand where their money goes, and if the charities they support really make a difference. The figures in the report are striking. If charities improved the way they communicate impact and explain how donations are used, they could potentially attract around £665m more in donations. And equally important, donations might flow to better places. The evidence in this report suggests that £1.7bn might move to better-performing charities if donors could more easily find and understand information about their impact.
Of course people donate based on cause and emotion—a picture of a child in need trumps a whole lot of
analysis, whatever impact geeks might hope. But there is a call here to charities, their advisors and supporters, to bring the measurement and communication of the difference they really make closer to the heart of what they do.
Dan Corry
Chief Executive, NPC
1
Clark, J. et al (2012) The UK Civil Society Almanac 2012. National Council for Voluntary Organisations. 2
KEY MESSAGES
Money for Good UK aims to:
• Increase understanding of high-income donors.
• Understand donors’ underlying motivations and create a segmentation to help understand their behaviour.
• Investigate what donors think about impact, and the process they go through before making a donation.
• Use the results from the research to consider how giving levels can be increased, and how donors can be influenced to consider where their giving can have the most impact.
1. Donor
behaviour
2. Influences
on giving:
information
and research
3. Donor
segmentation
4. Increasing
giving
5. Increasing
the impact of
giving
• Less than half of donors think people should donate if they have the means.
• Average annual donation increases with household income, from £228 given by donors with an income under £20,000, to £3,322 given by donors with an income of £1m or above.
• Donors who give both time and money to a charity give a higher average donation than those who give only money.
• Donors respond to personalised communications from charities that they have a relationship with, and prompts from family, friends or colleagues.
• Donors care about impact—three in five pay close attention to impact, but only a small proportion use this information to choose between charities.
• 38% of donors do research before making their largest donation.
• The Money for Good UK segmentation is the first large-scale attitudinal segmentation of both mainstream and high-income donors in the UK.
• Cause is a strong motivating factor for a majority of donors.
• Donors care about impact for different reasons: concern for the cause, personal involvement in the organisation, and concerns about how a charity could reflect on the donor.
• Charities underperform in the areas donors care most about: explaining how donations are used and providing evidence of impact.
• If charities did a better job in the areas they care about, donors could give up to £665m more, and donors giving £1,740m might be persuaded to switch their donations.
• Financial reasons and distrust of charities were the two biggest reasons for non-donation.
• Charities could benefit by responding to donors’ interest in impact
• Encouraging donors to think about what charities achieve could help ensure funds are directed to where they will make the biggest difference.
CONTENTS
Introduction ... 5
Methodology ... 7
1. Donor behaviour ...11
Duty to give ... 12 Amount given ... 13 Method of giving ... 19 Loyalty ... 21 Giving time ... 22 Cause ... 27Comparing mainstream and high-income donors ... 29
2. Influences on giving: Information and research ...31
Information sources leading to a donation ... 32
Factors donors pay attention to ... 34
Donor research ... 35
3. Donor segmentation ...38
Segment profiles ... 41 Loyal supporter ... 42 Ad hoc giver ... 43 Good citizen ... 44 Faith-based donor ... 45 Engaged champion ... 46 Benefactor ... 47 Thoughtful philanthropist ... 48 Key themes ... 494. Increasing giving ...52
Encouraging donors to give more ... 53
Encouraging non-donors to give ... 58
Encouraging volunteering ... 61
5. Increasing the impact of giving ...64
Implications ... 65
6. Conclusion ...68
Recommendations ... 68
What next? ... 70
INTRODUCTION
Charities face a tough financial environment in the UK: public funding cuts come at a time of increased demand for their support, as public services are scaled back. In this context donations from individuals are extremely important, and becoming more so. But recent research suggests that these donations may be decreasing3—a worrying prospect for many charities and those they work to help.
In this environment, charities need to understand what can encourage donors to give more. Available resources need to find their way to the areas of greatest need, and to the organisations which will make the greatest
difference with these funds. Funders—particularly government—increasingly require charities to demonstrate their impact, and many are therefore embracing performance measurement.4 But we still don’t understand how donors feel about charity performance and impact, and whether this influences their giving.
Money for Good UK aims to increase the volume of donations in the UK, and to encourage donors to make well-informed decisions about their giving so they give their money and time where it can make the biggest difference. In this report, we combine data on charitable giving with information about donor motivations to produce an attitudinal segmentation. We hope the findings will help to give charities an insight into the preferences of their donors and to develop more effective fundraising relationships. We also hope to provide insight for policymakers, charity sector infrastructure bodies, and others who seek to encourage donors to give generously and effectively. Money for Good UK is a New Philanthropy Capital (NPC) research project funded by the Bill & Melinda Gates Foundation, Nesta, Oak Foundation and Pears Foundation. Ipsos MORI conducted the quantitative and qualitative research for this report, including the segmentation analysis. The findings are based on a survey of over 3,000 respondents from the UK donor population, and build on the original Money for Good research conducted in the US by Hope Consulting, which was a partner in this project. We drew heavily on the advice and expertise of an advisory group throughout the research, and we are very grateful for the input of all those
involved—full details of this group can be found in the methodology section. The opinions expressed in this report are those of NPC, and not of the Money for Good UK funders, partners or advisory group.
This report draws on a body of previous research by individuals and organisations, many of whom were
represented on our advisory group. Large-scale studies of giving and volunteering already exist in the UK, as do in-depth qualitative investigations into the motivations and preferences of high-net-worth donors. To our
knowledge, this is the first large-scale study with a substantial sample of higher-income donors that investigates both giving behaviour and motivation.
Aims
Money for Good UK aims to increase the quantity and quality of giving in the UK. It aims to enhance our
understanding of how donors give, what they want from their giving and what drives them. For the purpose oft his research, a donor is defined as an individual who has donated at least £50 in the last year.
In particular, Money for Good UK aims to:
3
NCVO and CAF (2012) UK Giving 2012: An overview of charitable giving in the UK, 2011/12. 4
Ni Ogain, E., Pritchard, D. and Lumley, T.(2012) Making an impact: Impact measurement among charities and social enterprises in the UK. New Philanthropy Capital.
• Increase understanding of high-income donors (those with a household income of over £150,000 a year). Most existing research focuses on mainstream donors, or is qualitative research exploring the attitudes of small numbers of high-net-worth donors (usually defined as having investable assets greater than US$1m). This research aims to provide information to facilitate charities’ engagement with the important high-income donor group.
• Understand donors’ underlying motivations and create a segmentation to help understand their behaviour. Many charities already segment their donors based on information they collect about demographics and donation history. This type of segmentation is useful, but only feasible for large fundraising charities. These segmentations can be limited because they are based on existing behaviour, rather than looking at underlying motivations, making it difficult to use them to assess the potential to change behaviour. Money for Good UK seeks to help charities of all sizes understand not just how and when donors give, but why. Charities can build on this to inspire more giving.
• Investigate what donors think about impact, and the process they go through before making a donation. This report examines the different factors that donors say influence their decisions on giving, whether they do research, what they look for, and how they use this information. It aims to help charities understand what to communicate to donors to influence their giving.
• Use the results from the research to consider how giving levels can be increased, and how donors can be influenced to consider where their giving can have the most impact. This report is a starting point for further discussion about how the findings can be used in practice—a process which must be done in collaboration with experts in the field and those with practical experience of fundraising.
Audience
Charities are a key audience for this research. For fundraisers it provides a useful and practical segmentation of donors, and a greater understanding of high-income donors. For charity directors and managers, it offers a clear message that understanding how donations are used and the impact a charity achieves are a priority for donors, and that equipping fundraisers with information on a charity’s results can help them meet donor needs.
Policymakers and those trying to influence giving behaviour more broadly will be interested in findings about societal attitudes to giving, giving methods, what donors think charities do well and less well, incentives for giving, and the opportunity to increase giving.
Charity sector infrastructure bodies, including those for fundraising and volunteering, will be interested to hear how they can best support charities to meet donor needs, and learn about opportunities to encourage donors to think about impact and charity performance.
This research is also of interest to donors, intermediaries and advisors to donors, and engaged funders with an interest in impact.
We also hope that the raw data from the research presents opportunities for further analysis from researchers to reveal additional insights. We welcome expressions of interest from anyone who would like to work with us to explore the data further—please get in touch by emailing [email protected].
Scoping: literature review and learning from Money
for Good US Qualitative research: 2 focus groups, 6 interviews Survey design and feasibility survey Survey of 3,000 individuals Data analysis and segmentation
METHODOLOGY
This section outlines the methodology for the Money for Good UK research. It also lists sources of further information on this research, and offers readers some notes on the research to help with interpretation of the data presented in the report.
The core of Money for Good UK was an online survey of 3,000 respondents. We surveyed:
• Mainstream donors: people with a household income under £150,000 donating at least £50 in the last 12 months.
• High-income donors: people with a household income above £150,000 donating at least £50 in the last 12 months.
• Non-donors: people who donated less than £50 in the last 12 months (covering all income levels).
The full survey comprised the following populations: Mainstream donors (household
income under £150,000): 1,699
High-income donors (household
income over £150,000): 861 Mainstream non-donors: 302 High-income non-donors: 143
Initial scoping
This work is based on research conducted by Hope Consulting into the donor population in the US. Hope Consulting shared its survey and materials with NPC, which provided a starting point for the development of our research aims, survey population, and questionnaire design.
NPC conducted a literature review including studies of giving behaviour in the UK and internationally, experimental research on generosity, and research into philanthropy among high-net-worth individuals.
Qualitative research
An initial qualitative phase of research was used to inform survey design. Two focus groups were conducted with participants earning between £50,000 and £150,000. One group comprised donors who gave through committed methods, and the other those who gave in non-committed ways.
In addition, in-depth interviews were conducted with six high-income participants (earning more than £150,000 per year). This qualitative research was conducted in late July and early August 2012.
Survey design and feasibility
Ipsos MORI conducted a scoping study to identify the incidence and profile of the two survey target groups: mainstream donors and high-income donors. The scoping study for mainstream donors was conducted using Ipsos MORI’s Online Access Panel (which was also the sample source for this survey)5 using the WebCruiser screening tool6. The scoping study for high-income donors was conducted via a specialist high-net-worth panel (the sample source for this group), due to low penetration of the target group. This panel had a pre-defined criteria for inclusion of personal income over £150,000, in comparison to the survey criteria of household income over £150,000 a year. In both cases respondents were asked whether they had donated £50 to charity in the last 12 months.
For mainstream donors, 39% of respondents had given at least £50 to charity in the past 12 months. For high-income donors, 94% of people with a personal high-income over £150,000 had given at least £50 to charity in the past 12 months.
For mainstream donors, the results of the scoping study were used to inform the quotas and weighting scheme for the main survey (see below). For high-income donors there is not an accurate profile available, so no weighting or quotas were applied to the main survey.
Survey
The survey was conducted during October 2012.
The survey population was split into three income groups, with donors and non-donors, making six survey sample groups in all, with a total of 3,000 respondents. Sample sizes were not intended to be representative of the population, they were designed to focus on donors, particularly high-income donors.
<£50,000 donor 850 £50,000-£149,999 donor 849 £150,000+ donor 861 <£50,000 non-donor 150 £50,000-£149,999 non-donor 152 £150,000+ non-donor 143
For mainstream donors (with a household income up to £150,000), survey responses were collected according to demographic quotas (age, gender, region, income, social grade and working status) to ensure responses were representative of the population. In the middle-income group, quota numbers for donor respondents with an income of £100,000-£149,999 were increased to ensure a sufficient sample size for analysis. The natural fallout of respondents in this income group would have been 12% (102 in a population of 850), and this quota was increased to 250 respondents.
The data for all mainstream donor respondents was weighted based on population data to account for non-response, and for sample increases (ie, the increased quota for the household income level £100,000-£149,999 described above). Data for mainstream non-donors was also weighted. We have combined the weighted data of the two lower-income groups into one population for analysis in this report.
For high-income donors (£150,000+ household income) quotas were not applied, due to the difficulties of reaching sufficient respondents to fulfil overall targets. The data was not weighted because of the lack of an accurate population profile to use.
5
The Ipsos MORI Online Access Panel consists of individuals who have opted in to being included in research. The panel is actively managed, recruiting new panellists and updating their information.
6
The WebCruiser is used to screen Ipsos MORI’s Online Access Panel to identify the incidence of a particular target group prior to setting fieldwork targets. The WebCruiser ran from 5th to 25th July, during which time 28,628 panellists answered the
Segmentation
Specific questions throughout the questionnaire were identified in advance to drive the segmentation, with other questions used to understand the profile of the segments in more detail. The segmentation was reached in two main ways:
• A max-diff exercise,based on a single question with 12 responses, forced participants to trade off different factors relating to their charitable giving, which allowed us to rank them by importance.
• Factor analysis, based on 40 responses from seven questions occurring throughout the survey, covered attitudes, beliefs, and charity donation behaviours. Fourteen factors or underlying dimensions, which were answered in similar ways by respondents, were created to use as input variables for the segmentation. Using these inputs, a number of different segment solutions were produced, and the seven-segment solution was felt to be the most useful and robust. Segments are not defined by a single variable; often two or more segments rank highly on certain variables. The seven-segment solution produced segments that were distinctive in important aspects of their attitude or behaviour, even where similar to other segments in certain respects. All donor respondents were allocated to a single segment.
The segmentation analysis was conducted on un-weighted data, and the reporting of segment characteristics is based on un-weighted data. However, reporting on the proportions of different segments in the population was done using weighted mainstream donor data, to offer an accurate representation of their fall-out in the UK population as a whole.
Partners
Ipsos MORI was the research partner for Money for Good UK. NPC and Ipsos MORI worked together on survey design, and Ipsos MORI conducted all qualitative and quantitative research, provided initial analysis of results, and created the seven donor segments based on survey findings. All data presented in this report comes from the survey, which Ipsos MORI conducted.
Hope Consulting has provided advice and access to materials from the original Money for Good research conducted in the US and offered valuable support, from survey design to analysis and segmentation.
This research was supported at all stages by the input of an advisory group, made up of experts in this field. NPC extends grateful thanks to the Money for Good UK advisory group for its involvement throughout the project: invaluable guidance through scoping and survey design; important insights and context for interpretation of findings; and feedback on outputs from the research. The advisory group comprised:
• Dr Beth Breeze, Researcher, Centre for the Study of Philanthropy, Humanitarianism and Social Justice, University of Kent
• Richard Harrison, Director of Research, Charities Aid Foundation
• Jen Lexmond, Learning Lead, Nesta
• Cathy Pharoah, Co-Director, Centre for Charitable Giving and Philanthropy
• Nick Mason, Head of Fundraising, Strategy and Development, Royal National Institute of Blind People (RNIB)
• Hugo Middlemass, Director of Fundraising, Leonard Cheshire Disability
• Amanda Shepard, Director of Organisational Membership, Institute of Fundraising
Notes on the research
These notes highlight key points about definitions, analysis and presentation of the data, which are useful for understanding and interpreting the data presented later in the report.
• Non-donors have been defined as those who gave less than £50 in the last year. Many are in fact low-donors. This definition is set intentionally high as those giving at a lower level would be unable to answer many of the questions in the survey. Non-donors answered a much shorter questionnaire, and were not included in the segmentation.
• Where we have relatively few responses from high-income donors, demographic groups have been combined for analysis. The highest age bracket for high-income donors is 55+ (for mainstream donors this splits further into 55-64, and 65+). Some regions have also been grouped in the geographical analysis for high-income donors.
• Respondent numbers are indicated on all graphs. Where respondent numbers differ to those stated above, some respondents will have been filtered out by their answers to previous questions.
• Where an average is stated, we are using an adjusted mean, which excludes outlier values.
• All the data for mainstream respondents (donors and non-donors) has been weighted according to demographic factors: gender, region, social grade, age and income.
• Differences in donor behaviour by demographic may be partly explained by other factors, such as income, which have not been controlled for in the analysis.
• Throughout the report, some survey responses have been shortened for display on graphs. The survey questions and response options are available in appendix A.
• Percentages have been rounded, and in some cases this leads to totals of more or less than 100%.
• For some questions, respondents were invited to select multiple responses. This has been indicated in notes to the graphs.
• Several questions included responses related to impact, by which we mean the effectiveness or performance of charities. The nature of the online questionnaire made it impractical to include a detailed definition of terms, and we cannot assume that all respondents understand impact in the same way. While recognising this limitation, we believe that the inclusion of impact responses alongside other factors provides interesting information on the level of donor interest in impact.
Further information
Further information exists, should readers wish to explore any aspect of the research in more depth.
• The full survey is available in appendix A. Details of how the additional giving calculations were reached is available in appendix C.
• NPC would like the data from this research to be a resource for the sector. Detailed data tables, along with the full data set, are available on request. Please email [email protected] to request these.
• Ipsos MORI’s research findings present the results of the research in some detail, and contain appendices with the data tables from the survey. The full document can be downloaded from the NPC website.
• Ipsos MORI’s technical report provides more detail on the methodology. It can be downloaded from the NPC website.
• Hope Consulting’s original report on the US donor market can be downloaded from the Hope Consulting website.
1. DONOR BEHAVIOUR
In this section, we discuss data relating to giving levels of donors, the causes they give to, and how they give. Money for Good UK adds to the substantial body of evidence already in this area, and in some places provides interesting comparisons to existing work.7 This section analyses donor behaviour according to demographic factors, and gives a new insight into the similarities and differences between mainstream and high-income donors.
The donor population for this survey is those who donated at least £50 to charity in the past year. This is 39% of those with a household income of less than £150,000, and 94% of those with a personal income over £150,000. Because the primary focus of this research is individuals who have donated more than £50 in the last year, it is not designed to provide information on the giving of the general population.
In this section we answer the questions:
• Do people feel a duty to give to charity?
• How much do people give?
• What methods do people use to give?
• How loyal are donors?
• Do people give time?
• What do people give to?
• What are the key differences between mainstream and high-income donors?
Key findings
• Less than half of donors think people should donate to charity if they have the means.
• Average annual donation increases with household income, from £228 given by donors with an income under £20,000, to £3,322 given by donors with an income of £1m or above.
• Level of giving increases with age for mainstream donors, but among high-income donors the young have the highest average donation.
• Ad hoc methods of giving are the most commonly used, but the preferred method is direct debit.
• Donors are loyal in their key charity relationships.
• Nearly half of all donors also volunteer.
• Donors who give both time and money to a charity give a higher average donation than those who give only money.
7
For example, NCVO and CAF’s UK Giving (2012), CGAP’s The new state of donation: Three decades of household giving to charity (2011), and the Cabinet Office’s Helping Out: A national survey of volunteering and charitable giving (2007).
44%
47%
9%
People should not feel obliged to donate money to charity People should donate money to charity if they have the means I do not agree with either statement
Duty to give
The survey tested perceived obligation to give to charity and whether donors should aim to give a proportion of income.
Figure 1: Should people feel obliged to donate to charity?
‘Which of the following statements do you most agree with?’ Mainstream N=1699
• Figure 1 shows 47% of mainstream donors agree that ‘people should donate money to charity if they have the means.’ An almost equal percentage (44%) think that ‘people should not feel obliged to donate money to charity’.
• The results do not differ significantly between the mainstream and income populations (In the high-income group: ‘People should not feel obliged to donate money to charity’, 44%; ‘People should donate money to charity if they have the means’, 46%; ‘I do not agree with either statement’, 10%)
• Only 15% of mainstream donors are willing to indicate a proportion they feel people should aim to give. A total of 72% say they don’t think people should aim to donate a proportion of their income, and 13% don’t know.
• A very similar pattern emerges for high-income donors; only 14% indicate a target proportion, leaving 76% declining to state a percentage, and 10% who don’t know (under 100% due to rounding).
It is striking that almost half of donors do not think people should feel obliged to donate, given that this figure is based on a sample of those who donated over £50 to charity in the last year. The sense of duty to donate may be even weaker in those who donate at a lower level or not at all. We have not found directly comparable research about donors’ views of obligation to give either in the UK or internationally. Estimates of giving levels in the UK
Less than half of donors think people should donate to charity if they have the means.
Mainstream donors suggest giving 6.5% of income compared to the high-income population, which suggests 4.7%.
vary between 55%8 and 72% of the population.9 In addition, very few donors are willing to suggest a giving level for society as a whole. Those who do suggest a proportion of income suggest figures far higher than those we see in practice.
It is interesting that donors do not feel a stronger social duty to give as income increases; high-income donors are equally likely to think people should donate, and suggest giving a lower proportion of annual income, mirroring the pattern for actual giving levels. This has important implications for policymakers and those eager to increase giving; it may prove difficult to shift these perceptions or to foster a sense of duty to give.
Amount given
The survey asked how much respondents had donated to charity in the past 12 months. We are able to analyse this data by a range of demographic factors. Differences are likely to be explained to some extent by other factors, such as income.
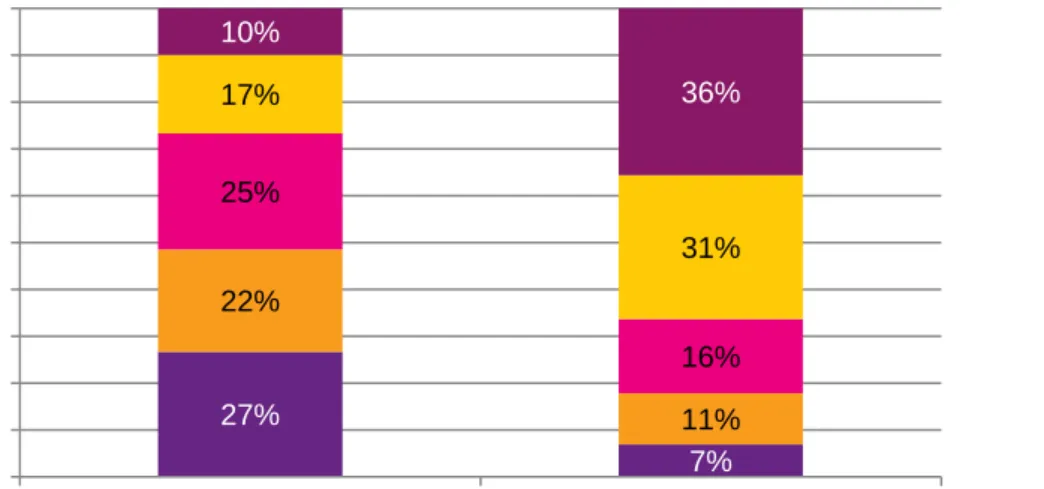
Figure 2: Donation level and average donation by income bracket
Mainstream N=1699, high-income N=861. Totals exceed 100% due to rounding.
• Figure 2 shows that almost half of mainstream donors gave between £50 and £100 in the past year. A further 25% gave between £101 and £200 and 10% gave over £500 annually.
• Of high-income donors, the largest proportion (36%) gave over £500 in the last year. A further 31% gave between £201 and £500, and 33% gave £200 or less (numbers on figure 2 total 34% due to rounding) .
8
NCVO and CAF (2012) UK Giving 2012: An overview of charitable giving in the UK, 2011/12 9
CAF (2012) World Giving Index 2012: A global view of giving trends
High-income donors give four times more per year than mainstream donors. 27% 7% 22% 11% 25% 16% 17% 31% 10% 36% 0% 10% 20% 30% 40% 50% 60% 70% 80% 90% 100% Mainstream High-income £501+ £201-500 £101-200 £76-100 £50-75 average £303 average £1,282
27% 35% 35% 21% 22% 21% 22% 22% 19% 26% 20% 21% 25% 21% 25% 29% 24% 26% 17% 15% 14% 16% 20% 19% 10% 7% 7% 8% 15% 13% 0% 10% 20% 30% 40% 50% 60% 70% 80% 90% 100% Average across mainstream 18-34 35-44 45-54 55-64 65+ £501+ £201-500 £101-200 £76-100 £50-75 £303 £270 £282 £268 £334 £349
Figure 3: Average annual donation, split by household income band
Mainstream N=1699, High-income N=861
Average annual donation increases with household income, from £228 given by donors with an income under £20,000, to £3,322 given by donors with an income of £1m and over.
Age
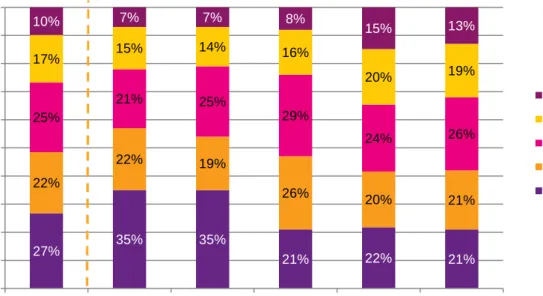
Figure 4: Donation level and average donation by age (mainstream donors)
Mainstream N=1699. Figures above columns show mean donation for each age group. Some totals exceed 100% due to rounding. £228 £313 £354 £519 £1,078 £1,644 £2,746 £3,322 £0 £500 £1,000 £1,500 £2,000 £2,500 £3,000 £3,500 Mainstream average £303 High-income average £1,282
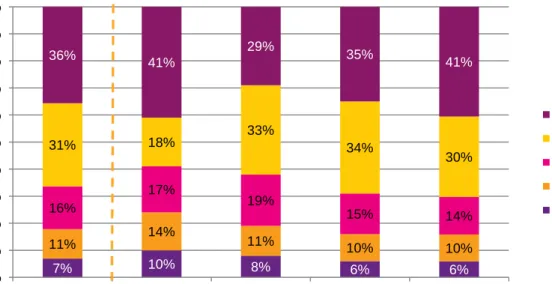
7% 10% 8% 6% 6% 11% 14% 11% 10% 10% 16% 17% 19% 15% 14% 31% 18% 33% 34% 30% 36% 41% 29% 35% 41% 0% 10% 20% 30% 40% 50% 60% 70% 80% 90% 100% Average across high income 18-34 35-44 45-54 55+ Age Group £501+ £201-500 £101-200 £76-100 £50-75 £1,282 £2,301 £1,140 £1,078 £1,345
Figure 5: Donation level and average donation by age (high-income donors)
High-income N=861. Figures above columns show mean donation for each age group.
• Figure 4 shows that in the mainstream bracket, the average donation varies between £270 for those aged 18-34, and £349 for those over 65.
• Figure 5 shows that in the high-income population, young donors aged 18-34 give the highest average donation, with older donors aged over 55 giving the second highest amount.
• Equal proportions of high-income donors in the 18-34 and 55+ age groups give over £500 a year. The higher average in the 18-34 age group is driven by a few donations in the sample, which are considerably above the £500 upper bracket.
Level of giving increases with age for mainstream donors, but among high-income donors the young have the highest average donation.
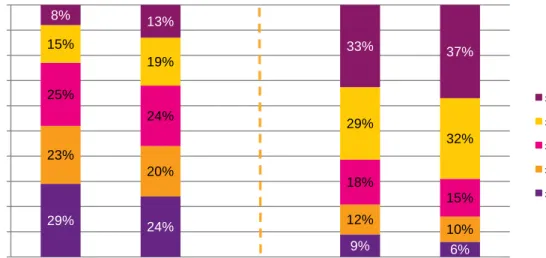
29% 24% 9% 6% 23% 20% 12% 10% 25% 24% 18% 15% 15% 19% 29% 32% 8% 13% 33% 37% 0% 10% 20% 30% 40% 50% 60% 70% 80% 90% 100% £501+ £201-500 £101-200 £76-100 £50-75 £260 Men Men Women Women £349 £979 Mainstream High-Income £1,417
Gender
Figure 6: Donation level and average donation by gender
Mainstream N=1699, high-income N=861. Figures above columns show mean donation for each group. Some totals exceed 100% due to rounding.
• As figure 6 demonstrates, giving varies by gender, with men giving more in both income brackets. Male mainstream donors give an average of £349 per year compared to £260 for women.
• In the high-income bracket men give an average of £1,417, whereas women give an average of £979.
• These findings may reflect gender differences in personal (rather than household) income and the methodology used, as discussed below.
Region
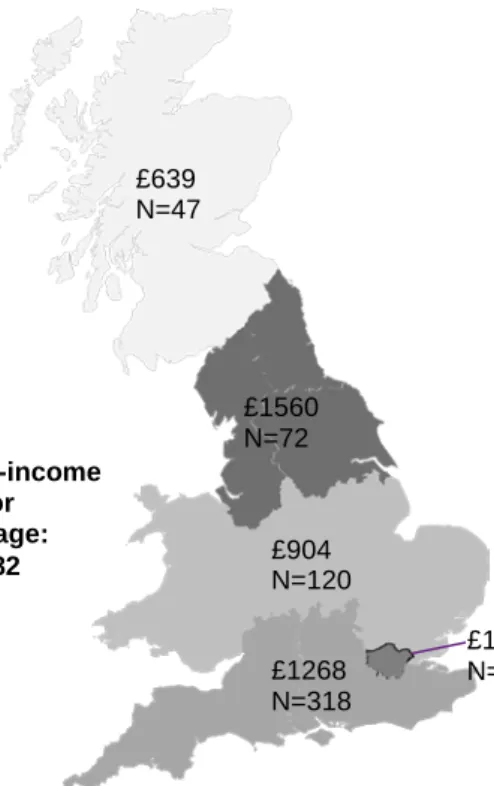
Figure 7: Average donation by region
Mainstream N=1699, high income N=861
Regions are shaded dark (high average gift) to light (low average gift). High-income sample sizes are small, so the number of respondents has been included. Some regions have been combined in the high-income map, due to low response numbers. For both income groups, Northern Ireland has been omitted due to the low number of respondents.
• Figure 7 shows that mainstream donors give most in Scotland, the Midlands, the South West and Wales. Areas giving less are the North and Yorkshire, and the North West.
• For high-income donors, the geographical picture is a little different. The survey indicates that London and the North give most, whilst the Midlands gives less.
• Mainstream donors in Scotland give among the highest amounts, but high-income donors give comparatively lower donations. The high-income result is based on a small sample size of 47 respondents, and therefore may not be representative.
• These differences in giving levels may reflect other regional differences, such as income.
Mainstream donors give an average of £303 per year, and this level of giving is comparable with that found in previous research: UK Giving 2012 found an average annual gift of £324.10 Analysis of the proportion of income donors give suggests that those in the lower household income brackets give a higher proportion of their income to charity. However the £50 threshold used to define a donor in this research will have influenced this finding, as this figure is already a greater proportion of income for lower-income donors than those in higher-income bands. Previous research has found that among donating households, donation as a proportion of spending decreases, as spending increases, but when non-donors are included in analysis (thereby taking into account the likelihood of
10
NCVO and CAF (2012) UK Giving 2012: An overview of charitable giving in the UK, 2011/12. £223 £241 £268 £276 £328 £356 £375 Mainstream donor average: £303 High-income donor average: £1,282 £639 N=47 £1560 N=72 £904 N=120 £1268 N=318 £1491 N=301
donating) the rate of donation is around 0.4% of household budget across all income ranges.11 Nonetheless it is clear that no income brackets approach the suggested donation levels of 6.5%, or 4.7% of income which were identified in our earlier analysis.
The findings concerning age are particularly interesting in light of recent research, which has identified a generation giving gap.12 Our research found high-income donors in the 18-34 age group gave high average donations. One interpretation of this could be that low levels of donations by younger people reflect a lack of disposable income, rather than a lack of charitable sentiment. This echoes recent research which found that wealthy young people were often engaged and enthusiastic donors.13
The finding that male donors give a higher average donation than female donors stands in contrast to previous research, which has found that women give more.14 This may reflect the £50 threshold used to define a donor. In addition, respondents are categorised according to household income, but were surveyed about their personal donations.
Similarly, regional findings may reflect differences in income profiles of the regions. For example, the lowest average donation is seen in the North and Yorkshire region, which has lower than average income levels. However it is interesting to see that the relatively high levels of giving in Scotland and the Midlands, and low giving in London and the South East, run counter to patterns of income in these areas. Controlling for income would increase and not decrease these differences.
11
McKenzie, T. and Pharoah, C (2011) How generous is the UK? Charitable giving in the context of household spending. Centre for Charitable Giving and Philanthropy.
12
CAF (2012) Mind the gap: The growing generational divide in charitable giving. 13
Next Gen Donors (2013) Respecting legacy, revolutionising philanthropy. 14
63% 53% 52% 37% 31% 25% 23% 18% 13% 9% 7% 6% 2% 2% 8% 1% 17% 39% 16% 12% 14% 10% 8% 6% 3% 4% 2% 4% 1% 1% 5% 7% 0% 20% 40% 60% 80%
Use Prefer to use
Method of giving
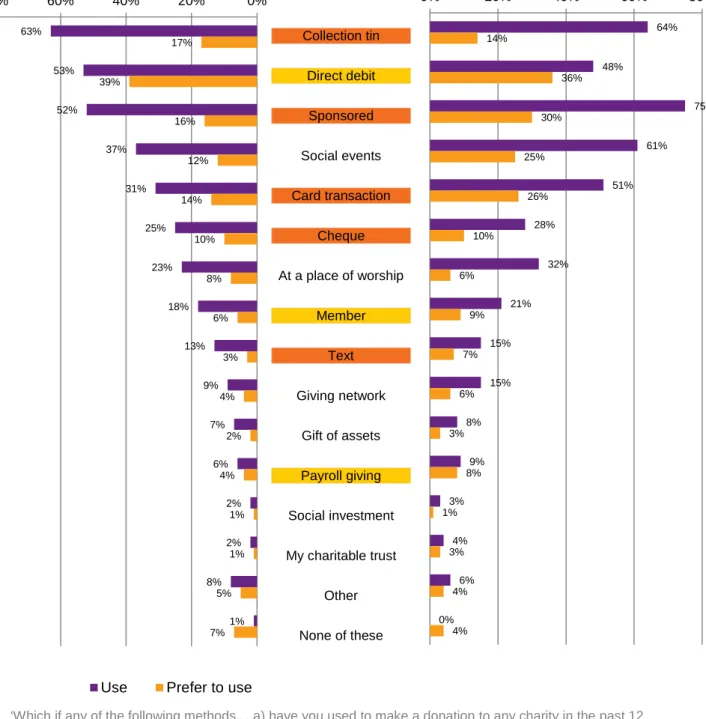
Donors were asked about the methods they use to give. Methods have been grouped to allow for an analysis of committed giving compared with ad hoc giving. Ad hoc methods include putting money in a collection tin, sponsoring someone, giving an occasional donation by credit or debit card, or sending money by cheque or text message. Committed methods include direct debit or standing order, joining a charity as a member, and payroll giving. Respondents were invited to choose up to three preferred methods of giving.
Figure 8: Preferred methods of giving
Mainstream
High-income
‘Which if any of the following methods… a) have you used to make a donation to any charity in the past 12 months (multiple response question); b) do you most prefer to use to make a donation to charity (up to three responses)?’ Mainstream N=1699, high-income N=861. Red shading behind graph legends indicates ad hoc giving methods, yellow indicates committed giving methods.
Collection tin Direct debit Sponsored Social events Card transaction Cheque At a place of worship Member Text Giving network Gift of assets Payroll giving Social investment My charitable trust Other None of these 64% 48% 75% 61% 51% 28% 32% 21% 15% 15% 8% 9% 3% 4% 6% 0% 14% 36% 30% 25% 26% 10% 6% 9% 7% 6% 3% 8% 1% 3% 4% 4% 0% 20% 40% 60% 80%
• Figure 8 shows that the methods most commonly used by both income groups are ad hoc: for mainstream donors, putting money in a collection tin (63%), and for high-income donors, sponsoring someone (75%).
• Both income groups prefer the committed method of direct debit or standing order, chosen by 39% of mainstream donors and 36% of high-income donors.
• High-income donors use a greater variety of methods to give to charity: a mean of 4.4 methods compared to 3.5 for mainstream donors. This is because they give more ad hoc donations alongside their committed giving.
• Social events are more important for high-income donors (37% mainstream, 61% high-income).
• High-income donors favour occasional credit or debit card donations (51% have used it, 26% prefer it) compared to mainstream donors (31% have used it, 14% prefer it).
• High-income donors are more likely to have sponsored someone (75%, mainstream 52%), and are more likely to prefer giving in this way (30%, mainstream 16%).
Analysis of giving methods by age highlights some interesting differences:
• Mainstream donors aged 65+ are more likely to have a direct debit (60%) than the average for the population (53%) or younger donors (49%). They also have a stronger preference for direct debit (44% say it is their preferred method of giving).
• 23% of 18-34 year olds have donated via text, compared to a population average of 13%, and 8% of those aged over 65. Similarly 18-34 year olds are more likely to prefer sponsorship (25% against 16% average). The preference for direct debit indicates that donors are prepared to give in a committed way. This is a positive finding for the sector, and suggests that continued efforts to promote other forms of committed giving, such as payroll giving, may yield results, despite low uptake at present.15
For fundraisers, the demographic differences in methods of donation are interesting. Charities with high-income donors should find ways to tap into their tendency to give in an ad hoc way, and all fundraising charities can explore how to match the giving preferences of their supporters in different age groups.
15
HM Treasury (2013) Consultation on Payroll Giving.
Ad hoc methods of giving are the most commonly used, but the preferred method is direct debit.
Loyalty
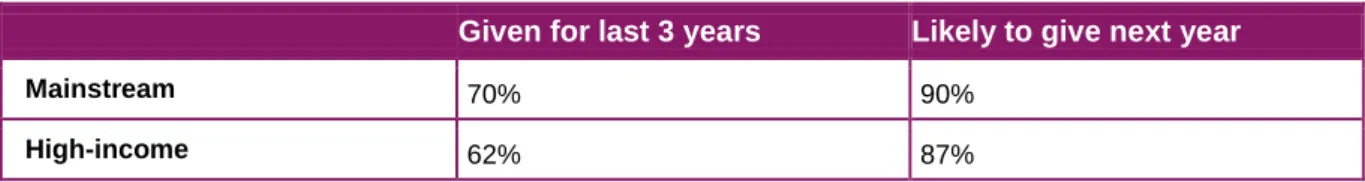
Table 1: Donor loyalty
Given for last 3 years Likely to give next year
Mainstream 70% 90%
High-income 62% 87%
‘Including 2012, in how many of the last three years have you given to this organisation (All three years)?’ ‘How likely, if at all, are you to give to this organisation again in 2013 (very likely and fairly likely)?’ Mainstream N=1699, high-income N=861.
• 70% of mainstream donors and 62% of high-income donors have given for the last three years to the organisation where they made their largest donation.
• 90% of mainstream donors and 87% of high-income donors intend to give to the same organisation next year.
Donors are loyal in their key charity relationships—at least when it comes to their largest donation. Other research has indicated that charities lose up to 50% of donors between their first and second donation, and up to 30% each year after that.16 This research is based on charity records, rather than donor recall, and this different
methodology will affect results. One interpretation may be that charities struggle to convert ad hoc donors into committed donors, but once they succeed in securing a repeat donation it is likely to continue.
This finding may reassure charities. But it also suggests that even high-performing charities may find it difficult to tempt donors away from their existing charity relationships. We should be wary of equating loyalty with
commitment to an organisation, however, as previous research has shown that apparent commitment may simply be inertia.17 This is an interesting area for further research: it may be that those who are loyal out of commitment rather than inertia are more likely to respond to other charities demonstrating the good work they do in a field. In section 4 we look in more detail at opportunities to shift donations to other charities.
16 Sargeant, A. and Jay, E. (2004) Reasons for lapse: The case of face-to-face donors. International Journal of Nonprofit and Voluntary Sector Marketing.
17
Sargeant, A. and Woodliffe, L. (2005) The antecedents of donor commitment to voluntary organizations. Nonprofit Management and Leadership.
54% 57% 17% 23% 15% 13% 14% 7% 0% 10% 20% 30% 40% 50% 60% 70% 80% 90% 100% Mainstream High-income
At least once a week At least once a month At least once a year No
Giving time
Donors were asked whether they had volunteered in the past 12 months, how frequently, what type of activity they did, what causes they gave time to, and how their habits around giving time relate to their financial donations.
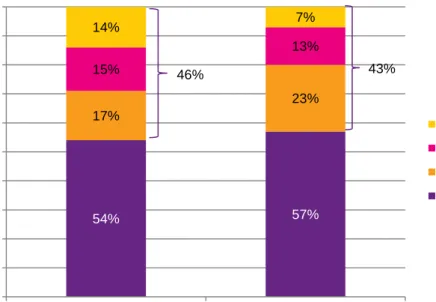
Figure 9: Frequency of volunteering
‘Have you volunteered or donated time to a charitable cause in the past 12 months, or not?’ Mainstream N=1699, high-income N=861
• As figure 9 shows, 46% of mainstream donors and 43% of high-income donors gave time in the last 12 months; in both income brackets more than half of donors did not give time at all.
• Within the mainstream group there was a fairly even split between giving weekly, monthly and annually (14%, 15%, and 17% respectively). High-income donors are more likely to give time on an annual basis (over half of those that give time), and less likely to give time with greater frequency.
Nearly half of all donors also volunteer.
43% 46%
33% 32% 26% 21% 19% 18% 15% 12% 9% 7% 8% 10% 31% 30% 36% 31% 15% 39% 18% 4% 10% 13% 3% 7% 0% 20% 40% 60%
Run an activity or event Given practical help Committee member / trustee
Sponsored events Secretarial / admin Professional skills / expertise Represented / campaigned
Charity shop Befriended / mentored Given advice or information Other help None of the above
Mainstream High-income
Volunteering activity
Figure 10: Types of volunteering
‘Which, if any, of the following types of activity have you done for this cause/ these causes in the past12 months (multiple response)?’ Mainstream N=784, high-income N=372
• Figure 10 demonstrates that around a third of both high-income and mainstream donors have run an activity or event, and a similar proportion has provided practical help.
• The most common volunteering activity for high-income donors is offering professional skills (39%), followed by being a committee member (36%). These are much less common for mainstream donors.
• Taking part in sponsored events is a relatively common activity for both groups—21% of mainstream donors and 31% of high-income donors.
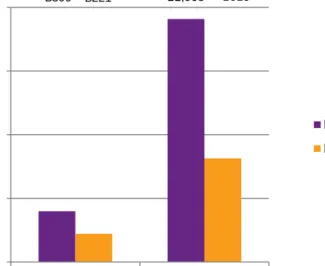
£399 £221 £1,908 £813 £0.00 £500.00 £1,000.00 £1,500.00 £2,000.00 Mainstream High-income Have volunteered Have not volunteered
Giving time and money
Figure 11: Volunteering and average donation
Mainstream volunteers N=784, mainstream non-volunteers N=915, high-income volunteers N=372, high-income non-volunteers N=489. Figures above columns show mean donation for each group.
• Figure 11 demonstrates that mainstream volunteers gave almost twice as much as mainstream non-volunteers in the past year.
• High-income volunteers gave more than twice as much as high-income non-volunteers.
• 71% of mainstream donors giving over £500 volunteered, and 55% did so regularly (at least once a month). By comparison, 39% of those giving £50-£75 volunteered, and 23% did so regularly.
• A similar pattern is seen in the high-income bracket; 54% of those giving over £500 volunteered, 28% did so regularly. For those giving £50-£75, 33% volunteered, 18% regularly.
Across all donors who volunteer, 72% give money to the same organisation that they give time to and 28% do not. For those who donate and volunteer with the same organisation, the survey looked at the sequence for those activities.
Donors who give both time and money to a charity give a higher average donation than those who give only money.
37% 47% 16% 0% 5% 10% 15% 20% 25% 30% 35% 40% 45% 50%
I began giving time and money at the same point
I was already giving money when I started to
give time
I was already giving time when I started to give
money
Figure 12: Sequence for giving time and money (mainstream donors)
‘Thinking about the main charity to which you give time, how does this link to the money you donate to it?’ Mainstream N=567.
• Figure 12 shows that giving money most often precedes giving time, although a substantial proportion of donors begin giving time and money at the same point.
• For 16% of volunteers, giving time leads to financial giving.
• For high-income donors the figures are very similar; 36% of volunteers began giving time and money at the same point, 47% were already giving money when they started to give time, and 17% were already giving time when they started to give money.
The Money for Good UK volunteering rate of 46% among mainstream donors compares with other research, which has found levels from 26% to 71%.18 Differing definitions and methodologies will affect these figures; for example this study looks only at those donating more than £50 per year. However this research echoes previous findings around volunteers’ activities, and the high levels of people giving both time and money to the same organisation. The level of skilled volunteering by high-income donors is heartening; individuals recognise that they can offer more than money to support charities, and charities are making use of their skills. Previous NPC research19 found that half of all charities have a vacancy on their board, so this willingness to share professional skills presents an opportunity for charities to encourage volunteers to become trustees.
The relationship between giving time and money is interesting: there is a correlation between volunteering and higher rates of giving, and between higher levels of volunteering and higher financial donations. Previous
research has found that those donating time and money to the same organisation are more likely to give money to
18 CAF’s Giving World Index found 26% (CAF (2012) World Giving Index 2012: A global view of giving trends), Helping out found 59% (Cabinet Office (2007) Helping out: A national survey of volunteering and charitable giving), and the recent Community Life survey found 71% (Cabinet Office, 2013, Community Life Survey).
19
Vernon, B. and Stringer, E. (2009) Board matters: A review of charity trusteeship in the UK. New Philanthropy Capital.
an organisation where they have been involved as volunteers. It also found that donors tend not to believe that volunteering and donating money can be used to substitute each other.20
It is still unclear whether one leads to the other. Money for Good UK research shows that often donors give money before they give time, indicating that volunteering deepens a relationship rather than creating one. Our research showed that volunteering preceded a donation for 16% of respondents, while 37% of respondents gave both time and money at the same point. Volunteering arguably requires greater effort than a financial donation: if donors choose to give time and money simultaneously, the volunteering relationship could be the motivating factor. Whichever way round they occur, financial giving and volunteering are both positive outcomes for a charity. High-income donors tend to volunteer less frequently, but engage in a greater variety of activities, while
mainstream donors are more likely to regularly volunteer at the same activity. This difference may have implications for the depth of the relationship charities can build with high-income donors. The important link between giving time and giving money indicates that charities might benefit from greater integration between their fundraising and programme functions, ensuring that supporters who both donate and volunteer, or have the potential to, have a rewarding and joined-up relationship with the charity.
Section 4 explores the potential to increase volunteering in more detail.
20
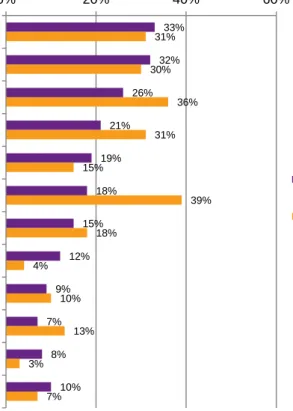
49% 45% 40% 40% 36% 28% 25% 24% 23% 23% 21% 13% 7% 6% 27% 2% 59% 44% 46% 25% 39% 26% 27% 29% 26% 23% 16% 24% 14% 11% 27% 2% 0% 20% 40% 60% Medical research Hospitals and hospices Children or young people Animal welfare Overseas aid, disaster relief Disabled people Environment and heritage Physical and mental health Homelessness and housing Religious organisations Elderly people Education and universities Arts Sports and recreation Other None of these Mainstream High-income
Cause
Giving money
The survey asked donors which causes they had donated money to in the past year and which causes they had given time to.
Figure 13: Causes to which donors give money
‘Which, if any, of the following causes have you donated money to in the past year (multiple response)?’ Mainstream N=1699, high-income N=861
• Figure 13 shows that 40% of mainstream donors give to animal welfare, compared with 25% of high-income.
• The proportion of high-income donors giving to education and universities, arts, and sports and recreation is almost double the proportion of mainstream donors giving to those causes.
Medical research, children or young people, and hospitals or hospices are the three most popular causes for donors to give to.
Giving time
Table 2: Causes to which donors have given time
Mainstream donors High-income donors
Religious organisations 12% Children or young people 13%
Children or young people 9% Schools, colleges, universities/other education 11%
Medical research 7% Medical research 9%
Hospitals and hospices 7% Religious organisations 8%
Schools, colleges, universities/other education 6% Hospitals and hospices 7% ‘Which, if any, of the following causes have you given time to in the past year (multiple response)?’ Mainstream N=1699, high-income N=861
• The top five causes to which mainstream and high-income donors give their time are shown above. These causes are followed by a long tail of low levels of giving time to a wide range of causes.
• Donors are less likely to give time to medical causes, and more likely to give money. They are more likely to volunteer with organisations working with children and young people.
• For mainstream donors in particular, religious causes are an important focus of volunteering.
Our survey showed that high-income donors give to more charities overall; an average of 5.5 charities supported per year compared with the mainstream donor average of 4.8. This is consistent with previous studies, which have looked at the causes donors give their time and money to.21 In section 3 we look in more detail at the cause preferences of donors in different segments.
21
NCVO and CAF (2012) UK Giving 2012: An overview of charitable giving in the UK, 2011/12; Cabinet Office (2007) Helping out: A national survey of volunteering and charitable giving.
Comparing mainstream and high-income donors
Analysis of the findings in this section allows us to draw some interesting comparisons between high-income and mainstream donors. The finding that high-income donors give more on average is unsurprising, but this is the first time information has been gathered from a sufficiently large sample to quantify that difference. There are several interesting distinctions between the mainstream and high-income donor populations: different levels of giving by region, and different preferences for cause and giving methods. Two differences particularly stand out.
First, although giving levels increase with age amongst mainstream donors, amongst high-income donors the younger group give the highest average donation. An interpretation could be that the trend for younger donors giving less may be a function of lower disposable income, rather than a lower level of charitable commitment. Second, when we split the donor population into mainstream and high-income populations, we can see fascinating differences in volunteering behaviour. There is a real preference from high-income donors to give professional skills and act as trustees. This indicates that a substantial proportion of high-income donors want to use their time and skills as well as money to make the maximum impact with their giving.
Table 3: Similarities and differences between mainstream and high-income donors
Similarities Differences
Low obligation to give: only 47% of donors think people should donate.
Mean donation £303 (mainstream) vs £1,282 (high-income).
High donor loyalty: around two thirds of donors have given to the charity that received their largest donation in the last 12 months, for each of the three previous years.
Amongst high-income the 18-34 age group gives the highest average donation, followed by the 55+ age group. Amongst mainstream donors, giving increases with age.
The preferred method of giving is committed: via a direct debit or standing order.
High-income donors are more likely to use ad hoc methods of giving, for instance they like to sponsor, give via social events, and give via occasional credit or debit card donations.
Children or young people, medical research, and hospitals are the three most popular causes.
High-income donors are more likely to give to education, arts and sports causes, and less likely to give to animal causes.
Around 45% of donors give time.
High-income donors are more likely to give their time on an annual basis rather than weekly or monthly, and to give professional skills or sit on a committee.
Volunteers donate more: comparing non-volunteer to volunteer mean donation: £813 vs £1,908 for high-income donors, £221 vs £399 for mainstream donors.
In the following section we continue to explore donor behaviour and the differences between mainstream and high-income donors, focusing on what influences giving and the steps donors take before donating.
Implications
1. There is a low sense of duty to give among the donor population. This implies that fundraising based on duty will not resonate with a large proportion of the UK population. 2. The high average donation among younger high-income donors suggest that lower-level
giving among young people could be due to lower disposable income, and not a lack of charitable conviction.
3. A clear preference for direct debit implies that donors are open to giving by committed means. There may be opportunities to encourage more donors to give in a committed way, and to use methods other than direct debit, such as payroll giving.
4. High-income donors give in an ad hoc way alongside their committed giving; charities should look to take advantage of this opportunity.
5. A high level of loyalty in donors’ most significant charity relationship is good news for charities, but may mean that other charities find it difficult to persuade donors with existing relationships to switch.
6. The link between giving time and giving money suggests that charities may benefit by developing stronger links between fundraising and volunteering programmes.
2. INFLUENCES ON GIVING: INFORMATION AND
RESEARCH
Information provided by charities can influence donors’ decisions about giving. In this section we provide a new perspective on whether donors research charities before donating, what they look at, and to what extent they consider impact. The findings can help charities think about what and how to communicate with donors. In this section we answer the questions:
• What information sources do donors use?
• What factors do donors pay attention to when deciding to donate?
• Do donors research, and what type of research do they do?
Key findings
• Donors respond to personalised communications from charities that they have a relationship with, and asks or prompts from family, friends or colleagues.
• Donors care about impact—two thirds pay attention to impact when giving to a charity, but only a small proportion use this information to choose between charities.
• 38% of donors do research before making their largest donation. Most use it to help them to decide whether to donate, but almost a fifth (18%) of those who do research are looking for information to help them decide between multiple charities (7% of all donors).
31% 27% 23% 19% 17% 17% 15% 13% 12% 9% 8% 7% 5% 2% 5% 17% 34% 47% 37% 32% 23% 16% 14% 13% 14% 13% 5% 9% 6% 4% 3% 9% 0% 10% 20% 30% 40% 50%
Communication based on existing relationship with charity Sponsor friend/family/colleague Friend/family/colleague Event/fundraiser News/TV coverage Organisation's website Talking to representative Communication not based on existing relationship w. charity Advertising by the charity Visit to the organisation Local information source Other online source Social media campaign Documentation (eg, annual report) Other None of these
Mainstream High-income
Information sources leading to a donation
Donors were asked which information sources directly led to them making a donation to charity in the past 12 months.
Figure 14: Information sources leading to a donation
‘Which, if any, of the following information sources have directly led to you making a donation to charity in the past 12 months (multiple response)?’ Mainstream N=1699, high-income N=861
Donors respond to personalised communications from charities that they have a relationship with, and to asks or prompts from family, friends or colleagues.
• Figure 14 indicates that approximately a third of donors donate in response to information that they receive through an existing charity relationship.
• Personal ties are also important, especially for high-income donors. In contrast to mainstream donors, for high-income donors ‘being asked to sponsor a friend/family/colleague’ (47%) and receiving information ‘through a friend/family/colleague’ (37%) are the most common information sources leading to a donation.
• Younger mainstream donors aged 18–34 are more likely to respond to online prompts, such as an
organisation’s website (23% against an average of 17%), social media campaigns (11% against an average of 5%), and other online sources (12% against an average of 7%).
• Younger high-income donors are particularly influenced to give as a result of visiting an organisation: 23% against a mean of 13%.
• Older mainstream donors (aged 65+) are more likely to respond to information not based on an existing charity relationship (such as unsolicited approaches) than average: 18% have done so, against an average of 13%. Older high-income donors do not share this willingness to respond to unsolicited approaches; 14% have responded to such prompts against an average of 13%.
• In both income groups, middle-aged and particularly older donors responded strongly to information based on an existing relationship with the charity. For high-income donors, 43% of those aged over 55 responded to this prompt (average 34%), and for mainstream donors 40% of those aged between 55 and 64, and the same proportion of those aged over 65 responded (average 31%).
It is striking how important relationships are as a prompt to giving. The three prompts that most strongly influence donations arise from relationships: an existing relationship with a charity, or the influence of family, friends and colleagues. Interestingly, the most important prompt—personalised communication from a charity based on an existing relationship—is also the one that charities worry can have a negative impact on a relationship if used too often. The Consumer Attitudes Report22 found that more than 50% of donors would stop giving if a charity contacted them too often. This is clearly a balance that charities need to strike.
Whilst an organisation’s website is a relatively important prompt, leading 17% of mainstream donors to make a donation, other online and social media sources rate very low (influencing only 7% and 5% of donors
respectively). However the openness of the younger age group to respond to online and social media prompts may mean that, in terms of building a donor base for the future, they are an important investment.
The exaggerated importance of family, friends and colleagues to the high-income population shows how these donors are more open to such appeals, and tallies with the high incidence of giving through sponsorship and social events, identified in section 1.
22
0% 20% 40% 60% 80% 100% How the organisation will use my donation
Evidence the organisation is having an impact How easy it is for me to donate Quality of the organisation's leadership Regular progress reports on organisation's work How often organisation asks me for money Ability to get involved with the organisation Whether it takes novel/innovative approach Thanks/appreciation I receive for my donation
Extremely close attention Close attention Some attention
Factors donors pay attention to
Donors were asked how much attention they paid to a range of factors when giving to charity. These factors were designed to reflect a range of different concerns, including interest in the effectiveness of the charity, interest in communications, and interest in operations.
Figure 15: Factors influencing donation (mainstream)
‘How much attention, if any, do you pay to the following factors when giving to charity?’ Mainstream N=1699
Donors care about impact—three in five pay close attention to what their donation will achieve.
• Figure 15 shows that 63% of donors pay close or extremely close attention to how their donation will be used. Figures for high-income donors closely mirror those of mainstream donors.
• Evidence that an organisation is having an impact is also very important, with 58% of mainstream and 61% of high-income donors paying close or extremely close attention to this.
• Donors pay least attention to the thanks and appreciation received for their donation: only 15% of mainstream donors and 10% of high-income donors said they paid close attention to this.
• 30% of mainstream donors pay attention to how often the organisation asks them for money, but this ranks low (sixth) in importance overall.
These findings show that donors care about how donations are used and what the charity achieves. ‘How the organisation will use my donation’ is the top response, and ‘Evidence the organisation is having an impact’ is second. Other high-ranking responses also show an interest in the workings of the charity and its progress: ‘Quality of the organisation’s leadership’ ranks fourth most important, and ‘Regular progress reports’ is fifth. In contrast, factors relating to the practicalities of donation or benefits to donors ranked lower, including ‘Thanks and appreciation I receive for my donation’, ‘Ability to get involved’, and ‘How often the organisation asks me for money’. One practical concern, ‘How easy it is for me to donate’ rated high among factors donors pay attention to (ranked third: 43% mainstream and 40% high-income pay close attention).
It is interesting to reflect on the practice of charities making personalised contact with donors based on an existing or previous relationship. The previous section showed this to be an effective way to raise funds, but one with associated risks of annoying or losing donors. These results show that, compared with other factors, donors pay