6804
Published by: IEEE
URL: http://dx.doi.org/10.1109/MCOM.2017.1700180
<http://dx.doi.org/10.1109/MCOM.2017.1700180>
This version was downloaded from Northumbria Research Link: http://nrl.northumbria.ac.uk/35286/
Northumbria University has developed Northumbria Research Link (NRL) to enable users to access the University’s research output. Copyright © and moral rights for items on NRL are
retained by the individual author(s) and/or other copyright owners. Single copies of full items can be reproduced, displayed or performed, and given to third parties in any format or medium for personal research or study, educational, or not-for-profit purposes without prior permission or charge, provided the authors, title and full bibliographic details are given, as well as a hyperlink and/or URL to the original metadata page. The content must not be changed in any way. Full items must not be sold commercially in any format or medium without formal permission of the copyright holder. The full policy is available online:
http://nrl.northumbria.ac.uk/policies.html
This document may differ from the final, published version of the research and has been made available online in accordance with publisher policies. To read and/or cite from the published version of the research, please visit the publisher’s website (a subscription may be required.)
Defense Mechanisms against Data Injection
Attacks in Smart Grid Networks
Jing Jiang,
Member, IEEE,
and Yi Qian,
Senior Member, IEEE.
Abstract
In smart grid, bi-directional information exchange among customers, operators and control devices significantly improves the efficiency of energy supplying and consuming. However, integration of intelligence and cyber systems into a power grid can lead to serious cyber security challenges and makes the overall system more vulnerable to cyber attacks. To address this challenging issue, this article presents defense mechanisms to either protect the system from attackers in advance or detect the existence of data injection attacks to improve the smart grid security. Focusing on signal processing techniques, this article introduces an adaptive scheme on detection of injected bad data at the control center. This scheme takes the power measurements of two sequential data collection slots into account, and detects data injection attacks by monitoring the measurement variations and state changes between the two time slots. The proposed scheme has the capability of adaptively detecting attacks including both non-stealthy attacks and stealthy attacks. Stealthy attacks are proved impossible to be detected using conventional residual-based methods, and can cause more dangerous effects to power systems than non-stealthy attacks. It is demonstrated that the proposed scheme can also be used for attack classification to help system operators prioritize their actions to better protect their systems, and is therefore very valuable in practical smart grid systems.
Index Terms
Smart grid networks, bad data injection, stealthy data injection, state estimation, cyber-physical security.
Dr. J. Jiang is with the School of Engineering and Computing Sciences, Durham University, Durham, DH1 3LE, UK. (Email: [email protected])
Prof. Y. Qian is with the Department of Electrical and Computer Engineering, University of Nebraska-Lincoln, Peter Kiewit Institute, Omaha, NE 68182-0572, US. (E-mail: [email protected])
I. INTRODUCTION
Smart grid is a modernized power grid that uses information and communications technol-ogy to gather and act on information for improving the efficiency, robustness, economics, and sustainability of the energy distribution and management [1]. The bi-directional information exchange among customers, operators and control devices offers a more efficient way of energy supplying and consuming: On the operator side, equipment can be intelligently managed and energy supplying flexibility can be significantly improved. On the consumer side, both the user experience and billing system can be enhanced [2]. The data generated in a smart grid is much more than that generated in a traditional power grid due to this continuous bi-directional information exchange [3], [4]. The Internet of Things (IoT) enables the transfer of such high volume data, and makes the grid infrastructure, meters, substations, and buildings virtually interconnected through the Internet or peer-to-peer connections [5]. IoT can be a valuable solution to support the development of smart grid.
However, by integrating a physical system (power grid) with a cyber system (IoT), a smart grid presents significant cyber security challenges and makes the overall system more vulnerable to cyber-attacks. For instance, in December 2015, a cyber attack of a power system was reported in Ukraine, which caused a power cut lasting several hours and affecting 80,000 customers. During the attack, 103 cities were completely blacked out and the affected control centers were not fully operational even after two months later. In addition, according to data provided by the United States Computer Emergency Readiness Team, there were 79 cyber hacking incidents targeted at the energy sector in the year 2014 [6]. Such attacks could maliciously manipulate the electricity price in the power market, or even cause a regional blackout (taking Ukraine as an example), and result in serious social and economic consequences. Thus, IoT-enabled smart grids must incorporate appropriate cyber protection mechanisms for detecting and identifying such malicious data attacks to improve the smart grid security.
To maintain normal operations of the smart grid, the power systems are continuously monitored and controlled by Supervisory Control and Data Acquisition (SCADA) systems and Energy Management Systems (EMS) [7]. In particular, the SCADA host receives real-time measurements (typically transmission line power flows and bus line power flows) from remote meters or sensors. These measurements are then processed at the state estimator for estimating the system states and building real-time electricity network models [8]. These state estimates are crucial, and must
be passed to enable EMS application functions, such as automatic generation control and optimal power flow, to control the physical aspects of power grids. We consider a smart grid comprising the power system, communication network, and control center. An attacker may launch attacks by hacking a few meters or sensors to distort the measurements. Moreover, the communication links are also vulnerable to data injection attacks where measurements may be altered during data transmission [9]. Bad data injection attacks can result in the state estimator producing incorrect system state estimates, leading to poor control decisions or a major malfunction or even blackout. Other, non-malicious, events can also result in a bad data injection. For example, an accident such as a tree falling on a transmission line will cause a sudden and large change in some measurements. Such an event is referred to as an accident, which is also a type of data injection. It is desirable to protect power systems from data injection attacks in advance or detect bad data during the state estimation process at the control center.
In this article, we focus on data injection attacks and defense mechanisms in smart grid networks. Some preliminary works that include the problem formulation of state estimation and types of attacks are studied. Depending on whether the power grid topology information is known or not by attackers, data injection attacks are divided into two types, stealthy attacks and non-stealthy attacks, respectively. We then investigate defense mechanisms to protect power systems from these attacks. Traditionally, stealthy attacks are impossible to be detected using conventional residual-based methods. We thus introduce a novel scheme to adaptively detect and classify data injection attacks including both non-stealthy attacks and stealthy attacks. This scheme takes the measurements of two sequential data collection slots into account, and detects data injection attacks by monitoring the measurement variations and state changes between the two time slots. Using this scheme, once the attack type is identified, system operators can prioritize their actions or resources to better protect their systems and reduce the risk of attackers launching future stealthy attacks.
The rest of this article is organized as follows: We first present the system architecture and introduce state estimation and data attacks in smart grid. Two categories of defense mechanisms are then discussed. After that, we propose an adaptive scheme on detection of data injection attacks, and demonstrate the benefits of this scheme compared with conventional methods. Finally this article is concluded.
II. STATE ESTIMATION AND DATA INJECTION ATTACKS
In this section, we illustrate the system architecture and introduce the problem formulation of state estimation. Two types of data injection attacks, non-stealthy attacks and stealthy attacks, are then defined.
A. System Architecture
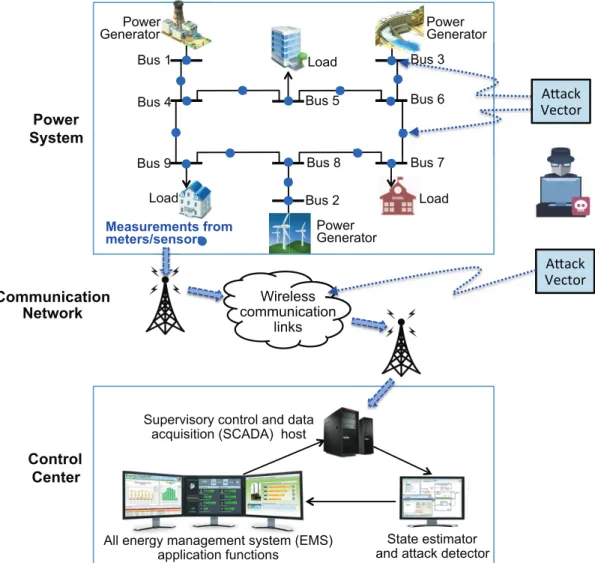
Fig. 1 shows a block architecture diagram of a power system, communication network, and control center of a smart grid. In order to clearly demonstrate the power system, a small-scale IEEE 9-bus system is employed which consists of three different types of power generators and three various loads. The power system is monitored by a control system, which comprises a SCADA host and a remote sensing system providing power measurement data to the SCADA host via a communication network. The remote sensing system comprises a plurality of remote sensors or meters. As shown in Fig. 1, the remote sensors come in two varieties: transmission line flow sensors, which measure the power flow through a single transmission line, and bus injection sensors, which measure the power injection flow from all transmission lines connected to a single bus. At one data collection slot, the measurements from these sensors will be transmitted through a communication network. Wireless communication network is considered in Fig. 1, as it can offer wide spread access, great flexibility, and quick deployment. WiMAX or cellular network communications (e.g., 3G or 4G) can provide the wireless communication solutions [2]. In the control center, the real-time power measurements received by the SCADA host are then processed at the state estimator to estimate the system states and build real-time electricity network models. As shown in Fig. 1, an attacker may launch a data injection attack by hacking a few sensors to distort the measurements, or alter measurements during their transmission in the communication links.
B. State Estimation
At the control center, operators need to know the voltage phase angles of all buses to make control and operation decisions. However, it is difficult for sensors to directly measure phase angles [10]. The control center thus uses state estimation technique to estimate the system states (typically voltage phase angles) through processing the set of real-time power measurements received from sensors.
In power systems, the transmitted power from one bus to another bus depends on the voltage amplitudes and voltage phase differences between the two buses, and also relates to the reactance of the transmission line between these buses. In power flow analysis, it is usually considered that the voltage phase differences are relatively small and the voltage amplitudes are normalized to unit [8], such that a linear relation exists between the power measurement and the voltage phase difference. We thus apply a linearized power flow model, which is widely used for real-time analysis of state estimation in the power systems [11].
Using the linearized power flow model, the received power measurements at the SCADA host can be represented in a vector-matrix from as z = Hx+u, where z denotes the measurement
vector, which includes power flow measurements on transmission lines and power injection measurements at buses. The system state vector is represented by x, and the vector urepresents
the Gaussian noise with a zero mean and a covariance matrixU. The matrixHis the measurement matrix, which is assumed to be fully known to the system operators; Attackers may or may not know this measurement matrix [11]. In the power system, the network connectivity can be described by an oriented incidence matrix M; each column of M corresponds to one power
transmission line, and the number of rows represents the number of buses. The physical properties of the transmission lines can be described by a nonsingular diagonal matrixN, of which diagonal
entries equal to admittances of the transmission lines. The matrix H can be constructed by
H= [NMT,MNMT]T [9]. That is, power flow measurements on transmission lines are obtained
from MNMTx and power injection measurements at buses can be computed from NMTx.
State estimation is to use the received measurements z to timely estimate the power
sys-tem states x. The vector x can be computed using the weighted least-square method: ˆx = (HTUH)−1HTUz.
C. Non-stealthy Attacks and Stealthy Attacks
If a bad data injection attack occurs, the received power measurement vector will include a bad data vector maliciously injected by the attacker. That is,z=Hx+a+u, whereadenotes the bad data vector. Conventional methods to detect bad data injection are mostly based on residual tests. The residual refers to the difference between the measurement vector z and the calculated
value from the estimated state, i.e., z−Hˆx. The largest normalized residual test can be used to detect bad data injection to see if the largest absolute value of the elements in normalized residual is greater than a pre-defined threshold. If the largest normalized residual is larger than
the threshold, the corresponding measurement will be considered as bad data and reported to system operators.
Depending on whether the bad data attacks detectable or not by conventional residual tests, we define the following two types of attacks:
1) Non-stealthy Data Injection Attacks: They are defined as the attacks detectable by con-ventional residual-test methods [8]. In this case, the measurement matrix H is not known to
the attackers. The attackers simply generate random attack vectors and manipulate the meter readings.
2) Stealthy Data Injection Attacks: They are defined as the attacks not detectable by conven-tional bad data detection methods. In this case, attackers are assumed to be familiar with the power grid topology information or know the measurement matrix. They can carefully design the malicious data and leta=Hc, wherec∈Rncan be any arbitrary vector [12]. The measurement vector can then be written asz=H(x+c)+u. Such attacks can bypass the conventional residual-test detection methods, and the control center would believe that the true state is (x+c).
III. DEFENSE MECHANISMS
Since bad data injection attacks can result in poor control decisions or a major malfunction or even blackout, it is crucially important to have appropriate defense mechanisms, to either protect the system from attackers in advance or identify the existence of bad data injection attacks during the state estimation process [9]. Defense mechanisms can be divided into two categories: One is to deploy advanced measurement units, such as phasor measurement units (PMUs), at various locations to protect the system from attackers in advance; The other is to adopt advanced signal processing techniques at the control center to identify bad data injection attacks.
A. Deployment of Advanced Measurement Units
The mechanisms of deploying advanced measurement units, such as PMUs, are introduced in [13]–[15]. PMUs measure voltages and currents on a power grid using a common time source based on global positioning system (GPS) time, and thus have the capability of providing accurately time-stamped measurements for geographically dispersed nodes. Consequently, PMUs are typically robust against data injection attacks and have the measurements secured. In practice, PMUs are very expensive; it is not feasible to deploy enough PMUs to secure all measurements in a grid network. It is demonstrated in [14] that it is possible to defend against malicious data
injection by either protecting a subset of existing measurements, or placing additional secure PMUs on a fraction of buses. The challenge, however, is that selecting such subsets is a high-complexity problem and recent studies have proposed several methods on how to address this issue: For instance, [14] proposes a fast greedy algorithm to select a subset of measurements to be protected; [13] uses graphical characterization to study defending mechanisms with minimum number of secure measurements; and [15] provides a semidefinite programming optimal PMU layout approach considering the impact of restricted channel limits. Due to the high cost, the approach of deploying advanced measurement units to defense data injections will be more suitable to power systems that have great social and economic impacts; but for a general power system it will be restricted by limited budget.
B. Adoption of Signal Processing Techniques
The mechanisms investigating advanced signal processing techniques are to detect the injected bad data at the control center and abandon these data from measurements. The attack detector (as shown in Fig. 1) needs to reliably detect an data injection attack in an event of an attack. Either there is an attack event occurred or there is not. Either the detector identifies an attack or does not. There are four possible outcomes: hit (attack presents and the detector identifies), miss (attack presents and the detector fails to identify), false alarm (attack absents and the detector wrongly identifies), and correct rejection (attack absents and the detector identifies no attack). We define probability of detection to indicate the first case, and probability of false alarm to indicate the probability of the third case. The two probabilities can be used as indicators to compare the performance of different detection methods.
As we mentioned in Section II-C, conventional methods to detect bad data are mostly based on residual tests. When stealthy data injection attack happens, the residual would not change compared to the no-attack case, and the system would not report any abnormal state. Besides conventional methods, some other advanced signal processing techniques are considered to improve the detection accuracy: In [12], machine-learning (ML) technique is proposed for detecting stealthy attacks. This ML technique relies on a set of historical data that is used for learning and validating data to detect the attacks in new measurements, and the learning efficiency needs to be improved. A cumulative-sum-based (CS) approach is proposed in [8] aiming to minimize the detection time subject to certain detection error constraints; but this CS approach focuses on non-stealthy attacks. Exploiting the low rank structure of temporal
erroneous-free measurements and sparsity of malicious attacks, defense mechanisms are proposed in [10] and [9], where methods of constructing sparse stealthy attacks are also studied in [9]; these mechanisms have a strong assumption that the attack matrix must be spare, which is not robust against attackers with strong capability of launching cyber attacks. One novel mechanism to adaptively detect and classify data injection attacks (including non-stealthy attacks and stealthy attacks) will be presented next.
IV. AN ADAPTIVE SCHEME ON DETECTION OF DATA INJECTIONS
In this section, an adaptive scheme on detection of data injections is presented. It takes the measurements of two sequential data collection slots into account, and the equation of received measurements can be written as state-space equations with discrete time indexi, aszi =Hxi+ui andxi =xi−1+ ∆xi, where∆xi is the state change vector representing the system state changes from the last data collection slot i−1 to the current data collection slot i. Current smart meters support 15-minute-interval data collection frequency, and the frequency is likely to improve further for achieving advanced smart grid functionalities. Compared with the values of system state, the values of system state changes are relatively small, that is, the system state generally varies in a small dynamic range. The state change vector ∆xi follows a certain distribution and is here initialized to be normal distribution with zero mean. In addition, as the measurement matrixHis related to the power network connectivity and physical properties of the transmission lines, H generally remains unchanged for the two small sequential data collection slots. Any
updates of the measurement matrix will be reported to the control center and the updated one will be used for state estimation and attack detection.
We monitor measurement change residual and state change between two data collection slots to detect and classify non-stealthy and stealthy data injection attacks. Let wi present the measurement change vector, which is the difference between the current power flow measurement vector and the calculated value of the last estimated state, i.e.,wi =zi−Hˆxi−1. We can compute
the last estimated state using the weighted least-square method shown in Section II-B, and obtain wi = H∆xi + (ui −ui−1). As ui and ui−1 are independent Gaussian noise vectors at
the two sequential data collection slots, (ui −ui−1) is also Gaussian distributed with a zero
mean and a covariance matrix 2U. The state change vector can then be estimated from the
measurement change vector wi, by using the weighted least-square method. Furthermore, we
norm to detect the presence of non-stealthy data injection attack. That is, if the Euclidean norm ofri is greater than a pre-defined thresholdτ1, the presence of non-stealthy data injection will be
inferred and reported to system operators. Note that the Euclidean norm is also calledℓ2
distance or ℓ2
norm. Besides Euclidean norm test, other test method on the residual (e.g., the largest normalized residual test) can also be used to detect the presence of non-stealthy data injection. The selection of the threshold τ1 is based on history and trade-off between the probability of
detection and probability of false alarm. In addition, if no data injection is inferred, i.e., the Euclidean norm of ri is equal to or less than τ1, we use the Euclidean norm of state change
∆ˆxi to detect the presence of stealthy data injection attack. If the Euclidean norm of ∆ˆxi is greater than a pre-defined threshold τ2, the presence of stealthy data injection will be inferred
and reported to system operators.
When attackers launch stealthy data injection, we have the state change vector as ∆xi+ci, compared to ∆xi for the non-attack case. Due to the facts that the vector ∆xi+ci does not exhibit the same distribution feature as the vector ∆xi, using detection algorithms, the existence
ofci can be detected at a certain successful probability. The detection probability of the proposed scheme will be higher if the elements of ci are larger. A stealthy attack with larger ci can cause greater system state change, and thus is more dangerous to the power system operations.
Referring to Algorithm 1, the steps of the proposed scheme are as follows: We initialize time index i = 0, collect historical estimated state vector ˆx0. Then the procedure of detection for
bad data attacks or electrical accidents is carried out: The time index is updated as i =i+ 1, and the current measurement vector zi sent by remote sensors is obtained. We calculate the measurement change vector wi, which is the difference between the vector zi and Hˆxi−1. The
state change vector ∆ˆxi is estimated from wi, by using the weighted least-square method. We then calculate the measurement change residual vector ri, which is the difference between the vector wi and H∆ˆxi. As shown in Step II-6 of Algorithm 1, data attacks are then identified based on the estimated state change vector ∆ˆxi and the measurement change residual vector ri by using the Euclidean norm method. Here the largest normalized method (which compares the largest absolute value of elements in a vector with a threshold) can also be used. Data attacks will be classified into non-stealthy attack, stealthy attack, or no attack. If no attack is identified, the process of state estimation will continue. If non-stealthy or stealthy attack is determined, the process of attack detection will be terminated and the detected data injection attack will be reported to system operators. In Step IV, for distinguishing between data injection attacks and
electrical accidents, system operators can either send staff to verify or wait for receiving reports from secure devices, such as from PMUs or intelligent electronic devices.
The proposed scheme differs from existing relevant methods in three aspects: First, different from related works that only process measurements collected at one single time slot, this scheme takes the measurements of two sequential data collection slots into account, and detects injection attacks by monitoring the measurement variations and state changes between the two slots. Next, the proposed scheme can self-adaptively detect both non-stealthy and stealthy injection attacks; the latter one was proved impossible to detect using conventional methods. Furthermore, the proposed scheme can identify the type of data attacks. Since stealthy attacks are more dangerous to power system operations than the non-stealthy ones, it is crucial for operators to know the attack type and then prioritize their actions or resources to better protect their systems and reduce the chance of future stealthy attacks.
V. PERFORMANCE EVALUATIONS
In this section, we evaluate the performance of conventional detection method and the proposed scheme for detecting both non-stealthy and stealthy attacks based on IEEE test systems. The MATLAB package MATPOWER is used to simulate the operation of the power system. The signal-to-noise ratio (SNR) considered in the simulations indicates the power level of true measurements to the power level of noise. For bad data injection attacks, both non-stealthy and stealthy attacks of various attack severity levels are considered. The attack-to-noise ratio (ANR) is used to indicate the attack severity level, defined as the ratio of attack power level to the noise power level. We use receiver operating characteristic (ROC) curves to illustrate the performance of a detector as the discrimination threshold is varied. The curve is generated by plotting the probability of detection against the probability of false alarm at various threshold settings. The probability of detection indicates the probability of saying that an ‘attack’ is present given that an ‘attack’ event actually occurred. The probability of false alarm is the probability of saying that an ‘attack’ is present given that a ‘no attack’ event actually occurred.
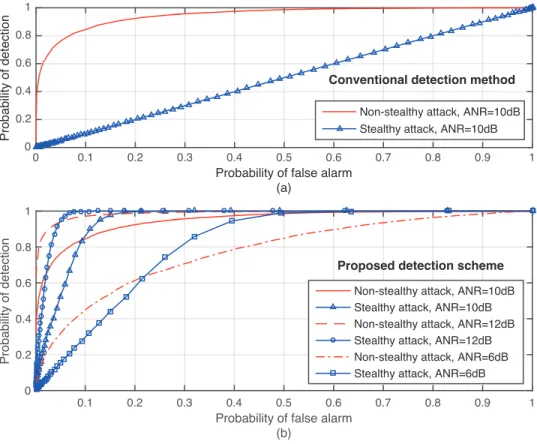
Referring again to the IEEE 9-bus test system and power system shown in Fig. 1, there are 9 transmission lines and thus 18 measurement elements in total for one data collection slot. Fig. 2 (a) shows the ROC curves of conventional residual-test method, where SNR = 20 dB and ANR = 10 dB for both non-stealthy and stealthy attacks are considered. For non-stealthy data attacks, the attacker controls two sensors to inject bad data. From the figure, it can be seen that the
conventional method can detect non-stealthy attacks at a successful radio of around 85% given a 10% probability of false alarm. However, for stealthy attack, a completely random guess line (the same as coin tossing, i.e. the diagonal line from the left bottom to the top right corner) is obtained, which means the conventional residual-test method cannot detect stealthy attacks but just always makes a random guessing decision.
For comparison, based on the same IEEE 9-bus test system, detection performance of the proposed scheme to adaptively detect both non-stealthy and stealthy attacks is demonstrated in Fig. 2 (b), where a same value of SNR = 20 dB as used in Fig. 2 and various values of ANR are considered. When ANR = 10 dB, compared to the conventional method, the proposed scheme can achieve the same detection probability for detecting non-stealthy attacks, and can significantly improve the detection probability for detecting stealthy attacks; For example, given a
10%probability of false alarm, the proposed scheme can successfully detect non-stealthy attacks at a radio of around 86%. Different attack levels, i.e., ANR equals 12 dB and 6 dB, are also considered in Fig. 2 (b). With a higher attack level, regardless non-stealthy or stealthy attack, better detection performance can be achieved using the proposed scheme. It can be anticipated that the proposed scheme is valuable in practical power systems to detect higher level of attack, since higher level of attack can always cause larger system state change and is thus more dangerous to the power system operations.
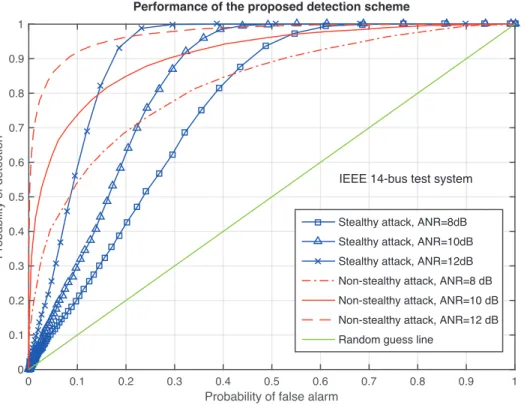
In an IEEE 14-bus test system, there are 20 transmission lines, and thus 34 measurement elements. Fig. 3 shows detection performance of the proposed scheme for IEEE 14-bus test system, where SNR = 20 dB and various values of ANR are considered. For non-stealthy data attacks, we still assume that two sensors are attacked to inject bad data. The proposed scheme can classify and self-adaptively detect both the non-stealthy and stealthy data injection attacks. A random guess line is also shown to present the ROC curve achieved using the conventional method when detecting stealthy attacks. The ROC curves obtained using the proposed scheme are all above the diagonal line, which means that the scheme can achieve very good results for classifying and detecting attacks (significantly better than random guessing). For the stealthy data injection attacks (which are hard to be detected using conventional methods), three different levels of ANR are considered. As the attack power level increased, detection performance of the proposed scheme improved significantly. The proposed scheme also shows very good performance on detecting non-stealthy attacks.
Using the same setting of SNR = 20 dB as used for IEEE 9-bus and 14-bus systems, detection performance of the proposed scheme for the IEEE 57-bus system is presented in Fig. 4 against various values of ANR. The performance of conventional method for detecting stealthy data attacks is also shown for comparison. Two specific probabilities of false alarm, i.e., 30%and 40%
are considered. For a given probability of false alarm, at a fixed ANR level, the discrimination threshold τ1 used for testing non-stealthy data attacks and τ2 used for testing stealthy data
attacks can be computed. Using these thresholdsτ1 andτ2, the proposed scheme can classify and
detect both the non-stealthy and stealthy attacks. When ANR = 12 dB, to achieve a probability of detection higher than 85% for detecting stealthy attacks, we must tolerate a false-alarm probability of up to 40%. A larger value of ANR leads to a much higher detection probability. As demonstrated in IEEE 9-bus, 14-bus and 57-bus test systems, it can be anticipated that the proposed scheme is able to achieve the important objectives of smart grid security in terms of data attack identification and accurate detection.
VI. CONCLUSIONS
In this article, we have discussed bad data injection attacks and defense mechanisms in smart grid networks. The problem formulation of state estimation and two types of data injection attacks have been studied. Then, focusing on defense mechanisms, it has been demonstrated that stealthy data attacks are impossible to be detected using conventional methods. We have presented a detection scheme which can self-adaptively detect both non-stealthy and stealthy attacks. The scheme comprises: determining two estimates of the state of the monitored system using the state measurement data provided by the remote sensing system at two sequential data collection slots, and determining bad data injection attacks by monitoring the measurement variations and state changes between the two slots. Analytical and simulation results have shown that the proposed scheme is efficient in terms of data attack classification and detection accuracy. Once the attack type is known, the power system operators can prioritize their actions or resources to better protect their systems: If the attacks are non-stealthy, the corresponding injected measurements can be removed for another round of state estimation. If the attacks are stealthy, besides removing the measurements, system operators need to change the power network topology, since the measurement matrix has been known to the attacker. Effective action strategies to reduce the risk of being continuous attacked will be left for future work.
ACKNOWLEDGMENT
This work was supported by the European Commissions Horizon 2020 Framework Programme (H2020/2014-2020) under Grant Agreement 646470, SmarterEMC2 Project. This work was also supported by the National Science Foundation under the grant CNS-1423408.
REFERENCES
[1] H. Sun, N. Hatziargyriou, H. Poor, L. Carpanini, and M. Forni´e,Smarter Energy: From Smart Metering to the Smart Grid, ser. Energy Engineering. Institution of Engineering and Technology, 2016.
[2] J. Jiang and Y. Qian, “Distributed communication architecture for smart grid applications,” IEEE Communications Magazine, vol. 54, no. 12, pp. 60–67, December 2016.
[3] H. Sun, A. Nallanathan, B. Tan, J. S. Thompson, J. Jiang, and H. V. Poor, “Relaying technologies for smart grid communications,”IEEE Wireless Communications, vol. 19, no. 6, pp. 52–59, December 2012.
[4] Y. Yan, Y. Qian, H. Sharif, and D. Tipper, “A survey on smart grid communication infrastructures: Motivations, requirements and challenges,”IEEE Communications Surveys Tutorials, vol. 15, no. 1, pp. 5–20, First Quarter 2013.
[5] S. E. Collier, “The emerging Enernet: Convergence of the smart grid with the internet of things,”IEEE Industry Applications Magazine, vol. 23, no. 2, pp. 12–16, March 2017.
[6] D. B. Rawat and C. Bajracharya, “Detection of false data injection attacks in smart grid communication systems,”IEEE Signal Processing Letters, vol. 22, no. 10, pp. 1652–1656, Oct 2015.
[7] Y. Yan, Y. Qian, H. Sharif, and D. Tipper, “A survey on cyber security for smart grid communications,” IEEE Communications Surveys Tutorials, vol. 14, no. 4, pp. 998–1010, Fourth 2012.
[8] Y. Huang, J. Tang, Y. Cheng, H. Li, K. A. Campbell, and Z. Han, “Real-time detection of false data injection in smart grid networks: An adaptive CUSUM method and analysis,”IEEE Systems Journal, vol. 10, no. 2, pp. 532–543, June 2016. [9] J. Hao, R. J. Piechocki, D. Kaleshi, W. H. Chin, and Z. Fan, “Sparse malicious false data injection attacks and defense
mechanisms in smart grids,”IEEE Transactions on Industrial Informatics, vol. 11, no. 5, pp. 1–12, Oct 2015.
[10] L. Liu, M. Esmalifalak, and Z. Han, “Detection of false data injection in power grid exploiting low rank and sparsity,” in
2013 IEEE International Conference on Communications (ICC), June 2013, pp. 4461–4465.
[11] S. Cui, Z. Han, S. Kar, T. T. Kim, H. V. Poor, and A. Tajer, “Coordinated data-injection attack and detection in the smart grid: A detailed look at enriching detection solutions,” IEEE Signal Processing Magazine, vol. 29, no. 5, pp. 106–115, Sept 2012.
[12] M. Esmalifalak, L. Liu, N. Nguyen, R. Zheng, and Z. Han, “Detecting stealthy false data injection using machine learning in smart grid,”IEEE Systems Journal, vol. PP, no. 99, pp. 1–9, 2014.
[13] S. Bi and Y. J. Zhang, “Graphical methods for defense against false-data injection attacks on power system state estimation,”
IEEE Transactions on Smart Grid, vol. 5, no. 3, pp. 1216–1227, May 2014.
[14] T. T. Kim and H. V. Poor, “Strategic protection against data injection attacks on power grids,”IEEE Transactions on Smart Grid, vol. 2, no. 2, pp. 326–333, June 2011.
[15] N. M. Manousakis and G. N. Korres, “Optimal PMU placement for numerical observability considering fixed channel capacity - A semidefinite programming approach,”IEEE Transactions on Power Systems, vol. 31, no. 4, pp. 3328–3329, July 2016.
BIOGRAPHIES
Jing Jiang ([email protected]) is a Research Associate in the School of Engineering and Computing Sciences, Durham University, UK. In 2011, she obtained her Ph.D. degree from the University of Edinburgh, UK. During 2011-2014, she was a Research Fellow with the Centre for Communication Systems Research, University of Surrey, UK. Her recent research interests include smart grid, next generation wireless communications, massive-MIMO and MIMO tech-niques, cognitive radio, relay and cooperation techtech-niques, and energy efficient system design.
Yi Qian ([email protected]) is a professor in the Department of Electrical and Computer Engineering, University of Nebraska-Lincoln (UNL). Prior to joining UNL, he worked in the telecommunications industry, academia, and the government. His research interests include in-formation assurance and network security, network design, network modeling, simulations and performance analysis for next generation wireless networks, wireless ad-hoc and sensor networks, vehicular networks, smart grid communication networks, broadband satellite networks, optical networks, high-speed networks and Internet.
Bus 1 Bus 4 Bus 9 Bus 5 Bus 8 Bus 2 Bus 3 Bus 6 Bus 7 Load Load Load Power Generator Power System Power Generator Measurements from meters/sensors Communication Network Control Center !"#$%&& '($)*+& Bus 3 Bus 6 !"#$%&& '($)*+& r r r r r r r rr B Bu Power Generator L d Wireless communication links State estimator and attack detector Supervisory control and data
acquisition (SCADA) host
All energy management system (EMS) application functions
Fig. 1. A block architecture diagram of the power system, communication network, and control center of a smart grid. An IEEE 9-bus system is chosen to illustrate the power system.
Algorithm 1 Adaptive detection of data injection attacks I. Initialization: i= 0, collect historical estimated state vector. II. Repeat the procedure for detecting bad data injection attacks:
1: Update i←i+ 1;
2: Obtain current measurement vector zi;
3: Calculate the measurement change vector wi;
4: Estimate the state change ∆ˆxi using the weighted least-square method;
5: Calculate the measurement change residual ri; 6: Identify and classify data attacks:
if the Euclidean norm of ri is larger than τ1 then
report non-stealthy data injection attack and exit else if the Euclidean norm of ∆ˆxi is larger than τ2 then
report stealthy data injection attack and exit
elsemake the decision of no attack, obtain the estimated stateˆxi; update the last-time-slot estimated state ˆxi−1 = ˆxi, and continue the state estimation process
III. Until non-stealthy or stealthy data injection attack is determined.
IV. Terminate the attack detection process and report the detected data injection attack to system operators.
V. System operators distinguish between data injection attacks and electrical accidents.
0.1 0.2 0.3 0.4 0.5 0.6 0.7 0.8 0.9 1 Probability of false alarm
(b) 0 0.2 0.4 0.6 0.8 1 Probability of detection
Proposed detection scheme Non-stealthy attack, ANR=10dB Stealthy attack, ANR=10dB Non-stealthy attack, ANR=12dB Stealthy attack, ANR=12dB Non-stealthy attack, ANR=6dB Stealthy attack, ANR=6dB 0 0.1 0.2 0.3 0.4 0.5 0.6 0.7 0.8 0.9 1
Probability of false alarm (a) 0 0.2 0.4 0.6 0.8 1 Probability of detection
Conventional detection method Non-stealthy attack, ANR=10dB Stealthy attack, ANR=10dB
Fig. 2. Performance comparison of the proposed detection scheme and conventional detection method for IEEE 9-bus test system, where SNR = 20 dB is considered.
0 0.1 0.2 0.3 0.4 0.5 0.6 0.7 0.8 0.9 1 Probability of false alarm
0 0.1 0.2 0.3 0.4 0.5 0.6 0.7 0.8 0.9 1 Probability of detection
Performance of the proposed detection scheme
Stealthy attack, ANR=8dB Stealthy attack, ANR=10dB Stealthy attack, ANR=12dB Non-stealthy attack, ANR=8 dB Non-stealthy attack, ANR=10 dB Non-stealthy attack, ANR=12 dB Random guess line
IEEE 14-bus test system
Fig. 3. Performance of the proposed detection scheme for IEEE 14-bus test system (SNR = 20 dB and various values of ANR are considered). 2 4 6 8 10 12 14 16 18 Attack-to-noise ratio (dB) 0 0.1 0.2 0.3 0.4 0.5 0.6 0.7 0.8 0.9 1 Probability of detection
Proposed scheme for non-stealthy attack, prob. of false alarm is 0.4 Proposed scheme for stealthy attack, prob. of false alarm is 0.4 Proposed scheme for non-stealthy attack, prob. of false alarm is 0.3 Proposed scheme for stealthy attack, prob. of false alarm is 0.3 Conventional method for stealthy attack, prob. of false alarm is 0.4 Conventional method for stealthy attack, prob. of false alarm is 0.3
IEEE 57-bus test system
Fig. 4. Performance comparison of the proposed detection scheme and conventional detection method for IEEE 57-bus test system (SNR = 20 dB and various values of ANR are considered).