Analysis of Parallel Software development using the
relative development Time Productivity Metric
Andrew Funk
MIT Lincoln Laboratory
Victor Basili
University of Maryland, College Park
Lorin Hochstein
University of Nebraska, Lincoln
Jeremy Kepner
MIT Lincoln Laboratory
1 High Productivity Computer Systems - http://www.HighProductivity.org/ 2 Kepner, J. “HPC Productivity Model Synthesis.”
IJHPCA Special Issue on HPC Productivity, Vol. 18, No. 4, SAGE 2004.
3 Funk, A., Basili, V., Hochstein, L., Kepner, J. “Application of a Development Time Productivity Metric to Parallel Software Development.” Second International Workshop on Software Engineering for High Performance Computing Systems Applications. St. Louis, Missouri. May 15, 2005.
4 Funk, A., Kepner, J., Basili, V., Hochstein, L. “A Relative Development Time Productivity Metric for HPC Systems.” Ninth Annual Workshop on High Performance Embedded Computing, 20 – 22 September 2005, Lexington, MA.
5 Wheeler, D. SLOCcount. http://www.dwheeler.com/sloccount/
introduction
As the need for ever greater computing power begins to overtake the processor performance increases predicted by Moore’s Law, massively parallel architectures are becoming the new standard for high-end computing. As a result, programmer effort is increasingly the dominant cost driver when developing high performance computing (HPC) systems. For the end user, whereas execution time was once the primary concern, development time is now a significant factor in overall time to solution.
In the DARPA High Productivity Computer Systems (HPCS) program1 we have defined the
overall system productivity, ψ, as utility over cost:
CS + C0 + CM
U(T)
ψ =
where utility, U(T), is a function of time. Generally speaking, the longer the time to solution,
the lower the utility of that solution will be. The denominator of the formula is a sum of costs: software (CS), operator (CO), and machine (CM). A higher utility and lower overall cost lead to a
greater productivity for a given system.
Previously we defined a special case that we call relative development time productivity.3 4
For the programmer, system utility is measured in terms of application performance. From the end-user’s perspective, the only relevant cost is that of software development. Thus, for the end-user developing small codes, we define productivity as:
= application performanceprogrammer effort small codes
ψ
For the case of developing parallel codes, we compare the parallel application performance to that of a baseline serial application (i.e., parallel speedup) and compare the effort required to develop the parallel application to the effort required for the serial version. Thus we define relative development time productivity (RDTP) as:
= relative effortspeedup
relative
ψ
This metric has been used to analyze several parallel computing benchmark codes and graduate student programming assignments. For purposes of analysis in this paper, relative effort is defined as the parallel code size divided by the serial code size, where code size is measured in source lines of code (SLOC).5
Analysis
Classroom Experiments
In the HPCS program a series of classroom experiments was conducted in which students were asked to create serial and parallel programming solutions to classical problems (see “Experiments to Understand HPC Time to Development” in this issue). The students used C, Fortran, and Matlab for their serial codes, and created parallel versions using MPI, OpenMP, and Matlab*P (“StarP”).6 Using a combination of student effort logs and automated tools, a
variety of information was collected, including development time, code size, and runtime per-formance.
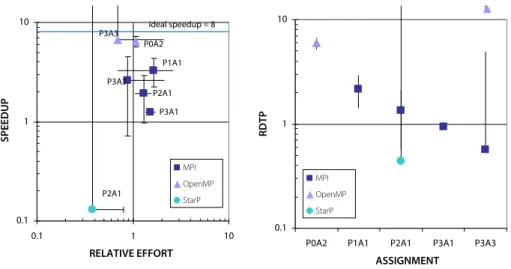
In Figure 1, the graph on the left depicts speedup vs. relative effort for seven classroom assignments. Each data point is labeled according to professor and assignment number, e.g., “P0A1.” The graph on the right plots the median RDTP values for these same classroom assign-ments (P2A1 and P3A3 each involved two sub-assignassign-ments using different programming models). The speedup and relative effort were computed by comparing each student’s parallel and serial implementations, and the median values for each assignment are plotted on the graph on the left. Error bars indicate one standard deviation from the median value. For purposes of comparison, all performance data was taken from runs using eight processors.
The MPI data points for the most part fall in the upper-right quadrant of the speedup vs. relative effort graph, indicating that students were generally able to achieve speedup using MPI, but at the cost of increased effort. The OpenMP data points indicate a higher achieved speedup compared to MPI, while at the same time requiring less effort. A plot of the RDTP metric (Figure 1, right) makes this relationship clear. Based on the results from these experiments, students were able to be the most productive when using OpenMP. While the StarP implemen-tations required the least relative effort, most students were not able to achieve speedup. This is reflected in the lower RDTP value for StarP.
P3A3 P2A1 P3A1 P1A1 P0A2 P3A3 P2A1 0.1 1 10 0.1 1 10 RELATIVE EFFORT SPEEDUP MPI OpenMP StarP ideal speedup = 8 0.1 1 10
P0A2 P1A1 P2A1 P3A1 P3A3
ASSIGNMENT
RDTP
MPI OpenMP StarP
Figure 1. Speedup vs. Relative Effort and RDTP for the classroom experiments.
6 Choy, R., Edelman, A. MATLAB*P 2.0: A unified
parallel MATLAB. MIT DSpace, Computer Science col-lection, Jan. 2003. http://hdl.handle.net/1721.1/3687
NAS Parallel Benchmarks
The NAS Parallel Benchmark (NPB)7 suite consists of five kernel benchmarks and three
pseudo-applications from the field of computational fluid dynamics. The NPB presents an excellent resource for this study, in that it provides multiple language implementations of each benchmark. The exact codes used were the C/Fortran (serial, OpenMP) and Java implementa-tions from NPB-3.0, and the C/Fortran (MPI) implementaimplementa-tions from NPB-2.4. In addition, a parallel ZPL8 implementation and two serial Matlab implementations were also included in the
study.
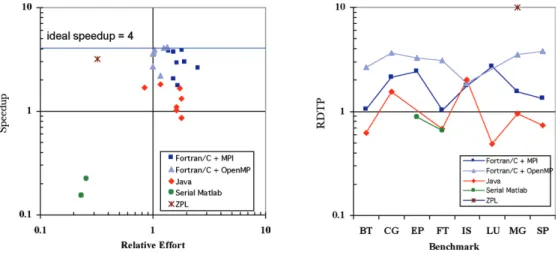
In Figure 2, the chart on the left displays speedup vs. relative effort for the NPB. Each data point corresponds to one of the eight benchmarks included in the NPB suite, and the results are grouped by implementation. The chart on the right plots the RDTP values for the various implementations of each of the eight NPB benchmark codes. For purposes of comparison, each parallel code was run using four processors. The speedup and relative effort for each benchmark implementation are calculated with respect to a reference serial code implemented in Fortran or C.
As shown, the OpenMP implementations tend to yield parallel speedup comparable to MPI, while requiring less relative effort. This is reflected in the higher RDTP values for OpenMP. The lone ZPL implementation falls in the upper-left quadrant of the graph, delivering relatively high speedup while requiring less effort, as compared to the serial Fortran implementation. Accordingly, this ZPL implementation has a high RDTP value. Although a single data point does not constitute a trend, this result was included as an example of an implementation that falls in this region of the graph. The Matlab results provide an example of an implementation that falls in the lower-left quadrant of the graph, meaning that its runtime is slower than serial Fortran, but it requires less relative effort. By virtue of its extremely low relative effort, the serial Matlab manages to have a RDTP value comparable to parallel Java.
Figure 2: Speedup vs. Relative Effort and RDTP for the NPB.
7 NAS Parallel Benchmarks - http://www.nas.nasa.gov/Software/NPB/
8 ZPL -
HPC Challenge
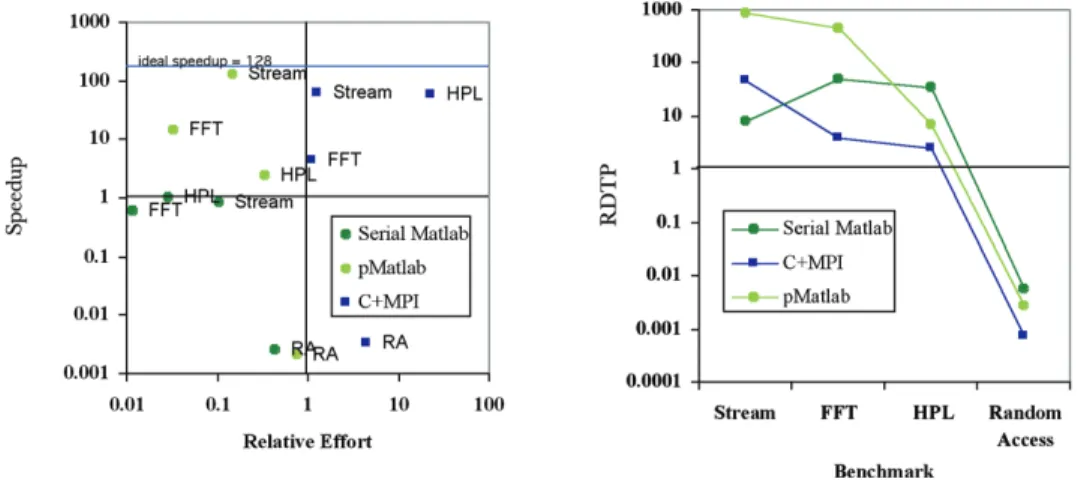
The HPC Challenge suite consists of several activity-based benchmarks designed to test various aspects of a computing platform (see “Design and Implementation of the HPC Challenge Benchmark Suite” in this issue). The four benchmarks used in this study were FFT (v0.6a), High Performance Linpack (HPL, v0.6a), RandomAccess (v0.5b), and Stream (v0.6a). These codes were run on the Lincoln Laboratory Grid (LLGrid), a cluster of dual-processor nodes connected by Gigabit Ethernet.9 The parallel codes were each run using 64 of these dual-processor nodes,
for a total of 128 CPUs. The speedup for each parallel code was determined by dividing the runtime for a baseline serial C/Fortran code by the runtime for the parallel code (the serial Matlab code was treated the same as the parallel codes for purposes of comparison).
Figure 3 presents the results of RDTP analysis for the HPC Challenge benchmarks. With the exception of Random Access (the implementation of which does not scale well on distributed-memory computing clusters), the MPI implementations all fall into the upper-right quadrant of the graph, indicating that they deliver some level of parallel speedup, while requiring greater effort than the serial code. As expected, the serial Matlab implementations do not deliver any speedup, but all require less effort than the serial code. The pMatlab implementations (except Random Access) fall into the upper-left quadrant of the graph, delivering parallel speedup while at the same time requiring less effort.
The combination of parallel speedup and reduced effort means that the pMatlab implementa-tions generally have higher RDTP values. On average the serial Matlab implementaimplementa-tions come in second, due to their low relative effort. The MPI implementations, while delivering better speedup, also require more relative effort, leading to lower RDTP values.
Figure 3. Speedup vs. Relative Effort and RDTP for HPC Challenge.
HPC Challenge Award Competition
In the HPC Challenge Award Competition, teams were invited to submit their own imple-mentations of selected benchmarks from the HPC Challenge benchmark suite.10 Evaluation
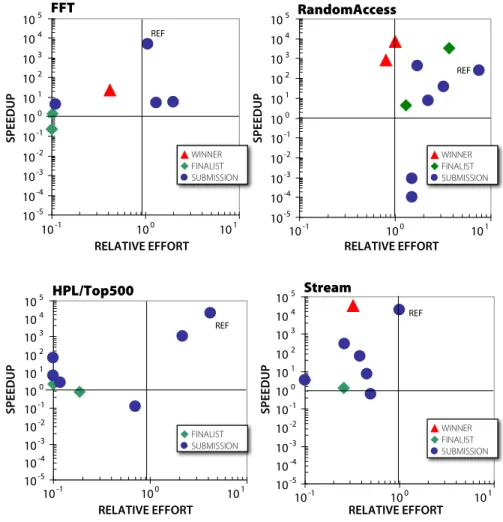
of entries was weighted 50% for performance and 50% for code elegance, clarity, and size. The results of this competition are shown in Figure 4.
9 Haney, R. et. al. “pMatlab Takes the HPC Challenge.” Poster presented at High Performance Embedded Computing (HPEC) workshop, Lexington, MA. 28-30 Sept. 2004.
10 HPC Challenge - http://icl.cs.utk.edu/hpcc/, http://www.hpcchallenge.org/
These graphs indicate the speedup and relative effort for each submitted implementation of the FFT, RandomAccess, HPL/Top500, and Stream benchmarks. Teams reported the per-formance of their implementation running on their own parallel computing platform, with no restriction on number of processors. This performance was compared to that of a baseline serial implementation to compute speedup. Relative effort is taken as the size of the parallel code relative to the baseline serial implementation. For each benchmark, the speedup and relative effort for the reference C/MPI implementation is indicated for comparison. The reference C/ MPI implementation generally falls in the upper right quadrant of the graph, indicating that it achieved speedup at the cost of additional effort with respect to the serial version.
As shown in the graphs, 24 of the 30 submissions achieved speedup relative to the serial version, and 18 entries required less effort (i.e., smaller code size) relative to the serial version. All but two of the entries required less effort than the C/MPI reference implementation. It is also worth noting that half of the submissions, including all of the winning entries, fall in the upper left quadrant of the graph, indicating that they achieved speedup while requiring less development effort relative to the serial implementation. This result bolsters the argument for using a metric such as RDTP which takes into account both performance and developer effort.
101 100 10-1 101 100 10-1 10-2 10-3 10-4 10-5 102 103 104 105 RELATIVE EFFORT SPEEDUP WINNER FINALIST SUBMISSION REF 10-1 100 101 10-5 10-4 10-3 10-2 10-1 100 101 102 103 104 105 RELATIVE EFFORT SPEEDUP WINNER FINALIST SUBMISSION REF 101 100 10-1 105 104 103 102 101 100 10-1 10-2 10-3 10-4 10-5 RELATIVE EFFORT SPEEDUP FINALIST SUBMISSION REF 10-1 100 101 10-5 10-4 10-3 10-2 10-1 100 101 102 103 104 105 RELATIVE EFFORT SPEEDUP WINNER FINALIST SUBMISSION REF
Conclusions and Future Work
We have previously introduced a common metric for measuring relative development time productivity of HPC software development. The RDTP metric has been applied to data from benchmark codes and classroom experiments, with consistent trends for various programming models.
In general the results support the theory that traditional HPC programming models such as MPI yield good speedup but require more relative effort than other implementations (Figure 5). OpenMP generally provides speedup comparable to MPI, but requires less effort. This leads to higher values of the RDTP metric. There are questions of scalability with regard to OpenMP that are not addressed by this study.
The pMatlab implementations of HPC Challenge provide an example of a language that can yield good speedup for some problems, while requiring less relative effort, again leading to higher values of the RDTP metric.
Further classroom experiments are planned, and as more data is collected it will be analyzed in the same manner, to see if other trends emerge. Our current work is focused on designing a standard framework for automating the collection, storage, and analysis of workflow data (see “Modeling HPC workflows with timed Markov models” in this issue).
101 100 10-1 103 102 101 100 10-1 10-2 10-3 RELATIVE EFFORT SPEEDUP REF Traditional HPC
"All too often" Java, Matlab, Python, etc.
Figure 5. Speedup and Relative Effort are both important indicators of time to solution.
Acknowledgments
We wish to thank all of the professors whose students participated in this study, including Jeff Hollingsworth, Alan Sussman, and Uzi Vishkin of the University of Maryland, Alan Edelman of MIT, John Gilbert of UCSB, Mary Hall of USC, and Allan Snavely of UCSD.
This work is sponsored by Defense Advanced Research Projects Administration, under Air Force Contract F19628-00-C-0002. Opinions, interpretations, conclu-sions and recommendations are those of the author and are not necessarily endorsed by the United States Government.
http://www.ctwatch.org/
Cyberinfrastructure Technology
Watch
VOLUME 2 NUMBER 4A
NOVEMBER 2006
ISSN 1555-9874
GUEST EDITOR
JEREMY KEPNER
High Productivity Computing Systems
and the
Path Towards
Usable Petascale Computing
Making the Business Case for High
Performance Computing: A Benefit-Cost
Analysis Methodology
Suzy Tichenor and Albert Reuther
Observations About Software Development for
High End Computing
Jeffrey Carver, Lorin Hochstein, Richard Kendall, Taiga Nakamura, Marvin Zelkowitz, Victor Basili,
and Douglass Post
What’s Working in HPC: Investigating HPC
User Behavior and Productivity
Nicole Wolter, Michael O. McCracken, Allan Snavely, Lorin Hochstein, Taiga Nakamura, and Victor Basili
Application Software for High
Performance Computers: A Soft Spot for U.S.
Business Competitiveness
Suzy Tichenor
High Productivity Computing Systems and
the Path Towards Usable Petascale Computing
Jeremy KepnerDesign and Implementation of the HPC
Challenge Benchmark Suite
Piotr Luszczek, Jack J. Dongarra, and Jeremy Kepner
Analysis of Parallel Software Development
Using the Relative Development Time
Productivity Metric
Andrew Funk, Victor Basili, Lorin Hochstein, and Jeremy Kepner
Experiments to Understand HPC Time to
Development
Lorin Hochstein, Taiga Nakamura, Victor R. Basili, Sima Asgari, Marvin V. Zelkowitz, Jeffrey K. Hollingsworth, Forrest Shull, Jeffrey Carver, Martin Voelp, Nico Zazworka, and Philip Johnson
Available on-line at http://www.ctwatch.org/quarterly/
Software Productivity Research In High
Performance Computing
Susan Squires, Michael L. Van De Vanter, and Lawrence G. Votta