Volume 10 | Issue 1 Article 2
2013
Evaluate the Effect of IMF’s Longer-Term
Concessional Lending Programs on Growth in the
Development Background of Sub-Saharan Region
Guanyi YangOhio Wesleyan University, [email protected]
This Article is brought to you for free and open access by The Ames Library, the Andrew W. Mellon Center for Curricular and Faculty Development, the Office of the Provost and the Office of the President. It has been accepted for inclusion in Digital Commons @ IWU by the faculty at Illinois Wesleyan University. For more information, please [email protected].
©Copyright is owned by the author of this document.
Recommended Citation
Yang, Guanyi (2013) "Evaluate the Effect of IMF’s Longer-Term Concessional Lending Programs on Growth in the Development Background of Sub-Saharan Region,"Undergraduate Economic Review: Vol. 10: Iss. 1, Article 2. Available at: http://digitalcommons.iwu.edu/uer/vol10/iss1/2
Abstract
Despite different voices from critics, the IMF has put development at the center of its policies. This paper tries to separate the effect of SAF, ESAF, PRGF, and ECF on growth empirically. Selecting a sample of 44 countries in the Sub-Saharan region from 1986 to 2011, it analyzes whether the IMF’s longer-term structural
adjustment programs influences economic growth in participating countries. Consistent with previous studies, this research shows that SAF and ESAF have statistically insignificant impact on growth in the short term and long term. PRGF and ECF, on the other hand, are found to have a large and strong positive correlation with growth rate in the short run, and immaterial impact in the long run. Results also show that the structural adjustment programs not only offer impact through loan disbursement, but more through the catalytic effect that goes along with the loan. The overall result provides evidence that the “streamlining” revolution of the IMF in providing structural adjustment advice has shown optimistic effect in Sub-Saharan Africa economic growth.
Keywords
I. Introduction
Founded at the end of the World War II, the International Monetary Fund (IMF) has played a key role in shaping the global economy. Standing at the center of the world economic development, the IMF has seen much criticism towards its structure and lending practices over the past 70 years. In 1986, accompanying the crisis in the third world countries and the emerging structural problems from the countries in transition, the IMF started its first formal longer term structural adjustment assistance program to low income countries, the Structural Adjustment Facility (SAF). From 1986 to present, the IMF’s longer term structural adjustment programs have been evolving and expanding, and its effectiveness has been the focus of criticism. Although under pressure from numerous independent studies urging it to abandon its role in development, the IMF has regarded growth and development the ultimate goal of all its modern programs.
Since its liberation, Sub-Saharan Africa has experienced the longest period of economic growth only recently. In spite of this, Mbadlanyana, Sibalukhulu and Cilliers (2011) predict that most issues relating to severe global poverty will be located in this region in the next few decades. The issues of African development are long-term.
Starting with the region’s independence, its development has accumulated attention from most bilateral and multilateral aid agencies; however, a series of traps has prevented the growth and aid effectiveness in this region. Most of the Sub-Saharan African countries have joined the IMF membership since the early 1970s, and one of the first groups of countries borrowing from the structural adjustment programs is from the Sub-Saharan region. Since 1986, it has been the center location of structural adjustment aid from the IMF. By 1999, as Hutchison and Noy (2003) calculated, Africa had accumulated 72% of
all the long-term programs from the IMF since 1952. Notwithstanding, little systematic attention has been paid to assessing the impact of aid on government actions and the results in this region (Mbadlanyana, Sibalukhulu, and Cilliers, 2011).
There are a tremendous number of studies evaluating the IMF’s program and policy effectiveness. Nevertheless, most of these studies have either been focusing on the short-term balance-of-payment-centered facilities, or have not been specifying any types of programs at all. Given the different nature of the longer term structural adjustment programs, therefore, a systematic study is in need. Even in the limited literature on IMF structural adjustment programs, the latest I have encountered was a review study
published in 2006. Since then, there has been another cycle of changes in IMF’s
structural adjustment programs, which the PRGF had been implemented for ten years and was succeeded by a new program ECF in 2009. In order to capture the evolution of the structural adjustment programs in the 2000s, in this paper, I included a time span from 1986 to 2011, the full history of the structural adjustment programs. I selected the Sub-Saharan African countries as the development context in evaluating the effectiveness of the IMF’s longer-term structural adjustment programs, including the Structural
Adjustment Facility (SAF), the Extended Structural Adjustment Facility (ESAF), the Poverty Reduction and Growth Facility (PRGF) and the Extended Credit Facility (ECF). With a full life-span of ten years of data on the PRGF implementation as well as the new start of ECF, this paper will provide a more comprehensive scope. While focusing on one specific region, the region with the most usage of structural programs, I effectively eliminate the geopolitical heterogeneity that might potentially bias the result.
In this research, I referred to the political economics model from Ivanova et al.(2001) to construct a theoretical hypothesis of the relationship between the IMF and the incumbent government. In the model, the aid and conditionality effectiveness to the country’s welfare depends on government’s level of concern to the general public and the bargaining process between the IMF and the government. The higher the IMF’s plan weights in the bargaining, the more the government is concerned about its people, and hence, the higher welfare a program brings to.
Based on this model, I ran a series of probit regressions to evaluate the determinants of participating in an IMF structural adjustment program and tobit regressions to evaluate the determinants of loan disbursement from each individual structural adjustment program. At last, a set of fixed effect regressions with robust country group clustered error adjustment were employed to assess the effect of
participation and loan disbursement of the structural adjustment program on growth rate in Sub-Saharan countries. I not only looked at the immediate effect from the aid
disbursement, but also the effect afterwards until three years later. According to the result, the level of loan disbursement from SAF had a negative effect on growth across years. As the evolution of the IMF’s longer term structural adjustment program, the more and more positive results are seen in its effect on growth. The ECF, the most recently modified and adopted program has demonstrated a large and strong statistically
significant positive effect on growth; however, due to data availability, the robustness is still in need of verification.
Due to data availability, some more extensive econometric skills are not able to fully account for certain issues. Fixed effect method can only account for the unobserved
factors that maybe correlated to growth and program participation, and only under the situation of unobserved factors being stable over the years. Instrumental variable is still needed to account for the direct relationship between growth and program participation. The effect of the World Bank is deemed to be significant in the Sub-Saharan region, especially towards growth and poverty reduction. However, this paper could not find enough supporting data to control the effect of the World Bank on this region’s growth. The measurement of the loan disbursement may also bias the effect in the short run.
The rest of this paper continues as follows: Section II provides history and theory backgrounds for the IMF and its programs, the history of IMF structural adjustment programs, and the Sub-Saharan development. Section III presents a literature review on key findings and arguments in previous studies on the effectiveness of IMF programs and on growth and poverty reduction theories. Section IV provides theoretical framework and hypotheses for this paper, and introduces variables for the analysis. Section V explains research methodology. Section VI gives data and descriptive analysis. Section VII presents regression analysis. Section VIII discusses the key results from the regression; and lastly, Section VIIII concludes the study by summarizing its findings and
contributions and its policy implementation.
II. Background
A. Brief History of IMF
Founded in December, 1945, with its membership growing from 29 states to 188 at present, the IMF has gone through multiple stages of changes. As an almost universal
financial institution (Barro and Lee, 2005), its history has been shaped by and is shaping the world’s historical events, as well as the evolution of economic ideas (Bird, 2007). In its role in providing regular consultation to all member countries, collecting data and overseeing the world economy, lending resources and advising on policies to bring about economic adjustment, the IMF has been on the focus of close attention and critical examination (Bird, 2007).
When the IMF was officially initiated, its purpose was to oversee the operation of the Bretton Woods International Monetary System. Besides this main purpose, the IMF was also an adjustment agency providing advice on balance of payment policy, and a financing agency providing short-term liquidity to countries encountering balance of payment problems (Bird and Mosely, 2003). However, since the early 1970s, as the flexible exchange rate regime replaced the fixed ones, the Bretton Woods system collapsed; private capital market providing balance of payment financing shifted the responsibility of the IMF away (Bird and Mosely, 2003). Accordingly, much of the IMF’s systemic role disappeared.
In 1980s, the Third World debt crisis induced the IMF’s involvement in smaller and poorer countries in Latin America, Africa, and Asia. Followed by the fall of
communism in the 1990s, it created a number of new borrowing countries, so-called countries in transition. And indeed, the IMF ceased lending to industrial countries altogether (Bird and Mosely, 2003). With its increasing involvement in countries and issues that it was not originally designed to handle, the IMF has been exposed to a
broader range of criticism. The Meltzer Commission, a leading critic, argues that the IMF was ineffective and inefficient, and was in need of a reform (Bird, 2007). Conditionality
was also perceived as excessive (Bird, 2004). Facing these criticisms, the IMF started a reassessment of its programs and is trying to establish a medium-term strategy (IMF, 2005).
B. IMF programs and conditionality
Upon joining the IMF, each member country is required to contribute to 25% of the quota in the form of international currency or SDR. The size of the quota depends on the size of the member country’s economy. Hence, the 25% of the quota is free for the country to take out (Barro and Lee, 2005). If a country, however, needs to withdraw more than 25% of the quota, it needs to comply with IMF’s loan conditions (Przeworski and Vreeland, 2000).
The IMF Articles of Agreement entails IMF facilities to provide temporary balance-of-payment support to countries. In order to fulfill the requirement of
“temporary,” the IMF created the policy of conditionality over time to assist participating countries to exit quickly from its balance of payment problems (Conway, 2007). The typical conditionality involves “fiscal austerity, tight monetary policy, and currency devaluation” (Taylor, 1993). The combination of purchase facility and associated conditions is referred to as an IMF program. As calculated by Bird (2007), at any one time, the IMF may have as many as about 60 active programs with individual countries.
IMF programs can be categorized into nonconcessional and concessional loans based on terms of repayment and interest rate. The typical nonconcessional loans include: the Stand-By Agreement (SBA), the Flexible Credit Line (FCL), the Precautionary and Liquidity Line (PLL), and the Extended Fund Facility (EFF). The concessional loans
historically include: Structural Adjustment Facility (SAF), Enhanced Structural Adjustment Facility (ESAF), Poverty Reduction and Growth Facility (PRGF), and currently, the Extended Credit Facility (ECF), Standby Credit Facility (SCF), and Rapid Credit Facility (RCF). Polak (1991) states that the fundamental objectives of programs are similar, and differences only exist in conditions, timing, and size of the loan disbursement. In this research, I specifically focus on the longer term structural adjustment concessional loans through history, which are SAF, ESAF, PRGF, and currently, ECF.
C. Programs Targeting Growth and Poverty Reduction - History and Importance
Traditionally, the IMF responds to the balance of payment problems through a system of short-term facilities mainly involving SBA and EFF, covering a period of 1-2 years with repayment between 3 ¼ and 5 years (Barro and Lee, 2005). The notion of structural adjustment wasn’t born until after the oil crisis in the late 1970s. Structural adjustment entails a combination of macroeconomic stabilization and microeconomic efficiency and openness (Bird, 2004). Subsequently, in 1986, the IMF established the SAF as its first longer term structural adjustment program, to its low income members, and the ESAF in 1987, which had a repayment schedule of over 5-10 years after a 5-year grace period. In 1999, the ESAF was modified and renamed the Poverty Reduction and Growth Facility (PRGF), which puts economic growth and poverty reduction at the center (Barro and Lee, 2005). Later in 2009, IMF approved its modification of PRGF into the Extended Credit Facility (ECF), operated under the Poverty Reduction and Growth Trust (PRGT), which further streamlined its conditionality. As Bird and Mosely (2003) explain, these programs impact growth through three channels. The first channel manages
the aggregate demand. The second raises aggregate supply through structural adjustment. The third relates to catalytic effect that attracts additional private investment and capital inflows to the program country.
D. Sub-Saharan Development
After a short prosperous boom following its independence in early 1960s, over the past 40 years, Africa has stagnated while other developing countries have vastly grown. Since 1960, Africa’s share in world trade declined, and per capita GDP in Africa was sluggish. This divergence turned Africa, especially the Sub-Saharan area into the world’s poorest region. Collier (2006) identifies four development traps for the Sub-Saharan region: the conflict trap, the corruption trap, the primary commodity trap and the fractionalized society trap. These traps are shown as wide spread coups, civil strife, ethnic violence, inefficient use of resource and public administration, decaying institutional capacity, deteriorating social conditions, increasing environmental degradation and so on (Heidhues, 2009). They prevented Africa’s development and weakened the effectiveness of aid. Under these traps, low economic growth ties with low investment and saving rates, skyrocketed foreign debt, declining output of industry and manufacturing, and adverse terms of trade (Heidhues, 2009). By 1980s, Africa’s crisis was deepening. The World Bank and the IMF proposed the structural adjustment approach for a fundamental shift to stabilize African economy. Heidhues (2009) summarizes that these programs called for reducing the role of state administration in macroeconomic policies, containing government spending, privatizing public sectors, and most importantly, calling for devaluation and trade liberalization in order to improve balance of payment and control for foreign debt. Subsequently, the introduction of the
poverty reduction strategy papers (PRSPs) focused more on integrating culture, social, environmental and political factors in development strategies, and created a framework for pro-poor growth (Heidhues, 2009; Kibuka, 2007).
While in contrast to the structural programs which were frequently criticized of having negative impact on the poor, Bird (2004) concludes that PRGF as a leading PRSP from the IMF, has been shown successful effects on reformations in Sub-Saharan region. However, PRGF has also been conceived as at cost of increasing unemployment and a decline in public services, even in health, education, and research. After a decade of endeavor, it is a crucial time to take advantage of the accumulation of data and reevaluate the effectiveness of structural adjustment programs on their pro-poor growth target.
III. Literature Review
A. Arguments on Development Centered Programs
The shift of focus from stabilization to economic growth and poverty reduction has brought up much of the recent argument questioning the role of the IMF. The Council on Foreign Relations (CFR) Task Force argues that “IMF should focus on monetary, fiscal and exchange rate policies plus financial-sector surveillance and reform and stay out of longer-term structural adjustment.”
The Overseas Development Council (ODC) Task Force also argues that IMF’s long-term structural lending has not been effective. The ineffectiveness stems from the lending associated moral hazard issues, the overlapping role of IMF’s structural
adjustment programs and the World Bank, and the emphasis on mandates and
conditionality. The Meltzer Report claims that IMF long-term adjustment lending yields moral hazard problems through providing an implicit insurance to private creditors, which encourages over-lending behavior (Bird and Mosely, 2003). However, Willett (1999) and Land and Philips (2000) find no significant evidence on this claim. Instead, empirical evidence shows that ESAF with its tight conditionality had a discouraging effect on borrowers (Bird, 1995). As to the effectiveness argument, Bird (2004) stated that there is hardly a scientific consensus. The most commonly accepted statement suggests that IMF programs have at least a short-run negative effect on economic growth and possibly enduring adverse effect on growth (Conway, 1994; Killick, 1995;
Przeworski and Vreeland, 2000; Hutchison, 2001; Barro and Lee, 2001).
Despite the numerous arguments advocating a narrow role for the IMF, that the IMF should only play as “the lender of the last resort”, Michel Camdessus (1990), the previous Managing Director of the IMF stated, “Our primary objective is growth… it is with a view toward growth that we carry out our special responsibility of helping to correct balance of payments disequilibria and, more generally, to eliminate obstructive macroeconomic imbalances.” Stanley Fischer, the previous deputy managing director of the IMF regards that macroeconomic stabilization is only a first step to poverty reduction, but is not sufficient (in Conway, 2006).
As previously stated, whether IMF indeed influences economic growth has been subject to a huge number of studies; seldom has any strict consensus emerged as whether IMF programs positively influenced growth and alleviated poverty. Reasons for this lack of agreement on the effectiveness of IMF’s structural adjustment program are
multifarious. The first relates to the individual researcher. Different researchers may have considered different time periods, or investigated different types of IMF programs
(Atoyan and Conway, 2005). Evaluation of IMF programs also involves different econometric techniques, especially towards the selection issues and endogeneity issues. The most common approaches to address the endogeneity problem include before and after analysis, control group methodology, fixed effects, and instrumental variables (Easterly, 2005). The second reason is the domestic statistical capacity. Most data available for research is evidence-based monitoring in program participating countries. Constructing statistical monitoring requires financial and human capital support, which is the shortcoming in LICs, hence providing constraints on data availability to researchers (Kibuka, 2007). Thirdly, the effectiveness of program conditionality also depends on the degree of implementation (Arpac, Bird and Mandilaras, 2008).
B. Growth and Poverty Reduction Theories
The nature of growth theory is ambiguous. The basic principle of growth relies upon factor accumulation and factor productivity. Bird (2004) claims that beyond this point, however, theories of growth become complicated. Empirically, Barro (1991) finds that growth is positively related to initial human capital and negatively related to the initial real per capita GDP. Growth is negatively related to the share of government spending in GDP and positively related to political stability and market health. The neo-classical model states that poor countries are also assumed to growth faster than the rich ones, with faster factor accumulations. On the other hand, poor countries can also be at a disadvantage due to low life expectancy, which retards incentive to invest in human capital (Cohen and Soto, 2002). Other studies, as documented by Collier (2008), show
that openness and economic liberalization, health and geography make a significant difference to growth. Economic liberalization along with significant institution reform is found positively influencing growth. Openness to trade also has a strong positive effect on growth. Berg and Krueger (2002) argue that trade and openness contribute to growth and thereby alleviate poverty, however Demery (2000) and Rajan and Bird (2002) provide evidence that not all groups among the poor benefit from growth in terms of openness and trade liberalization. Land-locked countries and those in the tropical zones tend to growth slower (Collier, 2008).
IV. Theoretical Framework and Variable Introduction
A. Theoretical Framework and Hypotheses:
This research selects all longer-term structural adjustment programs from the IMF that existed throughout history, evaluating factors leading to the program participation, and measures the growth outcome from program participation. Considering each programs individually, we can receive conclusion of the program’s effect across years. Comparing the growth effect across programs, we can also reach the conclusion of whether the evolution of structural adjustment programs in the IMF has been effective. Program participation is further measured by whether a country actually participates in a program and by the amount of loans disbursed from the program as a proxy to the extensiveness of participation.
In a typical political economy model, we regard the IMF as an international financial institution providing support and policy conditionality in affecting the
incumbent government’s economic policy choices. The incumbent government decides whether to join a program or not. Therefore, it plots a bigger picture once we figure out what factors contribute to government’s participation decision.
Ivanova et al.’s (2001) constructed the model describing the welfare gain for a country from an international financial institution loan based on the interactions between the amount of the loan and the policy distortion. Upon signing into a program, the
incumbent government, then, provides the actual policy changes incorporating the IMF’s conditionality as well as loans to affect the utility level of participation in a program. However, the optimal country welfare is not always the sole goal of the incumbent government. They often subject to corruption and special interest group distortion. In this paper, due to limited time and data availability, country fixed effect is introduced to account for the unobserved variables that include these policy distortion factors.
According to Ivanova et al. (2001), international assistance has a diminishing marginal return on country’s welfare. The level of appropriate conditionality, in return, accelerates the effect from loan. But, in corresponding to the moral hazard hypothesis, IMF loans induce bad economic policy with a higher level of policy distortion;
Boockmann and Dreher (2003) suggest that the money disbursed increases borrowing government’s leeway, thus reducing incentives to reform. Dreher and Vaubel (2004) also find evidence that more expansive economic policies are found in countries with higher IMF loan disbursement. Therefore, we don’t have a clear hypothetical direction of loan effect on growth. As introduced in previous sections, one of the main channels of the IMF influencing growth is the catalytic effect of bringing private investment and capital
inflow (Bird and Mosley, 2003). Therefore, we hypothesize that participation effect on growth is larger than the disbursement amount effect on growth.
Other things also affect the objective function of the IMF and the objective function of the incumbent government. Due to the concessional condition of the structural adjustment programs, the interest rate set by the IMF is minimal; hence, the difference between the market rate and the interest rate is considered a cost to the IMF. Therefore, we would expect the higher market rate, the less likely the IMF disburses a loan. As presented earlier in the Literature Review section, one channel for the IMF to influence the welfare of a country also relies on the catalytic effect. The higher the loan disbursed often sends a signal of higher trust to the private creditors; hence we would see a higher investment to contribute to growth along with the loan program. If a country is participating in another IMF short-term program, I would see an accelerating effect of loan on growth, since the country is targeting both short-term and longer term
adjustment, and the government should have low policy distortion to accept conditionality from both programs.
According to previous literature, human capital is hypothesized to be positively correlated to growth. As to the initial conditions of an economy, the neo-classical theory predicts that poorer countries grow faster to catch up; however, it may also represents a worse situation for the program to take effect; therefore, its direction of impact is hard to suspect.
B. Variable Introduction:
Most existing literature studying the growth effect of IMF programs has either chosen the measurement of result at the program year, immediately after the program year, or using the average growth rate of periods. In evaluating the growth effect of the longer-term programs, however, it is ideal to put a longer time span (of at least 10 years) to see the lagged effect on growth. Nevertheless, due to data availability, I would have to sacrifice the evaluation of part or all of PRGFs and all of ECFs to sustain the 10 year time span. Therefore, in this research, I focuse on dependent variables of growth rate in the program year, growth rate one year after the loan disbursement, growth rate two years after the loan disbursement, and growth rate three years after the loan disbursement. In this way, I extended the observation to a slightly longer period than what mostly literature have done, although still in the rein of “short-run”. Bird and Mosely (2003) describe that short-run effect is crucial for the successful completion of a program. If a structural adjustment program only focuses on its long-run effect and ignores its short-term effect, e.g. ignoring short-short-term growth, it will likely encounter strong social and political opposition and eventually fail. Notwithstanding, I will still provide growth effect in eight, nine, ten years in the appendix to supplement the result.
According to the theoretical framework and following Dreher (2006), this paper employs independent variables in evaluating the growth effect from six different groups: structural adjustment variables, involvement in the IMF, human capital indicators, world financial market indicator, initial economic indicator, and previous government policy. The structural adjustment variables are divided into two sets: one set considers simply the participation in each structural adjustment programs (SAF, ESAF, PRGF, and ECF),
while the other considers the level of loan disbursement from each program (SAFamount, ESAFamount, PRGFamount and ECFamount). Involvement in the IMF includes
inotherporgram. If a country is in another program (which includes short term traditional lending programs like Standbys and EFFs) targeting short-term balance of payment adjustment, it usually have to sacrifice its longer term goal, such as growth. Human capital indicators include populationgrowth and fertilityrate. Population growth and fertility rate provides potential for labor and human capital accumulation towards growth, hence are perceived to be positive. Initial economic indicators in the regression include
Ln_lag_gdppercapta1 and lag_investment1. Initial GDP per capital is hypothesized to have a negative relationship with growth; in other words, growth rises with worse initial situation. Initial investment is hypothesized to be positively related to growth. Previous policy group includes inflation and lag_governmentconsumption1. These two variables represent the level of policy distortion prior to the loan disbursement. We would see the negative relationship between policy distortion and growth rate. And lastly, libor
represents the world market.
Apart from examining the growth effect, this paper also seeks for factors affecting program participation and loan disbursement for different programs. According to
previous literature studying the determinant of program participation, I also include six groups of variables: involvement in the IMF, debt and national account, political
environment and ideology, world financial market indicator, initial economic conditions, previous debt and national account. In this setting, the involvement in the IMF includes:
inotherprogram, Ln_quotasize, and yearsmember. Debt and national account includes
includes lagged one year term for each one of the three). Political ideology related variables include: democracy and civilliberty. World financial market is indicated by
libor, again. Initial economic conditions inlucde Ln_lag_gdppercapita, and
lag_investment.
V. Econometrics Methodology
As previously touched on, there are a variety of methods commonly used to evaluate the impact of IMF programs. First, before-after analysis identifies the economic growth difference before the program approval and after the program completion. Any measurable growth is then attributed to the effect of the program. However, critics argue that this would understate the program’s effect since participating in a program often happens in the time of crisis. The second approach is often referred to as “with-without” approach, which is commonly used to compare the growth rate in program countries with that in a control group. However, disadvantage exists in the identification of control group. Programs are chosen in countries with specific characters, which may be the crucial differences from those non-program countries. The third is regression analysis. The regression analysis is considered the most promising approach, but only if the endogeneity problem is carefully accounted (Dreher, 2006; Evrensel, 2007). Evrensel (2002) concludes that all approaches are problematic, and a perfect solution to problems in the program evaluation does not exist. In this paper, I choose to use a regression analysis to measure the growth effect of IMF programs in Sub-Saharan region.
As previously indicated, the IMF programs are often chosen in times of economic crisis. We usually see a country signing into an IMF contract only under severe economic issues. Therefore, the participation in the IMF program is not independent from growth rate. The endogeneity problem associated with IMF variables needs to be accounted carefully. Previous research has frequently applied the instrumental variable method and the fixed effect method (Dreher, 2006). As with the measurement of the success of IMF programs, no approach to account for the endogeneity is perfect. The difficulty of implementing the instrumental approach lies in the finding of variables that only affect the probability of programs participation and loan distribution, without affecting growth. The deficiency of fixed effect approach can only account for certain types of endogeneity issues. Due to data availability and limited time span of research, I could not identify enough IV’s to effectively account for endogeneity in the regression. Hence, I use the fixed effect method with standard error adjusted for robust clustering by country to compensate the lack of instrument. The fixed effect effectively accounts for the unobserved factors that relate to growth and program participation (and loan
disbursement), only if unobserved factors do not vary from year to year. For example, besides the IMF, the World Bank has been heavily involved in the long term
development programs in Sub-Saharan countries. The impact from the World Bank can be reflected in the growth rate in a country. It may also relate to the IMF’s evaluation of the country’s situation in accepting the program request and the loan disbursement. I plot year against all independent variables from growth regressions for each country to examine possible variations across time. The result reveals a relative stable trend of the observed factors; hence, we infer that the unobserved factors stable over time, and that
the fixed effect model is effective. Although effective, the direct causal relationship between program participation variables and growth can still not be accounted. A systematic set of instruments are still needed for the future research.
Hence, the econometric model specifies as:
growth = f(structural adjustment program participation/disbursement, involvement in the IMF, human capital, world financial market indicator, initial
economic conditions, previous policy distortion, country dummies) (1)
Besides the growth regressions, for the regressions considering program participation determinants, I use probit regression; and for determinants on loan disbursement amount, I choose tobit regression.
Therefore, we have:
Program participation/loan disbursement = f(inotherprogram, Ln_quotasize, yearsmember. totaldebtservice, shorttermdebt, currentaccount, lag_totaldebtservice1, lag_shorttermdebt1, lag_currentaccount1, democracy, civilliberty, libor,
Ln_lag_gdppercapita1, lag_investment1) (2)
VI. Data and Descriptive Analysis
This research targets the impact of IMF mid-term to long-term structural adjustment lending programs on the economic growth of Sub-Saharan regions. In this paper, mid-term to long-term structural programs from the IMF include SAF, ESAF, PRGF, and ECF. Officially, 45 member countries are included in the IMF’s Sub-Saharan
regional groups. Due to lack of sufficient data, South Sudan is not included in the analysis. Since the first official structural adjustment program, SAF, was formally adopted in 1986, I included a time span from 1986 to 2011. In the sample, Senegal received the first SAF loan in 1986 for the amount of SDR 0.8 million. There are a total of 1127 observations. Each observation represents country i in year t. From now on, we refer to each observation as a country year. We refer to country years in a longer term structural adjustment program as program country year; otherwise, we refer it to non-program country year. Among all country years, there are 518 non-program country years, and 171 country years in other IMF lending programs, which include mostly SBA, EFF, and a few other temporary lending programs, and the rest are not in any typical IMF programs.
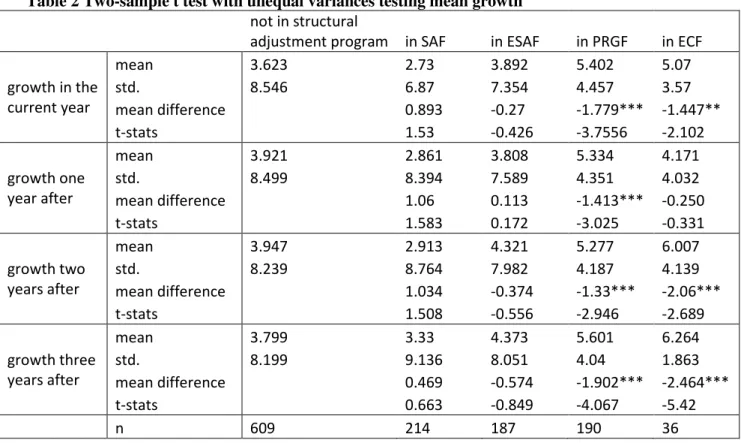
The table below (Table 1) presents descriptive statistics of all variables in the research (excluding the lag term variables). From Table 1, we can see that 19% of the country years have been under SAF programs, 17% in ESAF, 19% in PRGF, and 3.2% in ECF. The average growth rate is about 3.88% for all country years. Once we break down the full sample, the average growth rate for a program country year is 4.18% and 3.62% for a non-program country year (refer to Table 2, below).
Table 2 presents two sample t-tests results comparing differences in mean growth rates between non-program country years and program country years. We split the sample into participating in SAF, ESAF, PRGF, ECF, and non-program country years. Comparing the mean growth differences for SAF participation years, none of the groups provides support for a statistically significant mean value from non-program country years. Same situation lies for the comparison between ESAF participation and
non-program participation. However, strong and statistically significant different mean growth rates are shown between PRGF participation and non-program country years across evaluation years. Although the sample size is small for ECF participation (only 36 observations), country years participating in ECF have a significantly different mean growth rate from non-participating country years across measured years except for one year after loan disbursement.
Graph 1 (below) plots the difference of average growth rate between each
program groups and non-program country years starting from the year t when the loan is disbursed to year t+3, three years after the loan disbursement. Overall, the result from two sample t-tests is optimistic. However, simply comparing the mean growth rate may be misleading, since various other factors may affect the growth rate outside of IMF programs. Therefore, we proceed to regression analysis.
-0.893* -1.060* -1.034* -0.469 0.270 -0.113 0.374 0.574 1.779*** 1.413*** 1.330*** 1.802*** 1.447** 0.250 2.060*** 2.464*** t t+1 t+2 t+3 Graph 1 Graph 1 Graph 1
Graph 1 –––– Average Growth Rate Difference Compared to NonAverage Growth Rate Difference Compared to NonAverage Growth Rate Difference Compared to Non-Average Growth Rate Difference Compared to Non-- -Program Country Years Across Years
Program Country Years Across YearsProgram Country Years Across Years Program Country Years Across Years
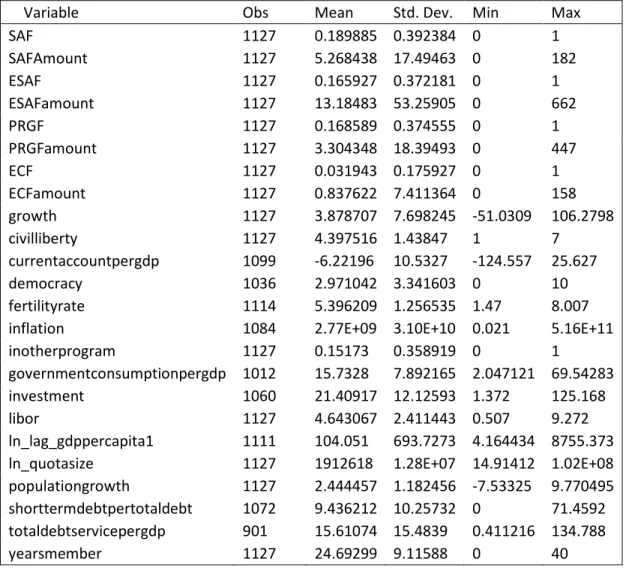
Table 1 – Descriptive Statistics
Variable Obs Mean Std. Dev. Min Max
SAF 1127 0.189885 0.392384 0 1 SAFAmount 1127 5.268438 17.49463 0 182 ESAF 1127 0.165927 0.372181 0 1 ESAFamount 1127 13.18483 53.25905 0 662 PRGF 1127 0.168589 0.374555 0 1 PRGFamount 1127 3.304348 18.39493 0 447 ECF 1127 0.031943 0.175927 0 1 ECFamount 1127 0.837622 7.411364 0 158 growth 1127 3.878707 7.698245 -51.0309 106.2798 civilliberty 1127 4.397516 1.43847 1 7 currentaccountpergdp 1099 -6.22196 10.5327 -124.557 25.627 democracy 1036 2.971042 3.341603 0 10 fertilityrate 1114 5.396209 1.256535 1.47 8.007
inflation 1084 2.77E+09 3.10E+10 0.021 5.16E+11
inotherprogram 1127 0.15173 0.358919 0 1
governmentconsumptionpergdp 1012 15.7328 7.892165 2.047121 69.54283
investment 1060 21.40917 12.12593 1.372 125.168
libor 1127 4.643067 2.411443 0.507 9.272
ln_lag_gdppercapita1 1111 104.051 693.7273 4.164434 8755.373
ln_quotasize 1127 1912618 1.28E+07 14.91412 1.02E+08
populationgrowth 1127 2.444457 1.182456 -7.53325 9.770495
shorttermdebtpertotaldebt 1072 9.436212 10.25732 0 71.4592
totaldebtservicepergdp 901 15.61074 15.4839 0.411216 134.788
Table 2 Two-sample t test with unequal variances testing mean growth
not in structural
adjustment program in SAF in ESAF in PRGF in ECF growth in the current year mean 3.623 2.73 3.892 5.402 5.07 std. 8.546 6.87 7.354 4.457 3.57 mean difference 0.893 -0.27 -1.779*** -1.447** t-stats 1.53 -0.426 -3.7556 -2.102 growth one year after mean 3.921 2.861 3.808 5.334 4.171 std. 8.499 8.394 7.589 4.351 4.032 mean difference 1.06 0.113 -1.413*** -0.250 t-stats 1.583 0.172 -3.025 -0.331 growth two years after mean 3.947 2.913 4.321 5.277 6.007 std. 8.239 8.764 7.982 4.187 4.139 mean difference 1.034 -0.374 -1.33*** -2.06*** t-stats 1.508 -0.556 -2.946 -2.689 growth three years after mean 3.799 3.33 4.373 5.601 6.264 std. 8.199 9.136 8.051 4.04 1.863 mean difference 0.469 -0.574 -1.902*** -2.464*** t-stats 0.663 -0.849 -4.067 -5.42 n 609 214 187 190 36
VII. Main Regression Results
To further examine the theories and arguments as developed in previous sections, and to examine the hypothesis of growth impact from participating in a longer-term structural adjustment program, this section provides regression analysis to assist explanation.
A. Determinants of Program Participation and Loan Disbursement
Before examining the growth effect of each program, I start with regressions looking for what determines a country’s program participation and what determines the level of loan disbursement. As presented in the theoretical framework and hypothesis section, the effect of IMF loan programs on country’s welfare depends on the incumbent government’s decision, which further results from the bargaining process between the IMF and the incumbent government. The bargaining process determines whether the government accepts conditions imposed by the IMF along with the loan. Therefore, apart from its direct result, the factors determining program participation also serves an
important role in screening for selection variables. After the loan approval, the level of loan distribution also relies upon multifarious factors, ranging from the global market, compliance with the conditionality of the borrowing country, and the bargaining power between the IMF and the incumbent government.
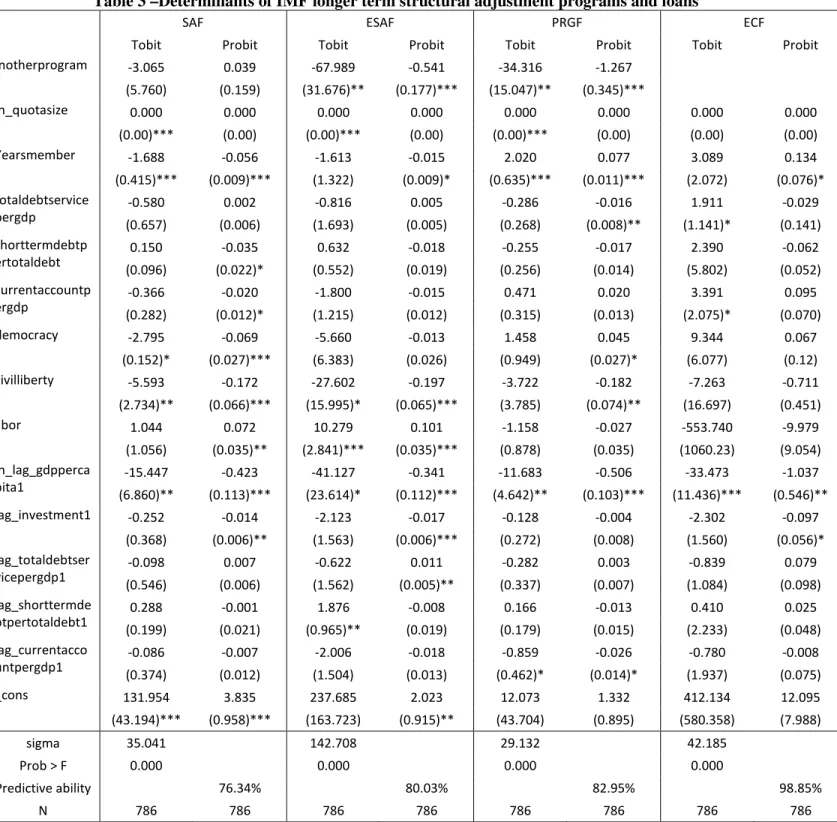
Table 3 (below) presents regression results for determinants of IMF longer-term structural adjustment program participation and level of loan disbursement. For each program, I used the tobit regression with error term clustered by country and robust adjusted to examine determinants for loan disbursement amount, and the probit regression to examine the program participation.
The negative coefficient for inotherprogram for ESAF and PRGF participations and loan disbursements are statistically significant. It suggests that if a country is in other IMF programs during the year, it is likely that it is not going to participate in the longer-term structural adjustment program. The variable inotherprograms includes short-term
facilities, primarily SBAs and EFFs, dealing with short term balance of payment crisis. When countries running into short-term balance of payment problems, they are likely to adjust immediate severe short-term problems first before adjusting longer term structural problems, therefore, they are not likely to enter a structural adjustment program. Having already been in a short-term program, the country has subjected to much conditionality. It is less likely for a country to accept more conditionality and lose its authority and policy freedom. Years of membership has a positive relationship on PRGF and ECF
participation, but a negative relationship on SAF and ESAF participation. We would expect that the longer a country is in the IMF, the more likely it is to accept help from the IMF, and the more evidence the IMF has to justify the loan disbursement. However, it may also be true that the longer a country is in the IMF membership, the more requests it is likely to bring up, hence it is less likely for it to receive the approval. The quota remain might also be limited due to overdraft. Democracy and civil liberty index are found statistically significant across regressions. Previous literature provides evidence that a more liberal and democratic country tends to resemble the IMF’s dominant political ideology, hence is more prone to the IMF programs, and hence the IMF programs are more keen to offer help. However, the more democratic government may be less prone to ask the IMF for help. LIBOR rate is an index for global financial market. The higher it reaches, the more expensive it is for the IMF to disburse its loans. Interestingly, it is only found positively correlated to SAF and ESAF program participation. The negative
coefficients of the lagged one year GDP per capita on the all program participation probit and loan disbursement tobit regressions show that countries with worse initial economic situation tend to participate in a program. And the worse the initial situation, the more
money the IMF is likely to disburse through the loan. All else being equal, a more developed economy has more domestic resources; hence it is less likely for them to borrow from the IMF. This shows, again, the endogeneity issue between program
participation and economic condition. The current year account balance situations tend to have a negative relationship to SAF program participation and positive relationship to ECF disbursement. We may expect that the higher debt service, the more likely a country is running into balance of payment and associated issues; and is therefore in need of structural adjustment assistance from the IMF. However, countries tend to regard the IMF as the last lending resort. The increase of current year debt may imply a country’s ability to garner resource from other parties. It is possible that countries having other borrowing channels would be less likely to participate in the IMF program.
Table 3 –Determinants of IMF longer term structural adjustment programs and loans
SAF ESAF PRGF ECF
Tobit Probit Tobit Probit Tobit Probit Tobit Probit
Inotherprogram -3.065 0.039 -67.989 -0.541 -34.316 -1.267 (5.760) (0.159) (31.676)** (0.177)*** (15.047)** (0.345)*** ln_quotasize 0.000 0.000 0.000 0.000 0.000 0.000 0.000 0.000 (0.00)*** (0.00) (0.00)*** (0.00) (0.00)*** (0.00) (0.00) (0.00) Yearsmember -1.688 -0.056 -1.613 -0.015 2.020 0.077 3.089 0.134 (0.415)*** (0.009)*** (1.322) (0.009)* (0.635)*** (0.011)*** (2.072) (0.076)* totaldebtservice pergdp -0.580 0.002 -0.816 0.005 -0.286 -0.016 1.911 -0.029 (0.657) (0.006) (1.693) (0.005) (0.268) (0.008)** (1.141)* (0.141) shorttermdebtp ertotaldebt 0.150 -0.035 0.632 -0.018 -0.255 -0.017 2.390 -0.062 (0.096) (0.022)* (0.552) (0.019) (0.256) (0.014) (5.802) (0.052) currentaccountp ergdp -0.366 -0.020 -1.800 -0.015 0.471 0.020 3.391 0.095 (0.282) (0.012)* (1.215) (0.012) (0.315) (0.013) (2.075)* (0.070) democracy -2.795 -0.069 -5.660 -0.013 1.458 0.045 9.344 0.067 (0.152)* (0.027)*** (6.383) (0.026) (0.949) (0.027)* (6.077) (0.12) civilliberty -5.593 -0.172 -27.602 -0.197 -3.722 -0.182 -7.263 -0.711 (2.734)** (0.066)*** (15.995)* (0.065)*** (3.785) (0.074)** (16.697) (0.451) libor 1.044 0.072 10.279 0.101 -1.158 -0.027 -553.740 -9.979 (1.056) (0.035)** (2.841)*** (0.035)*** (0.878) (0.035) (1060.23) (9.054) ln_lag_gdpperca pita1 -15.447 -0.423 -41.127 -0.341 -11.683 -0.506 -33.473 -1.037 (6.860)** (0.113)*** (23.614)* (0.112)*** (4.642)** (0.103)*** (11.436)*** (0.546)** lag_investment1 -0.252 -0.014 -2.123 -0.017 -0.128 -0.004 -2.302 -0.097 (0.368) (0.006)** (1.563) (0.006)*** (0.272) (0.008) (1.560) (0.056)* lag_totaldebtser vicepergdp1 -0.098 0.007 -0.622 0.011 -0.282 0.003 -0.839 0.079 (0.546) (0.006) (1.562) (0.005)** (0.337) (0.007) (1.084) (0.098) lag_shorttermde btpertotaldebt1 0.288 -0.001 1.876 -0.008 0.166 -0.013 0.410 0.025 (0.199) (0.021) (0.965)** (0.019) (0.179) (0.015) (2.233) (0.048) lag_currentacco untpergdp1 -0.086 -0.007 -2.006 -0.018 -0.859 -0.026 -0.780 -0.008 (0.374) (0.012) (1.504) (0.013) (0.462)* (0.014)* (1.937) (0.075) _cons 131.954 3.835 237.685 2.023 12.073 1.332 412.134 12.095 (43.194)*** (0.958)*** (163.723) (0.915)** (43.704) (0.895) (580.358) (7.988) sigma 35.041 142.708 29.132 42.185 Prob > F 0.000 0.000 0.000 0.000 Predictive ability 76.34% 80.03% 82.95% 98.85% N 786 786 786 786 786 786 786 786
B. Growth Effect
After examining the IMF longer-term structural adjustment program participation and loan disbursement, we can proceed to the regression of the effect of these structural adjustment programs on growth. This paper borrows the growth regression variable specification from Dreher (2006); however, I not only look at immediate growth effect from the IMF longer term structural adjustment programs for the year loans are
disbursed, i.e. used, but also the growth effect one year after, two years after, and three years after. Therefore, I employ four sets of regressions. Each set of regressions include two specifications. Specification 1 only takes into account whether a country year is in any of the structural adjustment programs. Specification 2 only looks at the amount of each structural adjustment programs.
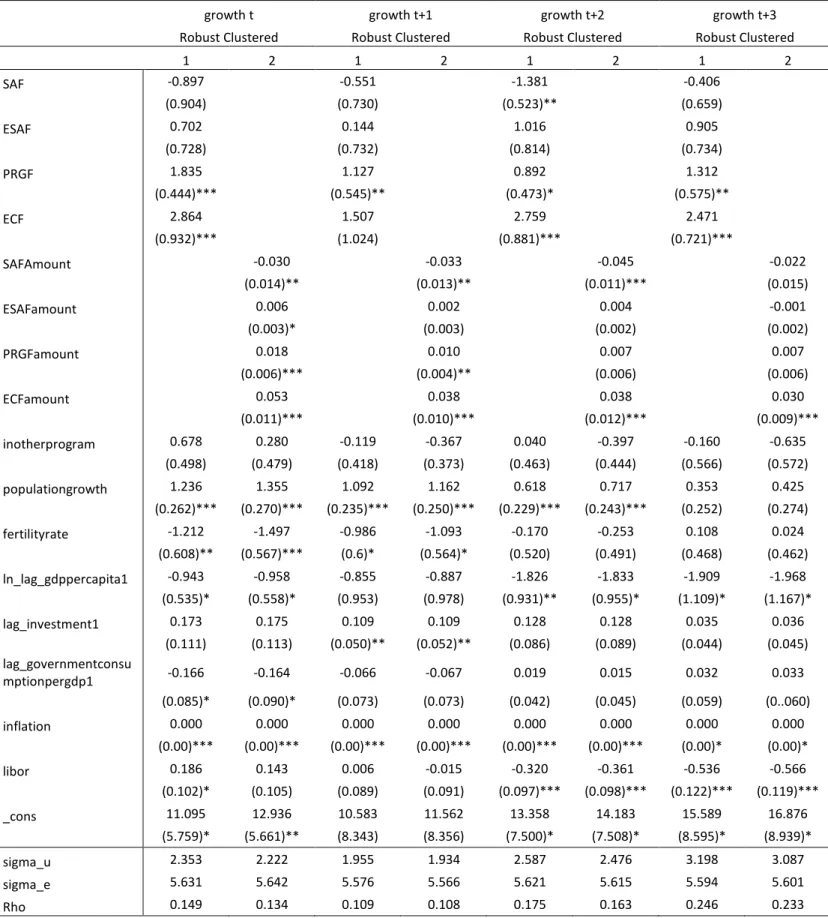
Table 4 (below) presents the fixed effect regression results for the impact of longer-term structural adjustment program on growth across years. According to results from Specification 1, for SAF, the first longer-term structural adjustment program, it has a consistent negative effect on growth starting from its immediate disbursement;
however, the negative effect is only statistically significant at two years after loan
disbursement. Participating in a SAF is expected to decrease growth by 1.381 percentage points two years after the loan disbursement, holding other things constant. For the second structural adjustment program, ESAF, unfortunately, it does not present any statistically significant relationship to growth across years, although the effects are seen positive. These results correspond to the critics from previous research, such as The Meltzer Commission on the effectiveness of IMF structural adjustment programs.
Starting 1999, the IMF initiated a series of program adjustment and began to “streamline” its conditionality, which then produced the PRGF. Indeed, according to the regression results, participating in PRGF has shown a steadier and statistically significant growth effect across years. Involving in a PRGF is expected to improve growth of the immediate year by 1.835 percentage points, ceteris paribus; is expected to improve growth the next year by 1.127 percentage points, ceteris paribus; 0.892 percentage points two years after, ceteris paribus; and 1.312 percentage points on growth three years after,
ceteris paribus. In 2009, the IMF further streamlined its conditionality, aiming at having the participating country owning structural adjustment. Accordingly, it initiated the ECF to replace the PRGF. From the regression analysis, ECF, compared to PRGF, has a larger effect on growth across years; however, the effect on growth second year after does not shown significant. Participating in ECF is predicted to improve growth by 2.864
percentage points immediately, ceteris paribus; by 2.759 percentage points two years after the loan disbursement, ceteris paribus; and to improve growth by 2.471 percentage points three years after initial disbursement, ceteris paribus.
Proceeding to examine the effect of loan disbursement amount on growth, we look at Specification 2. Similar to results from Specification 1, SAF has shown a
statistically significant negative effect on growth. Holding everything else constant, from the year the loan is disbursed to two years after disbursement, each one million SDR disbursement from SAF account to a country is likely to retard growth by -0.03
percentage points, -0.033 percentage points, and -0.045 percentage points (the effect on the third year after disbursement is not statistically significant, hence not mentioning here). ESAF, again, does not present significant effect on growth. Although its effect on
year t0 is statistically significant, each million SDR of disbursement only improves growth by 0.006 percentage points. PRGF disbursement amount is seen statistically significantly correlated to growth only for the first two years. Each one million SDR disbursement from PRGF to a country improves through by 0.02 percentage points for the current year, and by 0.01 percentage points the next year, ceteris paribus.
Interestingly, ECF has only had an implementation of three years in the data set; its disbursement has shown strong statistically significant improvement on growth across years. All else equal, each one million SDR disbursement from ECF account is projected to improve growth by 0.053 percentage points in the immediate year, 0.038 percentage points the year after. For the two and three years after initial disbursement, it is expected to improve growth by 0.038 percentage points and 0.030 percentage points, ceteris paribus. Comparing the statistically significant coefficients between Specification 1 and 2 for each year for each program, we see that participation dummy variables often have a dramatically larger coefficient than disbursement amount variables. Reason behind may lead to the catalytic effect of joining an IMF structural adjustment program. Specification 2, loan disbursement amount for each program only measures the effect from each
million SDR disbursement on growth. However, dummy for participation in Specification 1 generically depicts the total participation effect, which may includes the effect from structural adjustment besides returns from loans, as well as the indicator effect for other private capital inflows that are not captured by the disbursement amount.
Bird and Mosley (2003) provides hypothesis that growth effect from compressing demand might provide J-curve result. In another words, short-term drawback and longer term growth. In the event that shorter term growth effect from SAF and ESAF don’t show
optimistic results, hence, I proceed to examine their longer-term growth effect. Applying the same fixed effect regression model, I use the growth rate eight, nine, ten years from initial disbursement. The detail table is presented in the Appendix, Table 5. The result turns out to be not material. None of the program variables (dummy for participation and disbursement amount) show a statistically significant impact on growth not only for SAF and ESAF, but also across programs, despite the IMF’s effort of modifying it through years.
Apart from the impact of structural adjustment programs on growth, some other variables also provide interesting and important feedbacks on growth from the fixed effect models. Populationgrowth shows a strong and statistically significant positive effect on growth across years (except three years afterwards). This variable implies a direct human capital accumulation, which contributes to growth; however, its effect losses significance in later years. Reasons associated with this effect are ambiguous. Seeing the population growth rate is the net of birth rate and death rate. We may see a longer life expectancy which leads to smaller death rate as the economy improves, which may also prolong working age, thus contributing to growth in the near years. However, the associated increase in birth rate associated may divert the labor productivity and dilute its effect in later years. Fertility rate is seen to have a strong and significant
negative impact on growth in the first two years, but disappears in the later two years. We may infer that better health conditions, which may relate to higher income and growth, lead to higher fertility rate. However, newborn babies require care, so more people may remain at home to care for the children and are not participating in production activities. The initial GDP per capita is found to be negatively related to growth (only not for the
year after the current year), and the magnitude of impact increases as well. According neoclassical economic growth theories, we may suspect a faster growth rate if a country comes from an inferior situation. And lastly, LIBOR rate has a positive relationship with growth rate in the current year, and a negative relationship with growth two years later, and three years later.
Table 4 –Effect of IMF longer-term structural lending programs on growth in 0, 1, 2, 3 years
growth t growth t+1 growth t+2 growth t+3
Robust Clustered Robust Clustered Robust Clustered Robust Clustered
1 2 1 2 1 2 1 2 SAF -0.897 -0.551 -1.381 -0.406 (0.904) (0.730) (0.523)** (0.659) ESAF 0.702 0.144 1.016 0.905 (0.728) (0.732) (0.814) (0.734) PRGF 1.835 1.127 0.892 1.312 (0.444)*** (0.545)** (0.473)* (0.575)** ECF 2.864 1.507 2.759 2.471 (0.932)*** (1.024) (0.881)*** (0.721)*** SAFAmount -0.030 -0.033 -0.045 -0.022 (0.014)** (0.013)** (0.011)*** (0.015) ESAFamount 0.006 0.002 0.004 -0.001 (0.003)* (0.003) (0.002) (0.002) PRGFamount 0.018 0.010 0.007 0.007 (0.006)*** (0.004)** (0.006) (0.006) ECFamount 0.053 0.038 0.038 0.030 (0.011)*** (0.010)*** (0.012)*** (0.009)*** inotherprogram 0.678 0.280 -0.119 -0.367 0.040 -0.397 -0.160 -0.635 (0.498) (0.479) (0.418) (0.373) (0.463) (0.444) (0.566) (0.572) populationgrowth 1.236 1.355 1.092 1.162 0.618 0.717 0.353 0.425 (0.262)*** (0.270)*** (0.235)*** (0.250)*** (0.229)*** (0.243)*** (0.252) (0.274) fertilityrate -1.212 -1.497 -0.986 -1.093 -0.170 -0.253 0.108 0.024 (0.608)** (0.567)*** (0.6)* (0.564)* (0.520) (0.491) (0.468) (0.462) ln_lag_gdppercapita1 -0.943 -0.958 -0.855 -0.887 -1.826 -1.833 -1.909 -1.968 (0.535)* (0.558)* (0.953) (0.978) (0.931)** (0.955)* (1.109)* (1.167)* lag_investment1 0.173 0.175 0.109 0.109 0.128 0.128 0.035 0.036 (0.111) (0.113) (0.050)** (0.052)** (0.086) (0.089) (0.044) (0.045) lag_governmentconsu mptionpergdp1 -0.166 -0.164 -0.066 -0.067 0.019 0.015 0.032 0.033 (0.085)* (0.090)* (0.073) (0.073) (0.042) (0.045) (0.059) (0..060) inflation 0.000 0.000 0.000 0.000 0.000 0.000 0.000 0.000 (0.00)*** (0.00)*** (0.00)*** (0.00)*** (0.00)*** (0.00)*** (0.00)* (0.00)* libor 0.186 0.143 0.006 -0.015 -0.320 -0.361 -0.536 -0.566 (0.102)* (0.105) (0.089) (0.091) (0.097)*** (0.098)*** (0.122)*** (0.119)*** _cons 11.095 12.936 10.583 11.562 13.358 14.183 15.589 16.876 (5.759)* (5.661)** (8.343) (8.356) (7.500)* (7.508)* (8.595)* (8.939)* sigma_u 2.353 2.222 1.955 1.934 2.587 2.476 3.198 3.087 sigma_e 5.631 5.642 5.576 5.566 5.621 5.615 5.594 5.601 Rho 0.149 0.134 0.109 0.108 0.175 0.163 0.246 0.233
VIII. Discussion
The graph below (Graph 2) plots the coefficients of participating in each loan programs from the fixed effect model across years. It provides a direct illustration of program effects. In summary, the regression analysis shows that longer term adjustment programs generally do have a statistically significant impact on growth rate in the Sub-Saharan region immediately or in the short term, especially for the recent programs after “streamlining”.
The IMF’s involvement in the structural adjustment often emphasizes on improving the economic infrastructure, which, therefore, puts aggregate demand
management at the center under the binding constraint of external financing. Facing the lackluster effect on growth from the programs, Bird and Mosely (2003) comments that such is the high cost from policy of compressing aggregate demand. They summarize the various discussions on the IMF policies by saying that to compress aggregate demand, the demand for demand for imports must be reduced and the current account balance of payments must be strengthened. Uncomfortable results of these approaches include oppressing investment in private sectors and government expenditure. The current account improvement now is often at the cost of its future deterioration. These results all tend to have adverse effect on growth, and are not favorable to the incumbent
government (Bird and Mosely, 2003). Such is the case in the earlier time structural adjustment, especially SAF. In the context of LICs, financial markets and tax system are often incomplete. This leads to bigger obstacles that monetary and fiscal policies and exchange rate adjustment policies are facing. Therefore, in order to alleviate political resilience, since PRGF, the IMF has tried to streamline its associated conditionality and
allow the country to take the ownership of a program. Hence, from the regression result, we see a significant improvement on growth impact from ESAF to PRGF. In ECF, the IMF has further strengthened the protection to social safety net, health and education expenditure, and tax regime reformation into its longer term structural adjustment package. This further diminishes the adjustment fictions, and supplements other core adjustment policies to ensure a more successful achievement.
-0.897 -0.551 -1.381** -0.406 0.702 0.144 1.016 0.905 1.835*** 1.127** 0.892* 1.312** 2.864*** 1.507 2.759*** 2.471*** t t+1 t+2 t+3 Graph 2 Graph 2 Graph 2
Graph 2 –––– Effect of LongerEffect of LongerEffect of LongerEffect of Longer----Term Structural Adjustment Term Structural Adjustment Term Structural Adjustment Term Structural Adjustment Programs on Growth Rate Across Years
Programs on Growth Rate Across YearsPrograms on Growth Rate Across Years Programs on Growth Rate Across Years
VIIII. Conclusion
Although numerous studies have targeted the IMF’s program effectiveness, limited research has been done to identify the effectiveness of specific types of program. Among the studies that categorize the impact from different types, most have been focused on IMF’s short-term lending programs on balance-of-payment. Although systematic empirical studies on IMF longer-term structural adjustment programs to low income countries have been missing, various criticisms have been questioning the validity of their existence. Therefore, it is time to gather more available data resources to evaluate the effectiveness of IMF’s longer-term structural adjustment programs and to provide evidence on whether the amendment of these programs has been positive.
Previously, because of the limit of data, for the limited study on structural adjustment programs, most researchers only evaluate whether a country was in a program. This study look the full time span of 25 years from 1986 to 2011 and selected 44 countries in the Sub-Saharan region to evaluate not only the participation effect, but also the level of loan disbursement of SAF, ESAF, PRGF, and ECF on growth. Due to data availability, I only measure the growth rate immediately after disbursement, one year after the disbursement, two years afterwards, and three years afterwards. Although not a perfect measurement, often times, the success of longer-term structural adjustment depends on short-term effect. Positive short-term effect provides leeway for further adjustment.
Prior to evaluating the growth effect, this paper also seeks to find variables determining the loan program participation and the loan amount disbursement. A set of
tobit regressions provide evidence on program loan disbursement and a set of probit regressions provide insight on program participation.
Two sample t-tests comparing the mean value of growth rate between program country years and non program country years corresponds to the regression analysis in terms of the general trend of the program impact on growth from the current year to three years later. However, the level of significance varies from methods to methods. Lastly, fixed effect models account for endogeneity issues providing a more convincing result on the impact of program participation and loan disbursement on growth.
In summary, through the history of the evolution of structural adjustment programs, the first longer term program, namely SAF created in 1986, had a negative growth impact on participating countries. Luckily, it was abandoned in the early 1990s. Instead, ESAF, the second longer term structural adjustment concessional financing program, which was enlarged in 1996, showed statistically insignificant positive effect on growth. In 1999, ESAF was “streamlined” and reformed to PRGF. Aiming at being more efficient and effective, after trimming much of attached conditionality, PRGF does have evidence of creating stronger growth effect than its predecessor, ESAF. In 2009, ECF replaced PRGF to provide medium term lending to low income countries with a stronger focus on priority spending and social safety net protection. Under the newly created Poverty Reduction and Growth Trust, ECF demonstrates a better improvement from PRGF. Although still in the limited years of implementation, ECF has shown much stronger positive effect on growth than any of the previous longer term structural
adjustment programs. However, as years go by, more data will be produced to support or reject this conclusion.
Due to limited time and data, there are deficiencies within this research. The loan disbursement variable is directly selected from the IMF Annual Report. In the reporting, timing was not precisely accounted. It does not specify when the loan is disbursed in different time of a fiscal year. This may provide bias in estimating the short term growth effect. For example, the effect of growth in the next year from receiving a loan in January the year before, must be essentially different from a loan disbursed in December the year before. As stated in previous sections, it is ideal to evaluate the effect of IMF structural adjustment programs in a long time span. However, due to data availability, long term effect could not be fully evaluated. In Appendix, I did regression on growth effect 8, 9 10 years later after the initial disbursement, however, the newer programs, PRGF and ECF, could not be fully accounted. It has been remarked that the World Bank has a significant effect on growth and poverty reduction in the Sub-Saharan region. The growth of the country maybe reflected from the IMF programs, as well as the World Bank programs. It would be ideal to find accountable variables to control for the World Bank’s impact. However, due to data limitation, I can only attribute it to the fixed effect, under the assumption of it being consistent over the years. Lastly, as I indicated in the methodology section, this paper chooses fixed effect regression to account for endogeneity. It is
effective only when the unobserved factors stay consistent and affect both growth and participation. But there is a directly mutual relationship between growth and
participation, which is relied upon a set of accurate instrument variable methods. Therefore, future research should improve upon these deficiencies and provide a more reliable and viable examination on the growth effect from the IMF longer-term structural adjustment programs.
Reference:
Arpac, O., Bird, G., & Mandilaras, A. (2008). Stop Interrupting: An Empirical Analysis of the Implementation of IMF Programs. World Development, 36(9), 1493-1513. Atoyan, R., & Conway, P. (2005). Evaluating the Impact of IMF Programs: A
Comparison of Matching and Instrumental-Variable Estimators. Review Of International Organizations, 1(2), 99-124.
Barro RJ. (1991). Economic Growth in a Cross Section of Countries. Quarterly Journal of Economics 106(2): 407–443.
Barro, R.J. and Lee, J. W. (2005) IMF programs: who is chosen and what are the effects.
Journal of Monetary Economics 52: 1245–1269.
Berg, A., & Krueger, A. (2008). Trade, Growth, and Poverty--A Selective Survey. In P. Collier, J. Gunning (Eds.) , Globalization and Poverty. Volume 1. What Has Happened? Volume 2. What Are the Channels of Transmission? Volume 3. Policy Responses. Volume 2 (pp. 173-216). Elgar Reference Collection. Globalization of the World Economy series, vol. 19. Cheltenham, U.K. and Northampton, Mass.: Elgar.
Bird, G. (2004) Growth, poverty and the IMF. Journal of International Development 16: 621–636.
Bird, G. (2007). The IMF: A Bird's Eye View of Its Role and Operations. Journal Of Economic Surveys, 21(4), 683-745.
Bird, G. and Mosley, P. (2003) Should the IMF discontinue its long-term lending role in developing countries? In G. Ranis, J.R. Vreeland and S. Kosack (eds),
Globalization and the Nation State: the Impact of the IMF and theWorld Bank
(pp. 387–403). London: Routledge.
Boockmann, B., & Dreher, A. (2003). The contribution of the IMF and the World Bank to economic freedom. European Journal of Political Economy,19(3), 633–649. Camdessus, M., (1990). Statement before the United Nations Economic and Social
Council in Geneva, July 11. IMF Survey 19 (15)., 235.
Cohen, D., & Soto, M. (2002). Why are Poor Countries Poor? A Message of Hope which Involves the Resolution of a Becker/Lucas Paradox.
Collier, P. (2006). African Growth: Why a 'Big Push'?. Journal Of African Economies, 15188-211.
Collier, P. (2007). The Bottom Billion: Why the Poorest Countries Are Failing and What Can Be Done About It. Oxford and New York:.