Dissertations, Theses, and Capstone Projects Graduate Center
2-2015
Essays On Real Estate Investment Trusts
Jiajin ChenGraduate Center, City University of New York
How does access to this work benefit you? Let us know!
Follow this and additional works at:https://academicworks.cuny.edu/gc_etdsPart of theFinance and Financial Management Commons
This Dissertation is brought to you by CUNY Academic Works. It has been accepted for inclusion in All Dissertations, Theses, and Capstone Projects by an authorized administrator of CUNY Academic Works. For more information, please contactdeposit@gc.cuny.edu.
Recommended Citation
Chen, Jiajin, "Essays On Real Estate Investment Trusts" (2015).CUNY Academic Works.
ESSAYS ON REAL ESTATE INVESTMENT TRUSTS
by JIAJIN CHEN
A dissertation submitted to the Graduate Faculty in Business in partial fulfillment of the
requirements for the degree of Doctor of Philosophy, The City University of New York
© 2015 JIAJIN CHEN All Rights Reserved
This manuscript has been read and accepted for the Graduate Faculty in Business in
satisfaction of the dissertation requirement for the degree of Doctor of Philosophy.
Date Professor Su Han Chan
Chair of Examining Committee
Date Professor Joseph B. Weintrop Executive Officer
Professor Ko Wang
Professor JianMing Ye Supervision Committee
ABSTRACT
ESSAYS ON REAL ESTATE INVESTMENT TRUSTS
by
JIAJIN CHEN
Adviser: Professor Suhan Chan
This dissertation is composed with two essays on real estate investment trusts. The first
chapter examines REIT IPOs initial-day, short-run and long-run performance using a large
sample of 370 REIT IPOs from four continents (14 different countries) during the 1996-2010
period. The result shows that (1) the newly-established REITs in other countries exhibit similar
initial-day return pattern as in the U.S., (2) the low initial-day return might be caused by the
fund-like structure of REITs together with the real estate assets they hold, (3) the slightly positive
initial-day return is offset by the poor performance in the 190-day days subsequent to the IPO,
and (4) the change in U.S. REIT IPO performance before and after 1990 is more likely due to a
change in the REIT structure than to the growing maturity of the REIT industry or an increase in
institutional investor participation in the REIT market.
The second chapter analyzes the announcement dates and market dates of 483 entry and
439 exit events of publicly-traded Real Estate Investment Trusts (REITs). The study finds that
changes in asset supply (via entries or exits of REITs) affect the stock returns of incumbent
REITs. Furthermore, the study partitions the sample based on the reasons for entries and exits as
well as REIT asset type and management style in order to disentangle alternative explanations for
the stock responses to the entry and exit events. The conclusion is that the stock responses
documented in this study cannot be explained by the signaling, changes in competitive
ACKNOWLEDGEMENTS
I wish to express my sincere appreciation to my dissertation Advisors, Professor Suhan Chan, and
Professor Ko Wang, for their consistent guidance, caring, encouragement and help on the way
going through my Ph.D. journey and finishing my dissertation. I am deeply indebted to them for
all their support.
I sincerely thank Professor Joseph Weintrop for his caring, support and guidance throughout my
doctoral studies. I am very grateful to my committee member, Professor Jianming Ye for his
invaluable comments and advice to my dissertation. I also wish to thank Professor Armen
Hovakimian and other professors at Baruch College for all that they have taught me in my
doctoral studies.
I also would like to thank Professor Rui Yao, Professor David Frame, Professor Mingming Qiu,
Professor Chamna Yoon in the Department of Real Estate, and Yalan Feng, Richard Herron,
Huajing Hu, Mariya Letin, Katarzyna Platt, Chih-Huei Su and all my fellow PhD students at
Baruch College for their support and friendship.
Finally, and most importantly, I would like to thank my husband, Soi Meng Tai, for his constant
support and standing by me all the time. I also thank my parents GuiYing Zhou, DaWei Chen and
TABLE OF CONTENTS
Chapter 1: Are REIT IPOs Unique? The Global Evidence ... 1
1. Introduction ... 1
2. Literature review and research issues ... 4
3. Global REIT market ... 9
3.1 REIT market for each country ... 10
3.2 A comparison of the main characteristics of REIT structure ... 15
4. Sample selection and description ... 16
4.1. Sample selection and data sources ... 17
4.2. Sample statistics ... 22
5. Methodologies... 25
5.1. Measuring initial-day returns ... 25
5.2. Measuring cumulative abnormal returns over 190 days ... 26
5.3. Measuring long-run performance over 3-year and 5-year periods ... 27
6. Empirical results ... 29
6.1. Initial-day returns ... 29
6.2. Cumulative abnormal returns over 190 days ... 35
6.3. Long-run performance over 3-year and 5-year periods ... 38
7. Conclusions ... 40
Chapter 2: Does A Firm’s Entry or Exit Affect Competitors’ Value? Evidence from The REIT industry ... 57
1. Introduction ... 57
2. Related literature ... 62
3. The use of REIT as a laboratory ... 65
4.1 The establishment of the list of REITs ... 67
4.2 Sample description ... 70
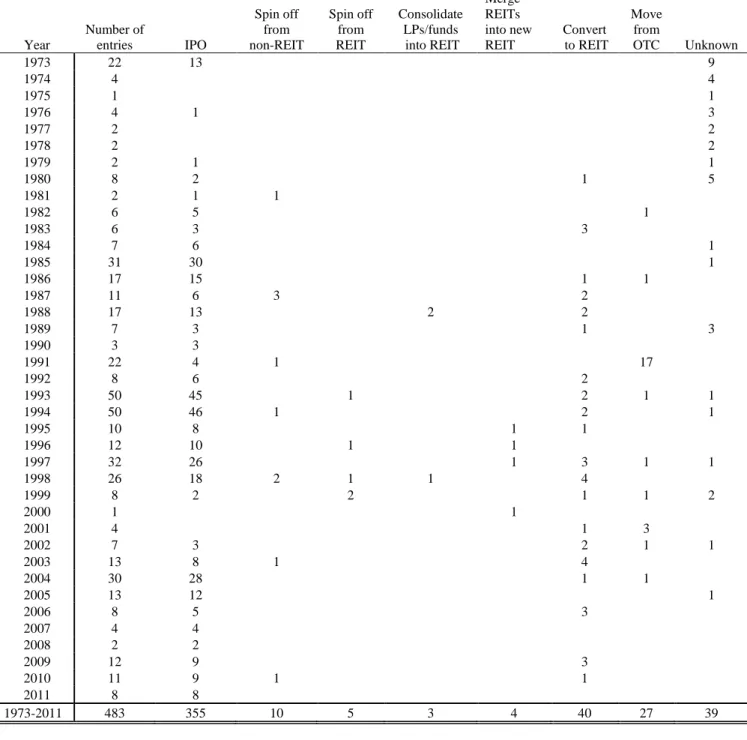
4.3 REIT entry types ... 73
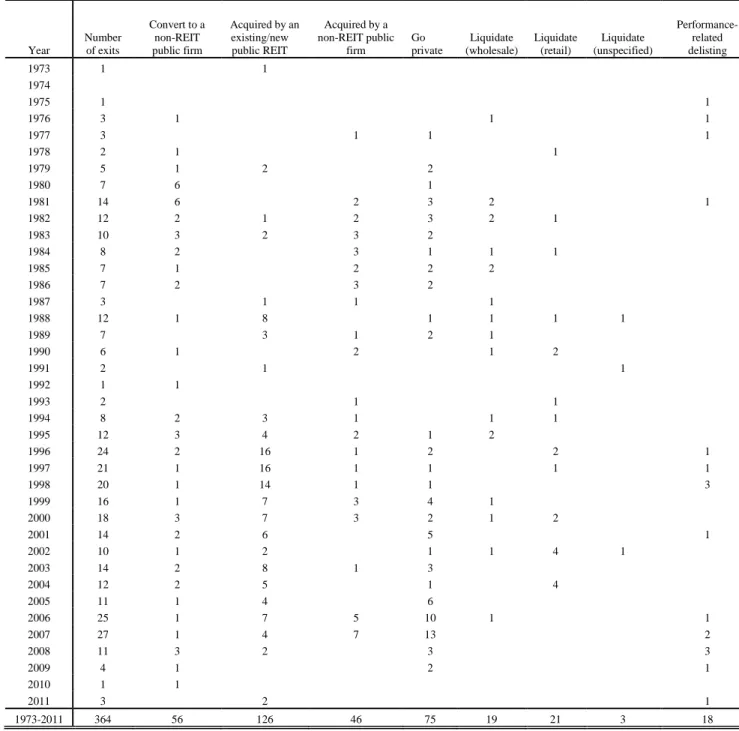
4.4 REIT exit types ... 74
5. Methodology ... 76
5.1 Assessing monthly stock price reaction of incumbent REITs using multivariate regression analysis ... 76
5.2 Assessing abnormal returns of incumbent REITs around event dates ... 78
5.3 Defining Full, Single, Pure entry and exit groups ... 80
6. Empirical results ... 81
6.1 Monthly stock price reaction of incumbent REITs to the change of REIT stock supply ... 82
6.2 Abnormal returns of incumbent REITs around event dates ... 83
6.3 Relationship between announcement and market dates ... 86
6.4 Reasons behind entry and exit events ... 88
6.5 Asset composition and management structure ... 91
6.6 Test on market timing effect ... 94
7. Conclusions ... 95
Appendices ... 117
Appendix I: Structure of Global REITs ... 118
Appendix II: Data collection procedure for U.S. REIT IPOs during the 1996-2010 period ... 120
Appendix III: Data collection procedure for Non-U.S. REIT IPOs during the 1996-2010 period ... 121
Appendix IV: Changes in the CRSP PERMNO of a publicly-traded REIT that enters (exits) the public REIT market via different modes of entry (exit) ... 122
Appendix V: Estimated betas for REIT portfolios by REIT asset type, advisor style and sub-period ... 123
Appendix VI: The effect of REIT entry and exit events on incumbent REITs’ stock risk-free excess returns. ... 124
LIST OF TABLES
Table 1.1: Summary of first-day returns and long-run returns of reits or property firms from
selected studies ... 42
Table 1.2: Mean institutional holdings of REIT stocks ... 44
Table 1.3: Number and issue size of REIT IPOs by country and region (1996-2010) ... 45
Table 1.4: Summary statistics of the raw and market-adjusted initial-day returns of REIT IPOs by country (1996-2010) ... 46
Table 1.5: Comparison of the average initial-day returns of REIT IPOs vs. non-REIT firm IPOs by country ... 47
Table 1.6: Average initial-day returns of REIT IPOs by region and by year (1996-2010) ... 48
Table 1.7: Univariate tests on the initial-day returns in the 1996–2010 Period... 49
Table 1.8: Mean initial-day return excluding the first REIT or a “Special” REIT ... 50
Table 1.9: Cumulative average abnormal daily returns (CARs) for selected intervals during the first 190 trading days after the initial public offerings of REITs around the globe in the 1996-2010 period ... 51
Table 1.10: Univariate tests on the 1-190 (2-190) days cumulative average abnormal daily returns (CARs) in the 1996–2010 period ... 52
Table 1.11: Factor regressions for REIT IPOs in their 3 years after going public ... 53
Table 1.12: Factor regressions for REIT IPOs in their 5 years after going public ... 55
Table 2.1: REIT versus stock entries and exits ... 97
Table 2.2: Distribution of REIT entries by entry types ... 98
Table 2.3: Distribution of REIT entries with announcement date information by entry types 99 Table 2.4: Distribution of REIT exits by exit types ... 100
Table 2.5: Distribution of REIT exits with announcement date information by exit types ... 101
Table 2.6: The effect of REIT entry and exit events on incumbent REITs’ market-adjusted stock returns... 102
Table 2.7: Cumulative abnormal returns of incumbent REITs around REIT entries and/or exit events ... 103
Table 2.8: Cumulative abnormal returns of incumbent REIT portfolios around market dates of REIT entry and exit events, without and with prior news announcements ... 104
Table 2.9: Relation between market date and announcement date abnormal returns of
incumbent REITs ... 105 Table 2.10: Cumulative abnormal returns of incumbent REITs around market dates for REIT
entry or exit events of full sample, by sample and event type ... 106 Table 2.11: Cumulative abnormal returns of incumbent REITs around market dates for REIT
entry or exit events of single sample, by event type ... 107 Table 2.12: Cumulative abnormal returns of incumbent REITs around market dates for REIT
entry or exit events of pure sample by event type ... 108 Table 2.13: Cumulative abnormal returns of incumbent REITs by asset type and advisor style for full sample ... 109 Table 2.14: Cumulative abnormal returns of incumbent REITs by asset type and advisor style for single sample ... 110 Table 2.15: Cumulative abnormal returns of incumbent REITs by asset type and advisor style for pure sample ... 111 Table 2.16: Cumulative abnormal returns of incumbent REITs around market dates for IPO
and non-IPO entries ... 112 Table 2.17: Cumulative abnormal returns of incumbent REIT portfolios around market dates
LIST OF FIGURES
Figure 2.1: Plot of the percentage of new (terminated) REITs versus new (delisted) stocks in each year during the 1962-2011 period ... 114 Figure 2.2: Plot of the number of REITs entering and exiting the market by month during the
1973-2011 period ... 115 Figure 2.3: Plot of the percentage of REIT IPOs (non-IPOs) entering the market by month
Chapter 1
Are REIT IPOs Unique? The Global
Evidence
1.
Introduction
One of the most puzzling phenomena in the finance literature is the pricing behavior
of initial public offerings (IPOs) of equity securities. For the U.S. industrial firm IPOs, Table
1 of Ritter (2012a) reports that the initial trading-day return of 7,617 IPOs issued during the
1980-2011 period is, on average, 17.9%. Table 18 of Ritter (2012b) reports that the average
3-year buy-and-hold market-adjusted return for the 7,433 IPOs issued during the 1980-2009
period is -19.9%.
While the IPOs of industrial firms consistently show a significant initial-day
underpricing, U.S. Real Estate Investment Trust (REIT) IPOs are different from that of U.S.
industrial firm IPOs. For example, Wang, Chan, and Gau (1992) show that U.S. REIT IPOs
in the pre-1990 period, on average, were significantly overpriced (-2.82%) while Ling and
Ryngaert (1997) find that REIT IPOs in the post-1990 period were significantly underpriced
(3.6%). The initial-day return of REIT IPOs is much lesser than that of industrial firm
return of REIT IPOs and the change in IPO pricing to the structure of REITs (fund-like and
externally advised in the pre-1990 versus operating-oriented and internally advised in the
post-1990) and to the level of institutional involvement in REITs (relatively low in the
pre-1990 period versus high in the post-pre-1990 period).
With overlapping sample periods, Hartzell, Kallberg, and Liu (2005) study the 189
REIT IPOs issued during the 1980-1998 period and report an insignificant 0.27% initial-day
return, while Buttimer, Hyland and Sanders (2005) find a significant 2.47% initial-day return
for the 163 REIT IPOs issued during the 1980-2001 period. Recently, however, Bairagi and
Dimovski (2011) report that, while the initial-day return of the 55 REITs issued during the
2002-2006 period is a significant 3.43%, the initial-day return of the 20 REITs issued during
the 2007-2010 period is an insignificant -1.19%. Panel A of Table 1.1 provides a summary of
the initial-day returns of U.S. REIT IPOs reported in the literature. Clearly, the results of the
studies vary by sample periods and by sample selection criteria.
In this study, we report that the mean initial-day return of the 323 U.S. REIT IPOs
during the 1971-2010 period is a significant 0.94%. It should be noted that the average
initial-day return of industrial firm IPOs during the 1980-2011 period is 17.9%. Clearly, regardless
of whether we compare the returns of sub-periods or the entire period, it is safe to conclude
that the average initial-day return of REIT IPOs is much lower than that of industrial firm
IPOs.
In addition, the evidence on the aftermarket performance of U.S. REIT IPOs is also
mixed. Wang, Chan and Gau (1992) find that pre-1990 REIT IPOs substantially
underperformed several benchmarks during the 190 trading days after issuance. This result is
consistent with the result reported by Ritter (2012b), where he finds that the average 3-year
period. However, Ling and Ryngaert (1997) subsequently find that equity REIT IPOs in the
1990s outperformed seasoned equity REITs moderately in the 100 trading days after issuance.
Buttimer, Hyland and Sanders (2005), using Fama-French type factor models, find that U.S.
REIT IPOs during the 1980-2001 period exhibit either no or positive abnormal returns in the
3 or 5 years after issuance. Recently, Joel-Carbonell and Rottke (2009) report that REIT IPOs
issued during the 1991-2008 period earn significantly lower accumulated market-adjusted
returns over longer intervals. They find that the one-year cumulative market-adjusted return
is -4.1%, three-year cumulative market-adjusted return is -8.3%, and five-year cumulative
market-adjusted return is -24.7%. Clearly, the results of longer-run performance differ
significantly among the REIT studies. However, since the objectives, methodologies and
sample periods of those REIT studies differ significantly, it is not feasible to make a
meaningful comparison of their results.
Given the different findings, it is necessary to examine both the initial-day return and
the long run performance of REIT IPOs under one model framework and over the same
sample period. More importantly, given the abnormal performance of U.S. REIT IPOs, it is
also necessary to see if this performance pattern holds true universally. This can be done by
examining the performance of REIT IPOs around the world. Previous studies report some
evidence on REIT IPOs from selected countries, but the evidence is scarce and random.
Panels B and C of Table 1.1 list the related studies. Recent establishments of REIT markets
in Asia and Europe provide this study a great opportunity to examine non-U.S. REIT IPOs in
a systematic way and provide results that will tell us if the U.S. REIT experience is unique, or
if the U.S. REIT experience is universally true. In addition, it might be interesting to know if
the lessons learnt from the U.S. REIT market during the past 40 years are followed by other
This study gathers 370 REIT IPOs from 14 different countries during the 1996-2010
period to analyze if the stock performance of REIT IPOs is systematically different from that
of industrial firms around the world. Since the REIT structure and regulatory requirements
differ across countries, we might be able to exploit cross-sectional variation in the initial-day
return to uncover some possible explanations for the low initial-day return we have observed
for U.S. REIT IPOs. Section 2 reviews the literature on IPO theories and studies on the
performance of international REIT IPOs. We also identify research issues in the field that are
related to REIT IPOs. Section 3 discusses the global REIT market and provides a brief
description of the REIT structure and regulatory environment in each county. Section 4
reports the data gathering procedure and summary statistics. Section 5 describes the
methodologies for calculating the REIT IPOs initial-day return, short-run as well as long-run
abnormal returns. Section 6 reports the empirical evidence. The last section concludes.
2.
Literature review and research issues
The literature on IPO tries to answer two questions. First, why do issuers (with the
aid of underwriters) offer new shares that are consistently underpriced and leave about 18%
of the capital on the table for aftermarket investors to pick up? Second, why do IPO firms
underperform the market over the long-run? The various answers to these two questions can
be divided roughly into the following groups.
There are several theoretical studies providing explanations for the IPOs underpricing.
The first group is the “winner’s curse” or “adverse selection” explanation. Rock’s (1986)
posits that due to information asymmetry between informed and uninformed investors and
information ex-ante uncertainty about firms’ value, informed investors always compete for
information. As compensation for the risk of trading against the informed investors and for
receiving a disproportional number of “good” issues, underwriters underprice new issues on average to counteract the winner’s curse and attract the average investors in equilibrium. Based on “winner curse” explanation, the increased informed investors (institutional investors) participation in subscribing REIT stocks will be associated with increased
underpricing level for IPOs.
The second group is “signaling” model according to the basic assumption that issuers
have superior information than investors. The firms know their prospects. (See, for example,
Allen and Faulhaber (1989) and Welch (1989)). Therefore, the issuers rationally price IPOs
below their market value in order to signal their firm type, and investors can distinguish the
firm type because they know only the best firms can recoup the cost of revealing information
from subsequent issues.
The third group of explanations is “principal-agent” model which based on the
assumption that underwriters have superior information about the demand of IPOs than
issuers. Baron (1982) focuses on potential agency problem between investment bank and
issuing firm. The model assumes that underwriters have (1) superior information about the
demand for the new shares over issuers and (2) their marketing efforts are unobservable or
verifiable by the issues so that issuers rationally let underwriters underprice the IPO.
Recently, more emphases are placed on the agency problems between underwriters and
issuers by examining issues such as (1) the allocation strategies used by underwriters, (2) the
possibility that IPO investors are deceived by analysts’ aggressive growth forecasts, and (3) the monopoly power enjoyed by underwriters. (For a list of representative papers in this area,
see Loughran and Ritter (2002), Bradley, Jordan and Ritter (2008), Edwards and Hanley
With regards to the underpricing level, prior evidence suggest that IPOs are more
underpriced when they are underwritten by investment banks with lower prestige. Beatty and
Ritter (1986) offer the standard explanation for this behavior, which is that prestigious
underwriters maintain their reputation by “producing” the firms they underwrite. Prestigious
underwriters obtain a higher offering price for the IPO, in part by managing IPOs with a low
variance of possible firm values. By agreeing to be associated with an offering, prestigious
underwriters “certify” the quality of the issue.
Carter and Manaster (1990) provide a ranking of underwriters based on their position
following the completion of IPOs. Megginson and Weiss (1991) measure underwriters’ reputation using market shares. The results from these empirical works are typically not very
sensitive to the choice of underwriter reputation measure.
Another group of explanation includes the “hot market” theories, which state that the issues are fairly valued but investors are irrational and those investors who purchase shares
on the first day of trading of the IPO stocks pay too much for the shares. The model assumes
that the IPOs are fairly priced but investors are irrational. Therefore, the investors might pay
too much for the IPO shares on the first day of trading and in the longer-run price decline to
restore rationality. (See, for example, Loughran, Ritter and Rydqvist (1994) and Ljungqvist,
Nanda and Singh (2003)).
While the aforementioned explanations are suitable for analyzing IPOs with large
positive initial-day return, they might not be suitable for REIT IPOs because the initial-day
returns of REIT IPOs are either negative or low in magnitude.
Chan, Stohs and Wang (2001) examine whether the underlying real estate holdings
might explain the observed low initial-day return for REITs IPOs. They study the Hong
with that of non-real estate related firms’ IPOs. The result suggests that the underlying real
estate holding alone does not explain the observed low-initial-day returns for REIT IPOs and
suggests that the impact of the fund-like structure on REIT IPOs should be re-examined.
Chan, Wang and Yang (2009) provide a model explaining why REIT IPOs can be
overpriced or slightly underpriced. Their model suggests that the IPO offering price increases
in the deadweight costs if an IPO fails. For a firm with significant amounts of tangible assets,
it will have less incentive to reduce its offering price because the firm may be able to sell its
assets to the market at a price similar to its IPO price if the IPO fails. On the other hand, a
firm with significant intangible assets will want to set its IPO at a low price to avoid a failure
because the deadweight costs are high for these firms. Their model implications are very
suitable for explaining the REIT IPO patterns. Before 1990, U.S. REITs have a fund-like
structure, and the deadweight costs for a failed IPO are quite small. Therefore, the firm will
price its IPO close to or above its perceived intrinsic value, which leads to IPO overpricing.
After 1990, U.S. REITs changed their structure from a traditional fund-like trust to one with
an operational component. Management became the intangible assets of firm value.
Therefore, the deadweight cost for the new REITs increased and REIT IPOs changed from
being fairly priced or overpriced to being underpriced.
To date, only a handful of studies have examined the pricing and/or performance of
REIT (or REIT equivalent) IPOs in countries outside of the U.S., namely, Canada, Australia,
Japan, Singapore, Malaysia, Hong Kong, and the U.K. Panels A (last line), B and C of Table
1.1 provide a summary of the findings on REIT IPOs conducted for Canada, countries in the
Asia-Pacific, and Europe, respectively. For example, Londerville (2002) examines 13
Canadian REIT IPOs during the 1993-1998 period, Dimovski and Brooks (2006a and 2006b)
study 37 and 58 Australian LPT IPOs in the 1994-1999 and 1994-2004 periods, respectively,
Brooks (2008) study 40 Japanese REIT IPOs during the 2001-2006 period, Wong, Ong and
Ooi (2013) examine a total of 78 REIT IPOs from several Asian countries in the 2001-2008
period, and Sahi and Lee (2001) examine 26 U.K. property investment companies
(considered as REIT equivalents) going public during the 1986-1995 period.
In general, these studies find relatively low (when compared to industrial firm IPOs in
the same market) and sometimes insignificant positive returns on the first trading day.
However, the initial-day return is, in general, positive. In Australia, the first-trading day
return is found to be insignificant in the pre-2000 period but positive and significant in the
post-2000 period. There are also a handful of studies that examine the IPO performance of
property companies (Gerbich, Levis and Venmore-Rowland (1995), Sahi and Lee (2001),
Chan, Stohs and Wang (2001), Brounen and Eichholtz (2001, 2002), and Freybote, Rottke
and Schiereck (2008)). These studies, in general, find that the IPOs of property companies
are more positive and significant on the first-trading day than the IPOs of REITs. However,
since the time periods and sample selection criteria differ significantly amongst those studies,
it is difficult to draw concrete conclusions by reviewing the evidence.
At this moment, however, previous researchers only verify the different theoretical
justifications focusing on REIT IPOs performance in one country. This can only be done by
comparing changes in REIT IPO initial-day returns with changes in REIT structure or
characteristics over time to draw inferences. In other words, we would only have the
time-series variation in REIT IPO initial-day returns. As we already know, the result of this
approach is not very fruitful. A systematic examination of recently established REIT markets
in different countries might be able to show if the low or negative initial-day returns of REIT
IPOs are universally true. Since the management style and the level of institutional investor
participation in REITs vary by country, we might gain some evidence on whether the
cross-sectional variations in REIT initial-day returns.
We would expect that the IPOs of REITs that are passive or fund-like (such as those
in Taiwan, Thailand, and the CR-REITs in South Korea) to be fairly priced as the deadweight
costs of a failed IPO for such type of REITs are quite small. We would also expect REITs
that are externally managed (such as those in most Asia-Pacific countries, with the exception
of stapled REITs in Australia and K-REITs in South Korea) to exhibit lower initial-day
returns when compared with internally managed REITs (such as stapled REITs in Australia,
K-REITs in South Korea, Turkey, Belgium, France, U.K., Canada and the U.S.) where the
deadweight cost of a failed IPO is higher.
As mentioned in Section 1, the results of U.S. REIT IPO long-run performance differ
significantly among the U.S. REIT IPO studies. Furthermore, it is fair to say that most of the
evidence on REIT IPO aftermarket performance is inconsistent with the -19.9% 3-year
market adjusted buy-and-hold returns for industrial firm IPOs, as reported by Ritter (2012b).
As previously noted, a meaningful comparison of the results in prior studies is not feasible
due to the differing objectives, methodologies, sample selection criteria and sample periods
used. As such, there seems to be a need to study the long-run performance of all REIT IPOs
available worldwide under one model framework and one sample period to find a more
conclusive evidence. This is another motivation for this study.
3.
Global REIT market
This section provides a brief description of the REIT structure and regulatory
3.1 REIT market for each country
While the REIT industries in the U.S. and Australia date back to the early 1960s and
1971, respectively, the development of the REIT markets in Asia, Canada and Europe only
started in the recent two decades. Although REITs in the other countries are basically
following the American (tax) structure that the REITs can obtain a tax-exempt status if they
satisfy a set of requirements such as distributing 90% of their free cash flows to shareholders,
most countries regulate their own REIT or REIT-like structure.
Appendix I provides a summary and comparison of the structure and requirements of
the REIT regimes around the globe that we gathered for this study. Data sources for
Appendix I include NAREIT issues (for U.S. REITs), CBRE 2010 research report (for Asian
REITs), EPRA 2010 report (for Australia, Asia, Europe and North America REITs), Ernst &
Young Global Real Estate Investment Trust Report (2010), Real Estate Securitization
Handbook (2005), Real Estate Investment Trusts: A Global Analysis (2006), and
PricewaterhouseCoopers Worldwide REIT Regimes 2007 report covering Australia, North
America, and several countries in Europe as well as Asia. Appendix I shows the year in
which the first REIT IPO takes place in each country and compares the management structure
(externally versus internally managed), as well as asset, financial and operating requirements
of the REITs across the globe. It is noteworthy that many of these regimes are still evolving
in terms of regulatory requirements, ownership and structure. This means that the information
provided in this table is time sensitive and should be updated very frequently. For example,
the Malaysian government's liberalization of its regulation of foreign ownership and
shareholdings in M-REITs in 2009 (see CBRE 2009 research report).
Australian Real Estate Investment Trusts which were known named as Listed
Property Trusts (LPTs) have a long history. The first Australian LPT was launched on the
were renamed Australian Real Estate Investment Trusts (A-REITs) in line with international
practice.
The development of REIT industry in Asia market only started from 2001.1 The first
REIT of Asia emerged in Japan market and listed on Tokyo stock exchange in 2001. After
that, REITs industry in the Asia-Pacific market experienced tremendous growth. Six
countries (South Korea, Singapore, Thailand, Taiwan, Malaysia, Hong Kong) have
introduced REIT structures rules and launched REIT IPOs on their major stock exchange
markets.
With regards to REITs in Japan, Seki (2006) describes that although Investment trust
Act of Japan provided the creation of both investment trusts (contract-type investment trust)
and investment corporations (company-type investment trust), all of the current listed
J-REITs are structured as investment corporations. J-J-REITs must apply external management
for their assets. Therefore, an investment corporation is formed for the purpose of managing
assets by investing in specified assets. An investment corporation entrusts its asset
management to an investment trust management company. For example Nippon Fund
Building management Ltd is the asset management company of Nippon Building Fund, the
first and largest Japanese REITs. According to Appendix I, we notice that similar to
Australia, there is no restriction on leverage ratio for J-REITs, therefore the investment
corporation could expand their assets by raising loans as much as they can. Moreover, in May
2008, Tokyo Stock Exchange (TSE) has amended its listing regulation that an inclusion of
overseas real estate to the portfolio of J-REIT funds is liberated by law. This change means
Japanese Capital is legally permitted to invest in overseas by real estate securitization
scheme.
REITs in South Korea can be structured as Corporate Restructuring REITs
(CR-REITs) or organized as ordinary REITs (K-(CR-REITs) in the market. CR-REITs are corporate
restructurings involving external management, limited life and favorable tax provisions.
During the limited life of CR-REITs, they were not allowed to issue secondary units/share to
the market. In 2002, Korea established its first Corporate Restructuring REITs (CR-REITs)
on the Korean Stock Exchange. Different from CR-REITs, K-REITs are internally managed
commercial real estate REITs without tax flow-through provision. Due to no tax benefit, no
K-REIT was formed at the beginning. The legislation was amended in April 2005. It
effectively extends the tax transparency status to K-REITs and initial capitalization
restrictions, which makes it easy to structure K-REITs. However, neither K-REIT or
CR-REIT could borrow to fund new investment which is a serious impediment to growth. In June
of 2007, the Real Estate Investment Trust Act in South Korea was amended again. The new
Law raised the borrowing rate from 200% of equity to 1000%.
The guidelines for the establishment of real estate funds of Singapore were first
released by the Monetary Authority of Singapore (MAS) in May 1999. In June 2005, the
Monetary Authority of Singapore announced the changes to the REIT framework, which
involves including raising the current 35% borrowing limit to 60%. The condition for tax
transparency granted to S-REITs was also changed in December 2002 by reducing the
income distribution requirement from 100% to not less than 90%. To sustain the growth in
the S-REIT market, in 2005, the Singapore government further announced the waiver of
stamp duties for properties acquired by REITs over a period of five years. Similar to Japan,
Singapore also provided for the creation of both investment trusts and investment
corporations and S-REIT must be implemented by external management. In addition, most of
S-REIT are open-end fund that they could offer secondary shares or units for acquisition real
REITs exist as Property Funds for Public Offering (PFPO) in Thailand. They were
established as a recovery vehicle for the 1997 financial crisis. However the Thai PFPO code
is more rigid than the other REIT regulations compared to the U.S market. Asian REIT
Market overview 2007 report published by AME capital says that Thai REITs cannot hold
debt more than 10% of its asset, which hampers its acquisition for newly developed
properties. Another important characteristic of Thai REITs is that they are built with close
mutual fund type and could not issue units in the future for growth purpose.
Taiwan government approved REIT in 2003 and created its first REIT in March 2005.
Taiwan REITs are similar to REITs in other countries, involving raising funds first and then
acquiring real estate objectives. However, Taiwan only allows the operation type of
investment trust (contract-type investment trust) instead of the investment corporation type
(company-type investment trust). In addition, Lin (2007) describes that Taiwan REITs
growth is limited because REITs in Taiwan are usually be structured as closed-ends, which
means that the number of units is restricted to what was issued at the initial offering and they
were not allowed to issue new shares in order to raise funds to buy new property at the
original fund level.
While Malaysia introduced its first Property Trust on Kuala Lumpur Stock Exchange
in 1989, the Trusts were not granted tax transparency and lacked focusing on asset
management. These trusts were not popular within the institutional investors. Most of them
were eventually taken private. In early 2005, Malaysia government liberalized its REIT
framework. The revision includes granting tax transparency status to the trust and liberalizing
the trust’s borrowing limits to 35% of asset value. Under the new guidelines, the property fund were also be renamed to M-REITs and the first REIT was listed under the new REIT
guidelines in August 2005. Most of M-REITs are structured to be open-ended. CBRE
announced the liberalization of Foreign Investment Committee (FIC) guidelines for property
purchases by foreigners, removal of the 30% Bumiputra equity condition in public-listed
companies, and the allowance of 100% foreign ownership in fund management companies.
The new guidelines are expected to spur interest on the part of foreign and local institutional
property funds and REITs in coming into the market within the short-term future.
Hong Kong launched Link REIT, the first HK-REIT and the largest REIT IPO in the
world in November 2005. All the current listed HK-REITs are open-ended fund that they
could issue secondary units/shares for acquisition properties that enhance existing rental
yields for growth purpose. Different from the U.S. REITs and Australia LPT, HK-REITs
would not receive any tax transparency.
In Europe, Turkey established its REIT regimes in 1995. But the first public listing on
the Turkish Stock Exchange was in 1997. REITs in Turkey are corporate type using internal
management unit to manage their assets.
The Belgium enacted the REIT regime known as the SICAFI in 1995. REITs in
Belgium are corporate type with internal management. Belgian legislation requires that the
aggregate loans do not exceed 65% of the total assets. Furthermore, the annual interest costs
may not exceed 80% of the total annuals profits.
France introduced REITs in 2003 to allow listed real estate firms to elect to convert to
a REIT in order to benefit from a French corporate tax exemption. Besides these conversions,
there are also property firms that launch as newly created REITs via initial public offerings.
The French SIIC regime does not provide specific leverage restrictions.
Similarly, when the U.K. established its REIT regime in 2007, a number of property
investment companies (PICs) that hold a similar commercial property portfolio to REITs.
These PICs have existed long before the U.K. introduced its REIT legislation in 2007. The
U.K. REITs could be internal or external managed, but mostly apply internal management.
To qualify as a U.K. REIT, at least 75% of the net income profit of the firm must be derived
from the property rental business and at least 75% of the assets must be used in the property
rental business.
3.2 A comparison of the main characteristics of REIT structure
With regard to asset management structure, REITs in the Asia-Pacific region (with the
exception of stapled REITs in Australia, K-REITs in South Korea, and the Link REIT in
Hong Kong) use an external management unit to manage their assets. Stapled A-REITs are
considered as internally managed given that its asset management function is carried out by
an entity within the group structure. In South Korea, all the early REITs are structured as
Corporate Restructuring REITs (CR-REITs), which are externally managed while the more
recent REITs are organized as ordinary REITs (K-REITs), which are internally managed. It is
noteworthy that the CR-REITs in South Korea have finite-lives. REITs in Taiwan and
Thailand are passive and fund-like in nature and have very limited growth opportunities.
Link REIT (the first H-REIT comprising of properties formerly owned by the Hong Kong
Housing Authority, a government agency) is the only REIT in Hong Kong that has an internal
management structure.
REITs in Europe, Canada and the U.S. are mostly internally managed even though
some of the countries (U.S., Canada, Belgium, and the U.K.) permit both forms of
management structure. According to various sources (Real Estate Securitization Handbook,
existing REITs in France, Turkey, Belgium, and Canada have an internal management
structure. It is also noteworthy that, after the Tax Reform Act of 1986 in the U.S. that
permits either internal or external management, a significant portion of U.S REITs in the
post-1990 period are managed internally (see Chan, Erickson and Wang, 2003).
In order to qualify as a REIT, the legal system for each country specifies certain
investment requirements on real estate. Most countries (except Australia, Japan, Turkey,
Canada, and the US) place restrictions on the use of leverage and all countries (except
Malaysia where it is not specified) have dividend payout requirements. All countries, except
Thailand, allow REITs to invest in foreign markets but so far, in the Asia-Pacific, only
A-REITs and S-A-REITs have invested in foreign markets. According to a 2006 report by Yuta
Seki of the Nomura Institute of Capital Market Research, J-REITs are considered to be
passive property investment schemes and none has invested in development projects. The
REITs in all countries receive favorable tax provisions although in South Korea, these tax
provisions were not extended to K-REITs until 2005.
4.
Sample selection and description
This Section firstly provides a detail of the sample selection criteria and procedure.
We will also report some of the difficulties we encountered in filtering the data. Section 4.2
will report the summary statistics of our final sample of 370 REITs that we gathered from 14
4.1. Sample selection and data sources
We first identified and collected our sample of U.S. REIT and non-U.S. REIT IPOs
during the 1971 to 2010 period from several data sources. However, we decided to limit our
sample to the period beginning from 1996. This is because the Asian REIT market started in
2001 and we are not able to obtain IPO data on our European REIT sample prior to 1996. In
addition, to facilitate comparison across countries, we think it is best to apply the same
sampling period to all the countries that we include in this study. Only three countries
(Australia, Canada and the U.S.) have IPO data prior to 1996.
We identify the initial sample of U.S. REIT IPOs that starts trading between January
1996 to December 2010 from the National Association of Real Estate Investment Trust
(NAREIT) database, Securities Database Corporation (SDC) Platinum New Issues database,
and Center for Research in Security Prices (CRSP) database. Appendix II shows our data
collection procedure for U.S. REIT IPOs during the 1996-2010 period. Both SDC Platinum
and CRSP provide the industry classification of firms in the database. We use SIC 6798 to
identify the firms that are classified as REITs in both of these databases. The NAREIT
database and the SDC database provide the REIT name, offering date, offering price and
offering amount, and the CRSP database provides the REIT name and the first trading date.
Using at least two data sources, we verified a sample of 132 U.S. REIT IPOs spanning the
period 1996-2010. (Of these, only one IPO in the sample is a best efforts offer.) Among them,
129 REIT IPOs are verified using NAREIT and SDC, two are verified using either SDC or
NAREIT together with Lexis-Nexis news, and one is verified using CRSP and the REIT’s
IPO prospectus (available from EDGAR online).
For each of the verified U.S. REIT IPO, we use CRSP to obtain aftermarket price data
for the first trading day, the daily returns data for the subsequent 190 trading days and the
provides daily return data that includes dividend and stock split adjustments. CRSP uses the
last sale price or the closing bid/ask average at the time of the last available price for the
return computation (see CRSP documentation). We checked the CRSP return series for
missing return codes (-66.0, -77.0, -88.0, and -99.0) but did not find these codes during the
time periods we examine in this study. We also checked the first-day trading price for each
REIT using the Standard and Poor’s Daily Stock Price Record. From this screen, we
eliminate three IPOs. The first is a unit (common share plus warrant) offering in which the
first-trading day (given in CRSP) and the offering date (as stated in NAREIT and SDC) of
this REIT are about six months apart. In this particular case, the warrants detach six months
after the offering date (PR Newswire, 11/14/1997.) The second involves a publicly-listed
specialty finance company converting to a REIT and filing to list on the NYSE under a new
stock symbol. The third is an existing NASDAQ traded REIT that made a public offering of
common stocks and began trading on the NYSE. With these three deletions, our final U.S.
sample comprises of 129 REITs with initial trading dates spanning the period 1996-2010.
To identify the non-US REITs (from 13 countries, namely, Australia, Japan, South
Korea, Singapore, Thailand, Taiwan, Malaysia, Hong Kong, Turkey, Belgium, France, U.K.,
and Canada) and their IPO information during the 1996-2010 period, we gather all firms
listed in the REIT sector from the Securities Database Corporation (SDC) Platinum New
Issues database, Bloomberg database, and the Thomson Datastream Advance database.
Appendix III uses flow chart showing how we arrived at our sample of 241 non-U.S. REIT
IPOs. The Bloomberg database classifies firms according to Industry Classification
Benchmark (ICB), Global Industry Classification Standard (GICS) and Standard Industrial
Classification (SIC) codes. To get the largest initial sample from Bloomberg, we use ICB,
Bloomberg’s default code to filter firms. DataStream classifies firms into REIT industry based on Thomson Reuters Business Classification (TRBC). It covers over 40 years of data
from more than 140 countries and 60 markets. It also covers the historical data for both
active (listed) and dead (delisted) firms. When we set the selection criterion, we restrict our
samples to the “Primary quotes” and “Major Security” so that the firms selected are only the primary quotes on the main markets. For firms with cross-listings, only those on the main
markets will be counted in our sample. SDC and Bloomberg provide the issuer name, the
issue date, offer price, the primary exchange where issuer’s stock trades, the issuer’s industry, REIT type and the primary shares offered in the market while DataStream provides the firm
name, industry sector, market, and base (first available trade) date. Both Bloomberg and
DataStream provide the first-day trading price and time-series price data. For the first-day
closing price, we use the unadjusted price, which is the closing price as it was historically
determined on the stock exchange. For our long-run performance analysis, we use
time-series price data from DataStream as in prior studies of global equity offerings (e.g., Foerster
and Karolyi (2000) and Brounen and Eichholtz (2002)).
We cross-reference the firms from the above three databases (those with SIC 6798 in
SDC, those in the ICB REIT sector in Bloomberg, and those in the REIT sector in
DataStream) and retain only the firms that are not duplicates. A firm is verified to be a REIT
if it is in the REIT sector in all three databases. If not, we verify the firm to be a REIT using
one of the following additional sources: the website of the stock exchange on which the firm
is listed, the firm’s website, CBRE report, EPRA report, and Thomson Extel Cards Records, Hoover's Company Records, Nelson's Public Company Profiles or Major Companies Report
from the LexisNexis Academic Database.
After deleting those firms that we cannot verify to be a REIT in at least two sources,
we have an initial sample of 312 non-U.S. REITs that have an initial trading date in the
1996-2010 period. Note that in our U.K. sample, we include property investment companies that
classified as a REIT in the data sources (SDC, Bloomberg or DataStream) that we use to
identify our initial REIT sample. We next check for offering price and first-day closing price
information for these 312 REITs using one of several sources: Bloomberg, DataStream,
Google Finance, Yahoo Finance, CBRE report, and market releases or IPO prospectuses (if
they are available from Bloomberg or Lexis-Nexis Academic). Of these 312 REITs, we are
able to find non-missing offer price and first-day close price information for 266 of them (54
from Australia, 138 from Asia, 41 from Europe, and 33 from Canada). Given that we find
instances of discrepancies in the recorded offer price or first-day day close price among the
different data sources, we will include a REIT in the final sample only if its offer price and
first-day closing price information can be verified in at least two sources, except in cases
where the IPO price is taken from a prospectus or is the same for all the REITs in a country
(as in the case of CR-REITs in South Korea, T-REITs in Taiwan and Thai REITs).
A situation that requires special treatment is when an IPO is being offered on a partly
paid or installment basis, as is the case with several A-REITs in our sample. To illustrate, an
excerpt from the offering prospectus of Reckson New York Property Trust dated Aug 15,
2005 states: “The Offer is for 263 million Units in the Trust at a fully paid Issue Price of $1.00 per Unit. The Issue Price will be payable in two installments – an Initial Installment of
$0.65 per Unit which will be payable at the time of Application and a Final Installment of
$0.35 per Unit which will be payable on 1 October 2006”. A press release statement on the day after the REIT started to trade reads as follows: “The $263.4 million Reckson New York Property Trust has made its debut on the Australian Stock Exchange, closing at the issue
price of 65c a unit, having gone as high as 66c. With 35c payable in October next year,
Reckson offers a slice of the New York tri-state office property market (Sydney Morning
Herald (Australia), Business Section, p. 18, September 27, 2005). Therefore, for this and
price and the first-day closing price as the price given in the press release following the day
of trade and confirmed with the price in Bloomberg and DataStream.
Another situation that requires attention is when the SDC reports two different
offering prices for the same IPO (in a few cases in Malaysia and Singapore). In such cases,
we check with the firm’s prospectus and use the retail price offered to the public as the IPO price.
After this verification, 25 IPOs are eliminated for the following reasons:
(a) The offer price or the close price can be found in only one source (7 A-REITs, two
K-REITs, and 7 Canadian REITs eliminated).
(b) The offer has either conflicting offer price or closing price information from two or
more sources (two A-REITs, one Turkish REIT, one Canadian REIT, and one U.K.
REIT eliminated).
(c) The offer is a relisting under the same name after a merger with another firm (one
J-REIT eliminated).
(d) The offer is a spin-off offering in which shares are distributed to parent firm’s
shareholders or offered to these shareholders at a preferential rate (three S-REITs
eliminated).
The final sample consists of 129 U.S. REIT IPOs and 241 non-U.S. REIT IPOs (45 from
Australia, 132 from Asia, 39 from Europe, and 25 from Canada) with offering dates spanning
the 1996-2010 period. Totally, we have a final sample of 370 REIT IPOs from four
4.2. Sample statistics
Table 1.2 compares the mean percentage of institutional holdings of REIT stocks
across the globe. Given data limitations, our computation of the mean percentage of
institutional holdings of REIT stocks in each country in our sample (except the U.S.) is based
on the institutional holdings data that Bloomberg reports for each REIT on December 31,
2010.2 The mean percentage holding is computed using only those REITs with available
institutional holdings data. Note that we report the institutional holdings figures for Taiwan
to be not available because the figures given by Bloomberg for the Taiwan REITs are
extremely low (average of 0.05%), which are inconsistent with information in new articles
that mentioned about high institutional holdings of Taiwan REITs. For example, according
to a November 2010 Taiwan economic news article in news.cens.com, REITs in Taiwan are
held mostly by institutional investors. The article cited two REITs (San Tin Fund and Kee
Tai Fund) with institutional holdings of around 75% and 59%. Given the contradictory
information (at two extreme opposite ends) reported in Bloomberg and news articles for
Taiwan REITs, we treat the institutional information for Taiwan as being “not available”. For
the U.S. REIT sample, the percent of institutional holdings is the equity holdings of
institutional investors in REIT stocks in the first quarter following their IPOs. This
information is obtained from the Thomson Reuters Institutional Holdings 13F database
through WRDS.
As Table 1.2 shows, the percentage of institutional holdings in REIT stocks in several
countries (Japan, Singapore, Hong Kong, the U.K. and post-1995 US) is relatively high
(ranging from about 39% to 90%) when compared to the institutional holdings of about 13%
2 Bloomberg provides firm-level data on the percentage of institutional holdings starting only in March 2010.
We asked someone working in the Bloomberg data department about the availability of data for earlier periods but were told that Bloomberg does not provide historical institutional holdings information for non-U.S. firms.
and 23% in U.S. REITs during the 1981-1989 and 1981-1999 periods, respectively (see Chan,
Erickson and Wang, 2003). However, institutional interest in REITs is still rather low (below
10%) in Turkey during the period of the study. It should be noted that this observation is
based only on a sample of four REITs in Turkey that have institutional holdings information
available
Table 1.3 presents a detailed breakdown of the number and issue size of these IPOs in
each year during the 1996-2010 period by country and by continent. SDC provides the
offering size or proceeds amount in the market (at which the REIT trades) denominated in US
dollars. When the data is missing from SDC for a particular REIT, we compute the offering
size by first multiplying the offer price, which is denoted in local currency, by the number of
IPO shares offered taken from Bloomberg. We then convert the amount to US dollars using
the exchange rate prevailing at the IPO date. The foreign currency exchange rate is obtained
online from http://www.x-rates.com/.
As Table 1.3 shows, only the U.S., Australia, Canada, and Belgium have REITs
trading before 2001. REIT IPO activity in Asia did not begin until September 2001.
Although Turkey has the first public listing of REIT on the Turkish Stock Exchange in 1997
(see EuroProperty Magazine, Nov. 17, 2008), 2005 is the earliest year we are able to find
REIT IPO information for Turkey from our data sources. France established a REIT regime
in 2003 followed by the U.K. in 2007. Therefore, for France, REIT IPO activity starts only in
2005. For the U.K., however, only two REITs (one in 2007 and one in 2010) were launched
as newly-created REITs. The rest of the IPOs are by REIT-like firms (or property investment
companies) that are classified as REITs in SDC, Bloomberg or DataStream. Most of these
Comparing offering sizes across countries, Table 1.3 shows a similarity in the mean
amount issued between Asia ($239 million) and the U.S. ($243 million). The average
offering sizes in Europe ($89 million) and in Canada ($87 million) are less than half that of
the REITs in Asia or in the U.S., while the average offering size in Australia ($153 million) is
slightly below the global (excluding the U.S.) average. At the country level, Hong Kong has
the largest mean offer size (US$684 million) followed by Japan (US$370 million). It is
noteworthy, however, that the large mean offer size in Hong Kong is driven by an extremely
large offer (US$2,560 million) by Link REIT, the first listed REIT in Hong Kong. Excluding
this outlier, the mean offer size in Hong Kong is $371 million, which is close to that in Japan.
While recognizing that the REIT regimes in different countries are at various stages of
maturity, we are able to observe periods of heightened REIT IPO activity (or wave) in each
region during the period from 1996 to 2010. Defining a REIT IPO wave to be ten or more
IPOs in any given year or consecutive years as in Buttimer, Hyland, and Sanders (2005), we
observe the following waves: 2003, 2005-2007, and 2010 in Asia; 2006 in the Europe; and
1997-1998, 2003-2005, and 2010 in North America.3 Under this definition, there are no
REIT IPO waves in Australia. For all the countries in our sample, with the exception of
Thailand and the U.S., there are no REIT IPOs completed in 2009. In addition, there are no
REIT IPOs from 2008 to 2010 in the Japan, Taiwan and Hong Kong samples. In the next
section we will report that this is probably tied to the poor performance of the REITs
(especially in Taiwan and Hong Kong) that went public in the earlier years.
3 The 1997-1998 period is the last of three REIT IPO waves examined in the long-run performance study by
5.
Methodologies
This section describes the methodologies we use to compute the initial-day returns,
the subsequent aftermarket returns over selected intervals in the 190 days after the IPO and
the long-run returns in the first 3 years and 5 years after the IPO.
5.1.Measuring initial-day returns
The initial-day raw return is measured from the offer price to the close price at the end
of the first trading day, without adjusting for market movements. We also compute
market-adjusted initial-day returns, in which the raw return is market-adjusted for the contemporaneous
return on the local market index. The local market indexes used for each non-U.S. country are
as follows: the ASX All Ordinaries Index (Australia), Nikkei 225 (Japan), Seoul Composite
Index (South Korea), Straits Times Index (Singapore), SET Index (Thailand), Taiwan
Weighted Index (Taiwan), KLSE Composite Index (Malaysia), Hang Seng Index (Hong
Kong), Istanbul National 100 Index (Turkey), Euronext BEL-20 Index (Belgium), CAC 40
Index (France), FTSE 100 (U.K.), and S&P/TSX Composite Index (Canada). For the U.S.
market benchmark, we use the CRSP Equally-Weighted market index with dividends. The
reason why we use local market indexes, instead of a matching REIT sample, is because the
REIT markets in most of the countries we are studying are relatively new and we will not
have an adequate sample of seasoned REITs to match REIT IPO samples. We want to apply
5.2.Measuring cumulative abnormal returns over 190 days
To analyze the performance of the REIT IPOs over a longer interval, following the
methodology in Wang, Chan and Gau (1992), we compute their average daily returns for the
189 days after the first trading day. CRSP provides the daily returns for the U.S. REITs
while DataStream provides the individual stock total return index (inclusive of dividends)
that we can use to calculate the daily returns for each non-U.S. REITs. However, for 11
REITs in our sample (one in Australia, five in Taiwan, four in Canada, and one in France) in
which time-series data is not available for the beginning part of the series from DataStream,
we filled in the missing portion using time-series data from Bloomberg.
For computing the benchmark returns during our period of analysis, DataStream
provides time-series data on the daily total return index (inclusive of dividends) for some
countries, namely, Australia, Canada, France, Hong Kong, Singapore, Taiwan, Thailand, and
the U.K. but provides only the price index (exclusive of dividends but adjusted for capital
operations) for Belgium, Japan, Malaysia, South Korea, and Turkey. For those countries with
an available total return index we compute the daily market stock return using the total return
index. For those countries with only the price index data (but no return index data), we
compute the daily market stock return using the price index provided.4 For Malaysia, the
daily total return index series starts only from November 2009. Consequently, we have to
use the daily price index data to compute the return series. CRSP provides the time-series
return on an equally-weighted market index (including dividends) for the U.S. REITs.
We compute the cross-sectional average daily market-adjusted returns and cumulate
them over selected intervals after the IPO day. We then compute the significance of the
4 DataStream also provides dividend information on the market in a separate file. However, we find that most of
the dividends reported in the file are either errors or blanks. Given this, we believe that the dividend files for the stock market index are not reliable. Since the stock market returns calculated using the stock market price indexes do not include the market dividends, the results of the five countries derived using price indexes should be interpreted with caution.
market adjusted cumulative abnormal returns (CARs) using a methodology similar to Ritter
(1991) and Wang, Chan and Gau (1992).
5.3.Measuring long-run performance over 3-year and 5-year periods
To test the long-run performance of REIT IPOs in each country (each continent as
well as the global market) over the longer run (three years and five years), we employ a Fama
and French factor model similar to that used by Loughran and Ritter (1995) and Buttimer,
Hyland and Sanders (2005). The number of factors that we include in the model for each
country will depend on data availability. As in Loughran and Ritter (1995), each month we
form a portfolio of REIT IPOs that went public during the prior 36 months (or 60 months).
In month t, REIT IPOs from month t-1 are added to the portfolio while those REITs that went
public in month t-37 (or t-61) are dropped from the portfolio. The portfolios are formed for
each country, each continent (Australia, Asia, Europe and North America), and the global
market (including and excluding the U.S.). The portfolio monthly return is the average of the
monthly return (including dividend) of each REIT included in the portfolio.
For each country, we regress the REIT IPO portfolio return in excess of the risk-free
rate against one or more Fama and French (1993) factors. The regression model with the
Fama-French factors as well as Carhart's (1997) momentum factor included is as follows:
Rpt – Rft = + b[RMCt - Rft]+ c HMLCt + d SMBCt + e WMLCt + εpt,
where Rft is the risk-free rate in month t, and Rpt – Rft is the return on the country’s portfolio
minus the risk-free rate (or excess return) in month t. RMCt - Rft is the excess monthly return
on the value-weighted local market portfolio, HMLCt is the return on a country portfolio of
stocks in month t, SMBCt is the return on a country portfolio of small firms minus the return
on country portfolio of large firms in month t, and WMLC
t is Carhart's (1997) momentum
factor. A statistically significant intercept of the regression will indicate long-run abnormal
performance.
Kenneth French’s website provides Rft (the one-month U.S. treasury bill rate).5 The
website also provides RMCt , the country’s market return (value weighted local return) for the
following countries: Australia, Belgium, Canada, France, Hong Kong, Japan, Singapore,
U.K., and the U.S. For the rest of the countries (Taiwan, Thailand, South Korea, Turkey and
Malaysia) we calculate the local market monthly return using the local stock market price
index from DataStream. The market monthly market returns include dividend returns for
Taiwan and Thailand but exclude dividend returns for South Korea, Turkey and Malaysia.
Kenneth French's website provides all the monthly country-specific factors, HMLCt , SMBCt
and WMLC
t for the U.S. and Japan, but only provides the HMLCt factor for the other
countries.
Additionally, we run a similar four-factor regression model for each continent (and
global) portfolio where we define Rpt – Rftas the continent (or global) market portfolio return
in excess of the risk-free rate in month t, RMt - Rft is the excess monthly return on the
value-weighted regional (or global) market portfolio, and HMLt, SMBtand WMLt as the regional (or
global) value, size and momentum factors, respectively. Kenneth French’s website provides the global factors, European factors, Asia-Pacific ex-Japan factors and the North American
factors.
6.
Empirical results
This section reports the empirical results for the initial-day returns, the subsequent
aftermarket returns over selected intervals in the 190 days after the IPO and the long-run
returns in the first 3 years and 5 years after the IPO.
6.1.Initial-day returns
Table 1.4 displays the summary statistics of the raw and market-adjusted (or
abnormal) initial-day returns by country, by continent, and globally. The mean
market-adjusted initial-day return for the 370 REIT IPOs issued in 14 countries during the 1996-2010
period is a significant 3.31%. The mean market-adjusted initial-day return for the 241 (129)
non-U.S. (U.S.) REIT IPOs is a significant 3.59% (2.79%). The mean market-adjusted
initial-day returns are significantly positive for four countries: Australia (3.24%), France
(8.55%), the U.K. (7.65%), and the U.S. (2.79%). The other ten countries have positive (but
insignificant) initial-day returns.
The initial-day returns of the four continents are all significant and positive. The 39
European REIT IPOs have the highest mean market-adjusted initial-day return (6.60%)
comparing with the 45 REIT IPOs in Australia (3.24%), the 132 REIT IPOs in Asia (3.19%),
and the 154 REIT IPOs in North American (2.61%) during the same period. We also
compute median raw initial-day returns and find the results to be generally consistent with
that using the mean return measure. We use the signed test and Wilcoxon signed rank test to
see whether the median initial-day return is significantly different from zero. Based on the
median raw return, South Korea, Taiwan and Thailand also exhibit significant underpricing.