2018
Predictive analytics in agribusiness industries
Fatemeh Davoudi KakhkiIowa State University
Follow this and additional works at:https://lib.dr.iastate.edu/etd
Part of theOccupational Health and Industrial Hygiene Commons
This Dissertation is brought to you for free and open access by the Iowa State University Capstones, Theses and Dissertations at Iowa State University Digital Repository. It has been accepted for inclusion in Graduate Theses and Dissertations by an authorized administrator of Iowa State University Digital Repository. For more information, please [email protected].
Recommended Citation
Davoudi Kakhki, Fatemeh, "Predictive analytics in agribusiness industries" (2018).Graduate Theses and Dissertations. 16567. https://lib.dr.iastate.edu/etd/16567
by
Fatemeh Davoudi Kakhki
A dissertation submitted to the graduate faculty in partial fulfillment of the requirements for the degree of
DOCTOR OF PHILOSOPHY
Major: Industrial and Agricultural Technology
Program of Study Committee: Steven A. Freeman, Major Professor
Gretchen A. Mosher Mack C. Shelley Stephen A. Simpson
Sree Nilakanta
The student author, whose presentation of the scholarship herein was approved by the program of study committee, is solely responsible for the content of this dissertation. The Graduate College will ensure this dissertation is globally accessible and will not permit alterations after a
degree is conferred.
Iowa State University Ames, Iowa
2018
DEDICATION
TABLE OF CONTENTS
Page
ACKNOWLEDGMENTS ... v
ABSTRACT ... vi
CHAPTER 1. GENERAL INTRODUCTION ... 1
Purpose of Research ... 4
Research Questions ... 5
Data and Methodological Approach ... 7
Organization of Dissertation ... 18
References ... 18
CHAPTER 2. ANALYZING LARGE WORKERS’ COMPENSATION CLAIMS USING GENERALIZED LINEAR MODELS AND MONTE CARLO SIMULATION ... 26
Abstract ... 26
Introduction ... 27
Data ... 29
Methods ... 32
Results ... 36
Conclusions and Discussion ... 41
References ... 44
CHAPTER 3. PREDICTING PATTERNS OF SEVERE INJURIES IN AGRIBUSINESS USING LATENT CLASS ANALYSIS AND NEURAL NETWORKS ... 47
Abstract ... 47
Introduction ... 48
Data ... 49
Methods ... 51
Results ... 55
Conclusions and Discussion ... 65
References ... 69
CHAPTER 4. EVALUATING MACHINE LEARNING PERFORMANCE IN PREDICTING INJURY SEVERITY IN AGRIBUSINESS INDUSTRIES ... 72
Abstract ... 72
Introduction ... 73
Data ... 76
Methods ... 79
Results ... 84
Conclusions and Discussion ... 89
CHAPTER 5. GENERAL CONCLUSIONS ... 97
Research Findings and Conclusions ... 97
Limitations ... 101
ACKNOWLEDGMENTS
I would like to express my sincere gratitude to my major advisor, Dr. Steven A. Freeman, who provided me with the unique opportunity of completing my doctoral program. His guidance, mentorship, support, and insights in each and every aspect of the last two years enlightened my path and kept me motivated to continue purposefully.
I would also like to thank my committee member, Dr. Gretchen A. Mosher, whose insightful comments aided the initial idea of this research and improved it.
I would like to thank my committee members, Drs. Mack C. Shelley, Stephen A.
Simpson, and Sree Nilakanta, for their continuous guidance, comments, and support throughout the course of this research.
In addition, I would also like to thank my friends and colleagues, Nurhaizan Mohd Zainudin, Saxon Ryan, Wesley Chang, and Chad Dolphin, who created a great and friendly working and studying environment in Elings 3332.
I would also like to thank the department staff and faculty for making my time at Iowa State University a wonderful experience.
I want to also offer my appreciation to the insurance company for providing the data for this research without which this thesis would not have been possible.
ABSTRACT
Agriculturally related industries are routinely among the most hazardous work environments. Workplace injuries directly impact labor-market outcomes including income reduction, job loss, and health of the injured workers. In addition to medical and indemnity costs, workplace incidents include indirect costs such as equipment damage and repair, incident
investigation time, training new personnel for replacement of the injured ones, an increase in insurance premiums for the year following the incidents, a slowdown of production schedules, damage to companies’ reputation, and lowering the workers’ motivation to return to work. The main purpose of incident analysis is the derivation and development of preventative measures from injury data. Applying proper analytical tools aimed at discovering the causes of
occupational incidents is essential to gain useful information that contributes in preventing those incidents in future. Insight gained from the analyses of workers’ compensation data can
efficiently direct preventative activities at high-risk industries. Since incidents arise from a combination of factors rather than a single cause, research on occupational incidents must go deeper into identifying the underlying causes and their relationship through applying more comprehensive analyses. Therefore, this study aimed at identifying underlying patterns in occupational injury occurrence and costs using data mining and predictive modeling techniques instead of traditional statistical methods. Utilizing a workers’ compensation claims dataset, the objectives of this study were to: investigate the use of predictive modeling techniques in
forecasting future claims costs based on historical data; identify distinctive patterns of high-cost occupational injuries; and examine how well machine learning methods work in finding the predictive relationship between factors influencing occupational injuries and workers’
patterns, identification of prevalent causes of occupational injuries, and identification of high-risk industries and occupations. Therefore, various stakeholders such as policymakers, insurance companies, safety standard writers, and manufacturers of safety equipment can use the findings of the study to plan for remedial actions and revise safety standards. The implementation of safety measures by agribusiness organizations can prevent occupational injuries, save lives, and reduce the occurrence and cost of such incidents in agricultural work environments.
CHAPTER 1. GENERAL INTRODUCTION
Occupational safety incidents threaten employees’ lives, damage employers’ human capital (Shin, Oh, & Yi, 2011), and are considered as a major public health issue (Utterback et al., 2012). Occupational injury management is a significant component of safety engineering and plays an important economic role in most of industries (Bevilacqua, Ciarapica, & Giacchetta, 2008). Thus, effective management of occupational injuries plays a pivotal role in running successful economies driven by agriculture, manufacturing, and service industries (Jilcha & Kitaw, 2017). According to the International Labor Organization (ILO), an average of 4% of a given country’ gross national product is spent on safety incidents and work-related diseases (Shin, Oh, & Yi, 2011). Therefore, it is necessary to learn from past documented fatal and non-fatal occupational incidents to begin initiatives needed to reduce the likelihood of future
incidents (Field et al., 2014). Analyses of injury statistics are useful in defining characteristics of occupational incidents (Pietilä, Räsänen, Reiman, Ratilainen, & Helander, 2018; Hovden,
Albrechtsen, & Herrera, 2010; Ciarapica & Giacchetta, 2009).
Although there is no single data source to address all occupational injuries in the United States, workers’ compensation claims collected at the employer level provide a valuable, but underutilized major resource for gaining insights about occupational incidents (Wurzelbacher et al., 2016). Workers’ compensation provides cash and covers medical and indemnity costs for workers who experience injuries or illnesses as a result of their employment and provides benefits to the survivors of workers killed at work (Szymendera, 2016). Workers’ compensation programs are state-level insurance programs that provide medical care and income replacement benefits for people injured at work (Dillender & Allan Hunt, 2017). The first workers’
States (Fishback & Kantor, 1996). Today, workers’ compensation coverage is more than 100 years old in 32 states. There are three main types of workers’ compensation claims—medical, temporary disability, and permanent disability—among which the greatest costs are imposed by permanent disability. The most common claims are medical even though these represent a small share of the overall payments. Sources of workers’ compensation insurance consist of private insurance carriers, state-funded, or self-insured (Baldwin & McLaren, 2016). According to the National Council on Compensation Insurance (2015), workers’ compensation insurance is considered as a unique line of business since it balances the interests of many system
stakeholders to protect and retain the jobs of injured employees and their families, to employers, medical providers, insurance companies, regulators, and states. In the United States, even though the medical and indirect costs of occupational injuries are sizable, workers’ compensation covers less than 25 percent of injury costs, which imposes economic burdens on all members of the society (Leigh, 2011).
The major goal of occupational incident analysis is to better understand safety incidents to identify the causes of injuries and design adequate prevention measures (Jacinto, Canoa, & Guedes Soares, 2009). Workers’ compensation data are important for understanding the extent of occupational injuries and deploying necessary interventions to protect workers (Wurzelbacher et al., 2016). While not all workers’ compensation claims data are the same in terms of the volume of information, they often include structured information on the cause and nature of the injury, disability type, costs for medical care, rehabilitation, and partial wage replacement, and may also include demographic information (age, sex, job tenure, occupation) on the injured workers as well as their employer (industry, employee payroll, prior claim history) and unstructured narrative description of the injury (Wurzelbacher et al., 2016). Analysis of workers’
compensation claims is an effective and economical tool in identifying essential information regarding injury preventative interventions (Utterback et al., 2012). Therefore, analyzing workers’ compensation claims can contribute to identifying underlying patterns in workers’ injuries and improving safety outcomes in the work environments (Douphrate, Rosecrance, Reynolds, Stallones, & Gilkey, 2009). This is especially true in high hazard industries such as agribusiness.
Agribusiness is defined as the “sum of all operations involved in manufacture and
distribution of farm supplies, production operations on the farm, and the storage, processing, and distribution of farm commodities” (Zylbersztajn, 2017). Agribusiness industries refer to the organizations, business administrations, and industries engaged in agriculture and agriculturally related products and services (Fleet, 2016). In agribusiness industries, incidents happen through a combination of activities, causes, different machines, and equipment in diverse scenarios in which workers suffer injuries with various severity levels (Robert, Elisabeth, & Josef, 2015). In this study, a large workers’ compensation claim dataset from a leading insurance company in the Midwest of the United States was utilized. The data included more than 39,000 occupational injuries that occurred in various agribusiness industries between 2008 and 2016. The claims were submitted by various agribusiness industries such as grain elevators, agronomy organizations, food processing and feed milling operations, livestock industries, poultry, trucking, equipment dealers, dairy operations, biofuel facilities, farm stores, refined fuels, and general agricultural companies. While obtaining occupational injury data for the mentioned industries is a challenge, workers’ compensation claims are a viable source for providing insights on injury characteristics in the agribusiness industries. The overall motivation of this study was to investigate the
mining, and predictive modeling techniques to provide insight on occupational incidents and identify factors that contribute in predicting future incidents claims costs.
Purpose of Research
Agriculturally related industries are routinely among the most hazardous work environments (Field et al., 2014). Every year, thousands of occupational incidents occur in agribusiness industries (Pawlak & Nowakowicz-Dębek, 2015). Workplace injuries have direct impact on labor-market outcomes including income reduction, job loss, and health of the injured workers (Boden, O’Leary, Applebaum, & Tripodis, 2016). In addition to medical and indemnity costs, workplace incidents include indirect costs such as equipment damage and repair, incident investigation time, training new personnel for replacement of the injured ones, an increase in insurance premiums for the year following the incidents, a slowdown of production schedules, damage to companies’ reputation, and lowering the workers’ motivation to return to work (Gavious, Mizrahi, Shani, & Minchuk, 2009).
The main purpose of incident analysis is the derivation and development of preventative measures from injury data. To meet that goal, analysis of injury reports can significantly improve the information about incidents (Robert, Elisabeth, & Josef, 2015). Reliable estimation of
potential incidents’ costs can help managers to define, implement, and improve safety measures from an economic-managerial perspective (Gavious, Mizrahi, Shani, & Minchuk, 2009).
Applying proper analytical tools aimed at discovering the causes of occupational incidents is essential to gain useful information that contributes in preventing those incidents in future (Salguero-Caparros, Suarez-Cebador, & Rubio-Romero, 2015). Insight gained from the analyses of workers’ compensation data can efficiently direct preventative activities at high-risk industries (Wurzelbacher et al., 2016). Since incidents arise from a combination of factors rather than a
single cause, research on occupational incidents must go deeper into identifying the underlying causes and their relationship through applying more comprehensive analyses (Jacinto, Canoa, & Guedes Soares, 2009). Therefore, this study aimed at identifying underlying patterns in
occupational injury occurrence and costs by using data mining and predictive modeling techniques instead of traditional statistical methods.
Utilizing a workers’ compensation claims dataset, the objectives of this study were to: (1) investigate the use of predictive modeling techniques in forecasting future claims costs based on historical data; (2) identify distinctive patterns of high-cost occupational injuries; and (3)
examine how well machine learning methods work in finding the predictive relationship between factors influencing occupational injuries and workers’ compensation claims occurrence
(frequency of incidents) and severity (cost of claims).
The results of this study lead to a better understanding of injury patterns, identification of prevalent causes of occupational injuries, and identification of high-risk industries and
occupations. Therefore, various stakeholders such as policymakers, insurance companies, safety standard writers, and manufacturers of safety equipment can use the findings of the study to plan for remedial actions and revise safety standards. The implementation of safety measures by agribusiness organizations can prevent occupational injuries, save lives, and reduce the occurrence and cost of such incidents in agricultural work environments.
Research Questions
The overarching goal of this study was to identify underlying patterns of occupational injuries in agribusiness industries and determine factors associated with the frequency and severity of potential injuries. This dissertation includes three separate studies, each of which addressed specific research objectives.
The first study focused on predicting monetary loss of future injuries for severe incidents that historically had a total incurred amount equal to or more than $100,000. The research questions examined were:
i. What are the statistical distributions that fit claim with low frequency and high costs? ii. What is the regression model with the most predictivity power for future injury cost
estimation?
iii. What factors from workers’ compensation claims data are influential in increasing the cost of claims?
The second study focused on identifying high-risk subgroups in agribusiness industries. The incidents whose summation of medical costs, indemnity costs, and other relevant expenses exceeded $100,000 were classified as high-risk (severe) injuries. The research questions examined were:
i. Are there distinctive patterns in severe injuries among adult workers in selected agribusiness industries?
ii. What are the characteristics of high-cost injuries?
iii. What are the most prevalent injury type, cause, and nature in severe incidents? iv. What occupations are prone to high injury costs?
v. Are patterns in severe injuries predictable based on the historical data?
The third study focused on evaluating the performance of machine learning methods in accurately classifying and predicting severity of injuries. The claims in the dataset have two statuses. Open claims refer to those which will continue to cost for the parties involved while closed claims refer to those which were fully paid and no longer cost for the parties involved. Considering closed claims, the total cost of medical care, indemnity, and other relevant expenses
were used to create a new variable called “severity” with two levels: claims with total incurred cost between zero to ten thousand dollars were classified as non-severe; claims with total incurred cost above $10,000 were classified as severe. The research questions examined were:
i. What are the factors that contribute to severity class prediction in workers’ compensation claims?
ii. How well do machine learning techniques model and classify the severity of occupational injuries in agribusiness industries?
Data and Methodological Approach
The workers’ compensation claims dataset used in this study were provided by a major private insurance company in the Midwest of the United States that specializes in insurance products for agribusiness industries. The claims were submitted by various agribusiness industries over eight years from 2008 to 2016. The data consisted of 39,782 rows and 34
columns. Each row included the information regarding the reported injury. However, the data did not include any information that could be used to identify the injured employees or their
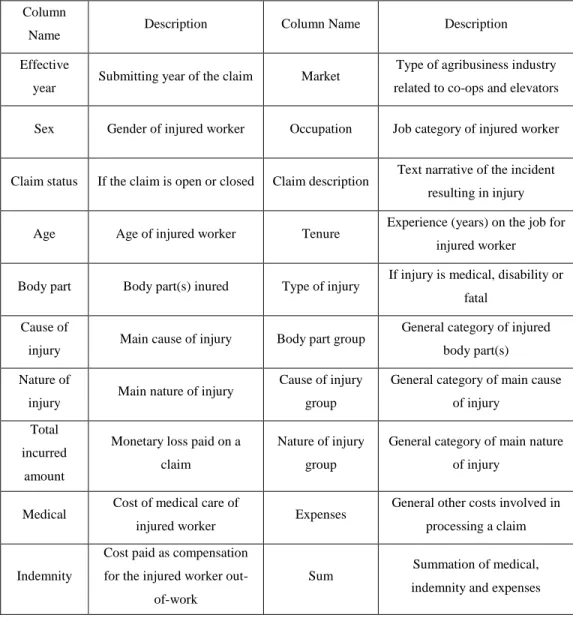
employers. Using the demographic data, the age and tenure of injured workers on the incident date were calculated and added to the dataset as new variables. Also, the summation of medical costs, indemnity costs, and expenses was calculated and used as a new variable called “sum.” The dataset had some negative values for medical and indemnity costs and other expenses. Also, some rows included several missing information that hindered the analysis. Thus, the data was cleaned by imputing those negative cost values, and missing datapoints. Finally, a total of 37,016 datapoints were available for analysis. The variables extracted from original data and used in the study are shown in Table 1.
The dependent variable in this study was the summation of medical costs, indemnity compensation, and expenses. For studies in chapters 2 and 3 of this dissertation, the dependent variable was “sum.” In chapter 3, “sum” is used for binary classification; “NS” represented non-severe injuries with a sum of less than or equal to $10,000 and “S” represented non-severe injuries with a sum of more than $10,000. This classification information was added to the data as a new column called “severity.” A detailed description of variables used in studies one, two, and three are provided in the relevant chapters.
Table 1: Variables used in the Study Derived from the Original Dataset
Column
Name Description Column Name Description
Effective
year Submitting year of the claim Market
Type of agribusiness industry related to co-ops and elevators Sex Gender of injured worker Occupation Job category of injured worker
Claim status If the claim is open or closed Claim description Text narrative of the incident resulting in injury Age Age of injured worker Tenure Experience (years) on the job for
injured worker
Body part Body part(s) inured Type of injury If injury is medical, disability or fatal
Cause of
injury Main cause of injury Body part group
General category of injured body part(s) Nature of
injury Main nature of injury
Cause of injury group
General category of main cause of injury
Total incurred
amount
Monetary loss paid on a claim
Nature of injury group
General category of main nature of injury
Medical Cost of medical care of
injured worker Expenses
General other costs involved in processing a claim
Indemnity
Cost paid as compensation for the injured worker
out-of-work
Sum Summation of medical,
Out of 37,016 claims filed from 2008 to 2016, 90.65% have closed status, and 9.35% are open claims that will continue to incur costs for the parties involved. Up to this point, the
company has not provided any updates on the open claims status change, and the study was done based on the claim status in the original dataset.
The preliminary analysis of data was done to gain insight about the most frequent injured body parts, main injury cause, nature, and their groups. Considering the injured body parts, there are 53 levels, with lower back area as the most frequent (13.08%), followed by finger(s),
shoulder(s), knee, hand, eye(s), soft tissues, ankle, foot, multiple body parts, wrist, lower arm, lower leg, thumb, elbow, chest, abdomen, upper leg, upper arm, and upper back area, all of which have frequency between 458 and 3,353 (between 1% and 9%). The injured body parts with less than 1% frequency (between 4 and 359 incidents) include wrist(s) and hand(s), skull, multiple upper extremities, hip, body systems and multiple body systems, lumbar and/or sacral vertebrae (vertebra NOC trunk), lungs, teeth, ear(s), great toe, mouth, multiple lower extremities, nose, toes, multiple trunk, pelvis, facial bones, brain, buttocks, multiple head injury, disc,
vertebrae, internal organs, sacrum and coccyx, spinal cord, multiple neck injury, heart, whole body, trachea, artificial appliance, and larynx.
Regarding the main cause of injury, there are 71 levels. Lifting is the dominant cause present in 3,171 injuries. Strain or injury by (2,791), object being lifted or handled (2,759), fall/slip/trip (2,505), pushing or pulling (1,569), foreign matter (body) in eye(s) (1,444), falling or flying object (1,345), from different level (elevation) (1,241), on same level (1,188), on ice or snow (1,165), cut/puncture/scrape (1,134), and hand tool or utensil (not powered) (1,058) are the next most frequent causes of injuries after lifting. Among 45 nature of injury levels, the most prevalent are strain or tear (31.75%), contusion (15.56%), and laceration (14.13%). Sprain or
tear, fracture, foreign body, burn, puncture, crushing, and inflammation all have a frequency between 467 and 2,559 (1.26% to 7.02%).
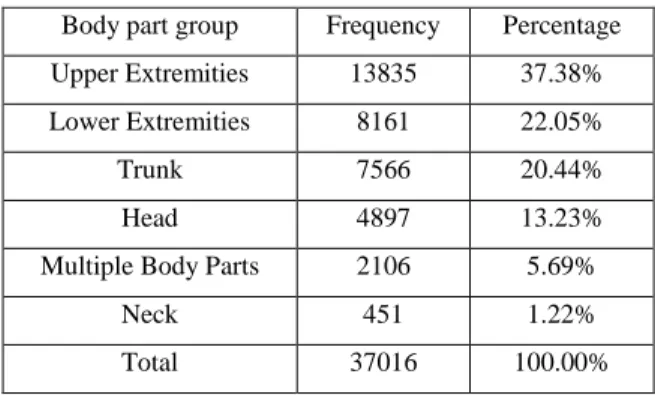
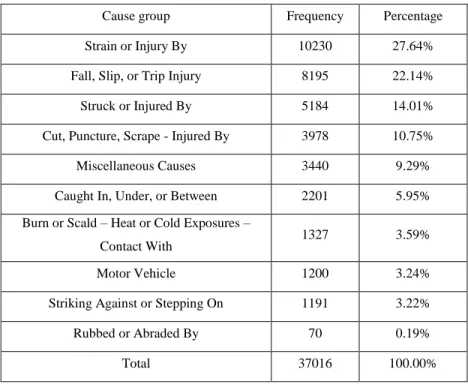
Table 2 shows the distribution of claims based on the type of injury. The most frequent injury type is medical, which counts for 75.80% of all occupational injuries, while the least frequent is permanent total disability, which constitutes only 0.02% of all claims. The most frequent body part groups of injury include upper extremities, lower extremities, and trunk, with 37.385, 22.05%, and 20.44%, respectively, followed by head (13.23%), multiple body parts (5.69%), and neck (0.02%). Nearly all (98.40%) injuries have the nature group of specific injuries. The most prevalent causes of injuries are strain or injury by, and the least frequent is rubbed or abraded by. The frequency and percentage of injuries based on type of injury, injured body part group, nature group of the injury, and cause group of the injury are shown in Tables 2, 3, 4, and 5.
Using information about birth date, hiring date, and injury date of the injured workers, age and tenure were calculated and added as new columns with the same title to the dataset. The information about the age and tenure of injured workers is depicted in Table 6. Gender-wise, 82.97% of injured workers were male, 16.95% were female, and 0.08% were classified as “unidentified gender.” Table 7 shows the percentage of injuries in each agribusiness industry based on the gender distribution.
Table 2: Summary of Injury Type
Type of Injury Frequency Percentage
Medical Only 28057 75.80%
Temporary Total or Temporary Partial Disability 4432 11.97%
Permanent Partial Disability 4368 11.80%
Minor Permanent Partial Disability 67 0.18%
Fatality 64 0.17%
Major Permanent Partial Disability 19 0.05%
Permanent Total Disability 9 0.02%
Total 37016 100.00%
Table 3: Summary of Injured Body Part Group Body part group Frequency Percentage
Upper Extremities 13835 37.38%
Lower Extremities 8161 22.05%
Trunk 7566 20.44%
Head 4897 13.23%
Multiple Body Parts 2106 5.69%
Neck 451 1.22%
Total 37016 100.00%
Table 4: Summary of Injury Nature Group
Nature group Frequency Percentage
Specific Injury 36423 98.40%
Occupational Disease or Cumulative
Injury 413 1.12%
Multiple Injuries 180 0.49%
Table 5: Summary of injury Cause Group
Cause group Frequency Percentage
Strain or Injury By 10230 27.64%
Fall, Slip, or Trip Injury 8195 22.14%
Struck or Injured By 5184 14.01%
Cut, Puncture, Scrape - Injured By 3978 10.75%
Miscellaneous Causes 3440 9.29%
Caught In, Under, or Between 2201 5.95%
Burn or Scald – Heat or Cold Exposures –
Contact With 1327 3.59%
Motor Vehicle 1200 3.24%
Striking Against or Stepping On 1191 3.22%
Rubbed or Abraded By 70 0.19%
Total 37016 100.00%
Table 6: Summary Statistics for Age and Tenure of Injured Workers (in years) Summary Statistic Age Tenure
Minimum 14.4 0
Maximum 89.6 58.8
Mean 41.4 5
Median 41.3 1.9
Table 7: Injury Percentage Per Gender Industry-wise Agribusiness Industry Female Frequency Male Frequency Unidentified Gender Frequency Agronomy 10.03% 89.94% 0.04% Biofuel 5.76% 94.24% 0.00% Dairy 15.51% 84.23% 0.27% Equipment Dealers 2.51% 97.49% 0.00% Farm Stores 30.07% 69.93% 0.00% Feed Mill 5.34% 94.60% 0.06% Food 12.48% 87.39% 0.13% Food processing 31.23% 68.68% 0.10% Fruits, vegetables and nuts 29.74% 70.06% 0.20% General Ag 100.00% 0.00% 0.00% Grain 6.61% 93.26% 0.13% Grain Milling 10.00% 90.00% 0.00% Livestock 22.85% 77.12% 0.04% Nursery-Greenhouse 28.29% 71.59% 0.13% Poultry 31.18% 68.78% 0.05% Refine fuels 28.03% 71.93% 0.05% Trucking 29.04% 70.71% 0.25%
Data mining and predictive modeling are the general methodological approaches for this research. Data mining includes applying statistical analyses to retrieve information and uncover hidden patterns of variables in a dataset (Cheng, Leu, Cheng, Wu, & Lin, 2012). Predictive modeling is the use of historical data to forecast future events by capturing relationships between explanatory (independent or input) variables and predicted (dependent) variables from past events and applying them to predict future outcomes (Frees, Derrig, & Meyers, 2014). In other words, predictive analysis is the process of identifying meaningful patterns in data based on data mining techniques, machine learning methods, and statistical analysis (Abbott, 2014). In recent years, computational methods in data mining and statistical analysis have been developed to derive meaningful and actionable conclusions from historical data to improve injury prevention
efforts in the workplace (Dury, 2015). Using data mining and predictive modeling in analyzing occupational injury datasets can show new cause-effect relationships by identifying the most important predictive variables of injuries and highlighting potential risk groups (Emanuele, 2016). To introduce proper prevention measures, risk identification based on quantitative methods is required (Occhionero, Ghersi, Prandini, Korpinen, & Gobba, 2017).
This study utilized different data mining and predictive modeling techniques based on the research objectives in each chapter: generalized linear regression modeling and Monte-Carlo simulation in chapter 2; latent class analysis and neural networks in chapter 3; and support vector machines, boosting trees, and Naïve Bayes in chapter 4. A review of literature for each method and its application in the field of injury analysis and prediction is discussed in the following.
The study in chapter 2 focused on predicting future costs of claims in agribusiness
industries with high cost claims. High cost claims are those with the summation of medical costs, indemnity compensations, and other expenses equal to or exceeding $100,000. Due to the
importance of claims cost on financial operating expenses of insurance companies, insurers, investors, policy makers, and regulators are interested in models that can describe the behavior of such expenses (Shi & Frees, 2010). Also, to estimate a pure premium for an insured individual, predicting expected claim costs based on historical insurance data is necessary (Bortoluzzo, Claro, Caetano, & Artes, 2011). Predicting future claim costs with high accuracy is important for estimating future company liabilities (Frees & Valdez, 2008). The challenge in predicting insurance claims with high costs is to determine proper statistical distributions before modeling the data (Bortoluzzo, Claro, Caetano, & Artes, 2011).
To address claims with high costs and low frequency, generalized linear regression models with heavy-tailed distributions such as gamma, Weibull, exponential, and lognormal can
be used (Boland, 2006; Achieng, 2010; Packová, 2015; Nath & Das, 2016). Various studies have used heavy-tailed distribution and predictive modeling using generalized regression models to address claims with high costs and low frequency in different insurance companies (Garrido, Genest, & Schulz, 2016; Dlugosz, Mammenb, & Wilke, 2017; Fernández-Gámez, Gil-Corral, & Galán-Valdivieso, 2016; Tang, 2007; Ravi & Butar, 2010; and Cerchiara, Edwards, & Gambini, 2008). Due to the infrequent presence of large claims in the workers’ compensation dataset in this study, a Monte-Carlo simulation was applied to test the performance of the generalized linear models in predicting future claims costs. Using simulation methodology to determine the distribution and estimation of future claim costs is beneficial in insurance risk management (Mucha, Pales, & Sakalova, 2016). Monte-Carlo simulation is a well-adopted simulation methodology for predicting future claims costs based on the distribution of historical data in insurance premium setting and claim analyses (Hahn, 2017; Asmussen, 2017; Fish, Halcoussis, & Phillips, 2017; Peters, Targinox, & Wuthrich, 2017; Mingoti & Matos, 2012; Koehler, Brown, & Haneuse, 2009).
The second study, presented in chapter 3, aimed at identifying higher risk groups in agribusiness industries to provide insights about the characteristics of these groups and contribute to informed decision-making in planning prevention measures in workplace. Two major challenges in safety analyses are the heterogeneous nature of safety data and
understanding the relationship between injury severities and influential factors to select and implement safety countermeasures (Sasidharan, Wu, & Menendez, 2015). Analyzing occupational incidents based on industry and the injured characteristics is significant in evaluating occupational injury risks, identifying causes of incidents, and managing prevention planning (Eiac, 2004).
To categorize subgroups with similar risk profiles, latent class analysis was used. Latent class analysis is a mathematical method to classify the variables into meaningful groups using identifying variables that best distinguish them (Polacheka, Fung, Putnam, Meltzer-Brody, & Vigoda, 2017). Using latent class analysis, homogeneous groups within a heterogeneous
population are identified (Larsen, Pedersen, Friis, & GluÈmer, 2017). Various studies have used latent class analysis to classify and characterize groups with higher risk of injuries based on insurance data in transportation and crash incident severity classification and analysis (Jin et al., 2018; Sasidharan, Wu, & Menendez, 2015; Mannering, Shankar, & Bhat, 2016; Cerwick, Gkritza, & Shaheed, 2014; Kumar & Toshniwal, 2015; Shaheed & Gkritza, 2014; Fountas, Anastasopoulos, & Mannering, 2018). After categorizing all injuries into distinctive groups using latent class analysis, neural network predictive modeling was conducted to investigate whether the identified classes can be used in predicting future costs and characteristics of injuries, and to predict the probability that a future injury is most likely to belong to which latent class with what characteristics.
The reason for using neural networks in injury analysis and safety outcome prediction is due to the strength of neural networks in capturing the complex relationships between variables of interest (Chen, Li, Huang, Zhang, & Yu, 2018). Neural networks have been recently used as a powerful analytical method in incident analysis and incident severity prediction (Mannering, 2018; Deka & Quddus, 2014; Wang, Liu, Fu, Liu, & Stipancic, 2018; Durán-Rosal et al., 2018; Lu et al., 2018). However, there is no literature on utilizing latent class analysis or neural networks in categorizing groups with high risk of injuries and predicting cost of occupational injuries in agribusiness industries.
The third study, presented in chapter 4, focused on investigating the performance of machine learning algorithms in identifying the most important factors in predicting severity of occupational injuries in agribusiness industries. Severity of an injury was defined based on the total dollar amount of each claim incurred in medical costs, indemnity costs, and other relevant expenses. For claims with the total amount between $0 and $10,000, the level was considered non-severe (NS), and claims with cost over $10,000 were considered severe (S). Machine
learning algorithms used in this study were support vector machines, boosting decision trees, and Naïve Bayes. Machine learning models are applied for classification of incidents (Sarkar, Vinay, Raj, Maiti, & Mitra, 2018). Machine learning methods such as support vector machines, decision trees, and Bayesian networks have been used for incident risk analysis, and for injury severity classification and prediction in construction industry (Rivas et al., 2011; Yi, Chan, Wang, & Wang, 2016; Tixier, Hallowell, Rajagopalan, & Bowman, 2016; Leu, & Chang, 2013; Chen & Lou, 2016; Chokor, Naganathan, Chong, & Asmar, 2016).
A support vector machine is a supervised machine learning algorithm that tackles the task of classification by finding an optimal hyperplane that separates the two classes of a categorical target variable (Nagalla, Pothuganti, & Pawar, 2017). Support vector machines are gaining popularity owing to their best prediction performance for binary classification problems (Bacha, Ben Salem, & Chaari, 2012; Gangsar & Tiwari, 2017). Decision tree analysis is a popular predictive analytics method for classification due to being straightforward to build and
understand, as well as handling both categorical and continuous inputs (Abbott, 2014). Boosted trees are among the most applicable decision trees as they have high accuracy in classification of a target categorical variable (Cui, Chen, He, & Chen, 2015). Boosted trees models can
useful in identifying factors affecting incident severity (Zheng, Lu, & Lantz, 2018). Boosted trees model can be used to investigate the complex and non-linear association among variables and compute the importance of each variable in predicting the injury severity classification (Saha, Alluri, & Gan, 2015). Naïve Bayes models are capable of providing high accuracy in predicting binary classification of injury severity as the target variable (Marucci-Wellman, Lehto, & Corns, 2011; Marucci-Wellman, Corns, & Lehto, 2017). Naïve Bayes classification and prediction models are successful in incident hazard identification and severity assessment (Zhang et al., 2017). However, there is no comprehensive literature on application and comparison of machine learning methods (support vector machines, boosted trees, and Naïve Bayes) in classifying and predicting occupational injury severity in agribusiness industries.
Organization of Dissertation
This dissertation is written in the alternative manuscript format as defined by Iowa State University’s Graduate College. Chapter 1 includes the general introduction to the research which outlines the purpose of the study, research objectives, data summary, and methodological
approach. Chapters 2, 3, and 4 are the three manuscripts formatted for submission to specific journals. Chapter 5, which consists of a discussion of the research findings, conclusions, limitations, and recommendations for future work, completes this dissertation.
References
Chen, Z., Li, Z., Huang, C., Zhang, G., & Yu, H. (2018). Safety Assessment Method of Bridge Crane Based on Cluster Analysis and Neural Network. Procedia Computer Science, 477-484.
Dillender, M., & Allan Hunt, H. (2017). The Current State of Workers’ Compensation: Benefit Adequacy, Return to Work, and Prevention. Employment Research, 1-4.
Douphrate, D. I., Rosecrance, J. C., Reynolds, S. J., Stallones, L., & Gilkey, D. P. (2009). Tractor-Related Injuries: An Analysis of Workers’ Compensation Data. Journal of Agromedicine, 190-197.
Field, W. E., Heber, D. J., Riedel, S. M., Wettschurack, S. W., Roberts, M. J., & Grafft, L. J. (2014). Worker Hazards Associated with the Use of Grain Vacuum Systems. Journal of Agricultural Safety and Health, 147-163.
Koehler, E., Brown, E., & Haneuse, S. J.-P. (2009). On the Assessment of Monte Carlo Error in Simulation-Based Statistical Analyses. Am Stat, 155-162.
Lu, Y., Sun, L., Zhang, X., Kang, J., Zhang, Q., & Yu, B. (2018). Analysis of FPSO dropped objects combining Monte Carlo simulation and neural network-genetic approach. Ocean Engineering, 183-193.
Mannering, F. L., Shankar, V., & Bhat, C. R. (2016). Unobserved heterogeneity and the statistical analysis of highway accident data. Analytic Methods in Accident Research, 1-16.
Abbott, D. (2014). Applied Predictive Analytics- Principles and Techniques for the Professional Data Analyst. Indianapolis-Indiana: John Wiley & Sons, Inc.
Achieng, O. M. (2010). Actuarial modeling for insurance claim severity in motor comprehensive policy using industrial statistical distributions. Cape Town: International Congress of Actuaries.
Asmussen, S. (2017). Conditional Monte Carlo for sums, with applications to insurance and finance. Thiele Research Reports, Department of Mathematics, Aarhus University. Bacha, K., Ben Salem, S., & Chaari, A. (2012). An improved combination of Hilbert and Park
transforms for fault detection and identification in three-phase induction motors. Electrical Power and Energy Systems, 1006-1016.
Baldwin, M. L., & McLaren, C. F. (2016). Workers' Compensation: Benefits, Coverage, and Costs (2014 Data). National Academy of Social Insurance.
Bevilacqua, M., Ciarapica, F., & Giacchetta, G. (2008). Industrial and occupational ergonomics in the petrochemical process industry: A regression trees approach. Accident Analysis and Prevention, 1468-1479.
Boden, L. I., O’Leary, P. K., Applebaum, K. M., & Tripodis, Y. (2016). The Impact of Non-Fatal Workplace Injuries and Illnesses on Mortality. American Journal of Industrial Medicine, 1061-1069.
Bortoluzzo, A. B., Claro, D. P., Caetano, M. A., & Artes, R. (2011). Estimating Total Claim Size in the Auto Insurance Industry: A Comparison between Tweedie and Zero-Adjusted Inverse Gaussian Distribution. Brazilian Administration Review, 37-47.
Cerchiara, R. R., Edwards, M., & Gambini, A. (2008). Generalized Linear Models in Life Insurance: Decrements and Risk Factor Analysis Under Solvency II. 18th international AFIR colloquium.
Cerwick, D. M., Gkritza, K., & Shaheed, M. (2014). A comparison of the mixed logit and latent class methods for crash severity analysis. Analytic Methods in Accident Research, 11-27. Chen, H., & Lou, X. (2016). Severity Prediction Models for Falling Risk for Workers at Height.
Procedia Engineering, 439-445.
Cheng, C. W., Leu, S. S., Cheng, Y. M., Wu, T. C., & Lin, C. C. (2012). Applying data mining techniques to explore factors contributing to occupational injuries in Taiwan's
construction industry. Accident Analysis and Prevention, 214-222.
Chokor, A., Naganathan, H., Chong, W. K., & Asmar, M. E. (2016). Analyzing Arizona OSHA Injury Reports Using Unsupervised Machine Learning. Procedia Engineering, 1588-1593.
Ciarapica, F. E., & Giacchetta, G. (2009). Classification and prediction of occupational injury risk using soft computing techniques: An Italian study. Safety Science, 36-49.
Cui, Z., Chen, W., He, Y., & Chen, Y. (2015). Optimal Action Extraction for Random Forests and Boosted Trees. 21th ACM SIGKDD International Conference on Knowledge Discovery and Data Mining, (pp. 179-188).
Deka, L., & Quddus, M. (2014). Network-level accident-mapping: Distance based pattern matching using artificial neural network. Accident Analysis and Prevention, 105-113. Dlugosz, S., Mammenb, E., & Wilke, R. A. (2017). Generalized partially linear regression with
misclassified data and an application to labor market transitions. Computational Statistics and Data Analysis, 145-159.
Durán-Rosal, A. M., Fernández, J. C., Casanova-Mateo, C., Sanz-Justo, J., Salcedo-Sanz, S., & Hervás-Martínez, C. (2018). Efficient fog prediction with multi-objective evolutionary neural networks. Applied Soft Computing, 347-358.
Dury, C. (2015). Human factors/ergonomics implications of big data analytics. Ergonomics, 1-15.
Eiac, E. (2004). Ergonomics Abstracts. Ergonomics Abstracts Birmingham, UK: School of Manufacturing and Mechanical Engineering, University of Birmingham.
Emanuele, C. F. (2016). Big Data Analytics as a Tool for Reducing Ergonomic Risks. Journal of Ergonomics.
Fernández-Gámez, M. A., Gil-Corral, A. M., & Galán-Valdivieso, F. (2016). Corporate reputation and market value: Evidence with generalized regression neural networks. Expert Systems with Applications, 69-76.
Fish, L. J., Halcoussis, D., & Phillips, G. M. (2017). Statistical Analysis of a Class: Monte Carlo and Multiple Imputation Spreadsheet Methods for Estimation and Extrapolation.
American Journal of Business Education, 81-96.
Fishback, P. V., & Kantor, S. (1996, November). The Adoption of Workers' Compensation in the United States. NBER Working Paper Series.
Fleet, D. V. (2016). What is Agribusiness? A Visual Description. Amity Journal of Agribusiness, 1-6.
Fountas, G., Anastasopoulos, P. C., & Mannering, F. L. (2018). Analysis of vehicle accident-injury severities: A comparison of segment- versus accident-based latent class ordered probit models with class-probability functions. Analytic Methods in Accident Research, 15-32.
Fowler, J. R., Cipolli, W., & Hanson, T. (2015). A Comparison of Three Diagnostic Tests for Carpal Tunnel Syndrome Using Latent Class Analysis. The Journal of Bone and Joint Surgery, 1958-1961.
Frees, E. W., & Valdez, E. A. (2008). Hierarchical Insurance Claims Modeling. Journal of the American Statistical Association, 1457-1469.
Frees, E. W., Derrig, R. A., & Meyers, G. (2014). Predictive Analytics in Actuarial Science. Cambridge University Press.
Gangsar, P., & Tiwari, R. (2017). Comparative investigation of vibration and current monitoring for prediction of mechanical and electrical faults in induction motor based on multiclass-support vector machine algorithms. Mechanical Systems and Signal Processing, 464-481. Garrido, J., Genest, C., & Schulz, J. (2016). Generalized linear models for dependent frequency
and severity of insurance claims. Insurance: Mathematics and Economics, 205-215. Gavious, A., Mizrahi, S., Shani, Y., & Minchuk, Y. (2009). The costs of industrial accidents for
the organization: Developing methods and tools for evaluation and cost–benefit analysis of investment in safety. Journal of Loss Prevention in the Process Industries, 434-438. Hahn, L. (2017). Multi-year non-life insurance risk of dependent lines of business in the
multivariate additive loss reserving model. Insurance: Mathematics and Economics, 71-81.
Hovden, J., Albrechtsen, E., & Herrera, I. A. (2010). Is there a need for new theories, models and approaches to occupational accident prevention? Safety Science, 950-956.
Jacinto, C., Canoa, M., & Guedes Soares a, C. (2009). Workplace and organizational factors in accident analysis within the Food Industry. Safety Science, 626-635.
Jilcha, K., & Kitaw, D. (2017). Industrial Occupational Safety and Health Innovation for Sustainable Development. Engineering Science and Technology, an International Journal, 372-380.
Jin, W., Deng, Y., Jiang, H., Xie, Q., Shen, W., & Han, W. (2018). Latent class analysis of accident risks in usage-based insurance: Evidence from Beijing. Accident Analysis and Prevention, 79-88.
Kumar, S., & Toshniwal, D. (2015). A data mining framework to analyze road accident data. Journal of Big Data, 2-26.
Larsen, F. B., Pedersen, M. H., Fris, K., & GluÈmer, C. (2017). A Latent Class Analysis of Multimorbidity and the Relationship to Socio-Demographic Factors and Health-Related Quality of Life. A National Population-Based Study of 162,283 Danish Adults. PLOS ONE.
Leigh, J. P. (2011). Economic Burden of Occupational Injury and Illness in the United States. The Milbank Quarterly: A multidisciplinary Journal of Population Health and Health policy, 728-772.
Leu, S. -S., & Chang, C. -M. (2013). Bayesian-network-based Safety Risk Assessment for Steel Construction Projects. Accident Analysis and Prevention, 122-133.
Mannering, F. (2018). Temporal instability and the analysis of highway accident data. Analytic Methods in Accident Research, 1-13.
Marucci-Wellman, H. R., Corns, H. L., & Lehto, M. R. (2017). Classifying injury narratives of large administrative databases for surveillance—A practical approach combining machine learning ensembles and human review. Accident Analysis and Prevention, 359-371.
Marucci-Wellman, H., Lehto, M., & Corns, H. (2011). A combined Fuzzy and Naïve Bayesian strategy can be used to assign event codes to injury narratives. Injury Prevention, 407-414.
Mingoti, S. A., & Matos, R. A. (2012). Clustering Algorithms for Categorical Data: A Monte Carlo Study. International Journal of Statistics and Applications, 24-32.
Mucha, V., Pales, M., & Sakalova, K. (2016). Calculation of the Capital Requirement Using the Monte Carlo Simulation for Non-life Insurance. Ekonomicky Casopis, 878-893.
Nagalla, R., Pothuganti, P., & Pawar, D. S. (2017). Analyzing Gap Acceptance Behavior at Unsignalized Intersections Using Support Vector Machines, Decision Tree and Random Forests. The 8th International Conference on Ambient Systems, Networks and
Nath, D. C., & Das, J. (2016). Modeling of Insurance Data through Two Heavy Tailed
Distributions: Computation of Some of Their Actuarial Quantities through Simulation from Their Equilibrium Distributions and the Use of Their Convolutions. Journal of Mathematical Finance, 378-400.
NCCI. (2015). State of the Line- Analysis of Workers' Compensation Results. National Council on Compensation Insurance (NCCI).
Occhionero, V., Ghersi, R., Prandini, L., Korpinen, L., & Gobba, F. (2017). The biomechanical overload of the upper limb: a neglected occupational hazard in animal facility operators. Ergonomics, 366-374.
Packová, V. (2015). Loss Distributions in Insurance Risk Management. Business Administration, 17-22.
Pawlak, H., & Nowakowicz-Dębek, B. (2015). Agriculture: accident-prone working environment. Agriculture and Agricultural Science Procedia, 209-214.
Peters, G. W., Targinox, R. S., & Wuthrich, M. V. (2017). Bayesian modelling, Monte Carlo sampling and capital allocation of insurance risks. Risks.
Pietilä, J., Räsänen, T., Reiman, A., Ratilainen, H., & Helander, E. (2018). Characteristics and determinants of recurrent occupational accidents. Safety Science, 269-277.
Polacheka, I., Fung, K., Putnam, K., Meltzer-Brody, S., & Vigoda, S. N. (2017). A latent class analysis of brief postpartum psychiatric hospital admissions. Psychiatry Research. Ravi, A., & Butar, F. B. (2010). An insight into heavy-tailed distribution. Journal of
Mathematical Science and Mathematics Education.
Rivas, T., Paz, M., Martin, J. E., Martias, J. M., Garcia, J. F., & Taboada, J. (2011). Explaining and Predicting Workplace Accidents Using data-mining Techniques. Reliability
Engineering and System Safety, 739-747.
Robert, K., Elisabeth, Q., & Josef, B. (2015). Analysis of occupational accidents with agricultural machinery in the period 2008–2010 in Austria. Safety Science, 319-328. Saha, D., Alluri, P., & Gan, A. (2015). Prioritizing Highway Safety Manual’s crash prediction
variables using boosted regression trees. Accident Analysis and Prevention, 133-144. Salguero-Caparros, F., Suarez-Cebador, M., & Rubio-Romero, J. (2015). Analysis of
investigation reports on occupational accidents. Safety Science, 329-336.
Sarkar, S., Vinay, S., Raj, R., Maiti, J., & Mitra, P. (2018). Application of Optimized Machine Learning. Computers and Operations Research, 1-15.
Sasidharan, L., Wu, K.-F., & Menendez, M. (2015). Exploring the application of latent class cluster analysis for investigating pedestrian crash injury severities in Switzerland. Accident Analysis and Prevention, 219-228.
Shaheed, M., & Gkritza, K. (2014). A latent class analysis of single-vehicle motorcycle crash severity outcomes. Analytic Methods in Accident Research, 30-38.
Shi, P., & Frees, E. W. (2010). Long-tail longitudinal modeling of insurance company expenses. Insurance: Mathematics and Economics, 303-314.
Shin, I., Oh, J.-B., & Yi, K. (2011). Workers' Compensation Insurance and Occupational Injuries. Safety and Health at Work, 148-157.
Sut, N., & Simsek, O. (2011). Comparison of regression tree data mining methods for prediction of mortality in head injury. Expert Systems with Applications, 15534–15539.
Szymendera, S. D. (2016). Workers’ compensation: Overview and issues (CRS Report R44580). Washington, DC: Congressional Research Service.
Tang, Q. (2007). Heavy Tails of Discounted Aggregate Claims in the Continuous-Time Renewal Model. Journal of Applied Probability, 285-294.
Tixier, A. J.-P., Hallowell, M. R., Rajagopalan, B., & Bowman, D. (2016). Application of Machine Learning to Construction Injury Prediction. Automation in Construction, 102-114.
Utterback, D. F., Schnorr, T. M., Silverstein, B. A., Spieler, E. A., Leamon, T. B., & Amick III, B. C. (2012). Occupational health and safety surveillance and research using workers' compensation data. Journal of Occupational and Environmental Medicine, 171-176. Utterback, D. F., Schnorr, T. M., Silverstein, B. A., Spieler, E. A., Leamon, T. B., & Amick III,
B. C. (2012). Occupational Health and Safety Surveillance and Research Using Workers’ Compensation Data. American College of Occupational and Environmental Medicine. Wang, J., Liu, B., Fu, T., Liu, S., & Stipancic, J. (2018). Modeling when and where a secondary
accident occurs. Accident Analysis and Prevention, https://doi.org/10.1016/j.aap.2018.01.024.
Wurzelbacher, S. J., Al-Tarawneh, I. S., Meyers, A. R., Timothy Bushnell, P., Lampl, M. P., Robins, D. C., Schnorr, T. M. (2016). Development of Methods for Using Workers’ Compensation Data for Surveillance and Prevention of Occupational Injuries Among State-Insured Private Employers in Ohio. American Journal of Industrial Medicine, 1087-1104.
Yi, W., Chan, A. P., Wang, X., & Wang, J. (2016). Development of an Early-warning System for Site Work in Hot and humid Environments: A Case Study. Automation in Construction, 101-113.
Zhang, H., Yu, P., Ren, J.-X., Li, X.-B., Wang, H.-L., Ding, L., & Kong, W.-B. (2017).
Development of novel prediction model for drug-induced mitochondrial toxicity by using naïve Bayes classifier method. Food and Chemical Toxicology, 122-129.
Zheng, Z., Lu, P., & Lantz, B. (2018). Commercial truck crash injury severity analysis using gradient boosting data mining model. Journal of Safety Research, 115-124.
Zylbersztajn, D. (2017). Agribusiness systems analysis: origin, evolution and research perspectives. RAUSP Management Journal, 114-117.
CHAPTER 2. ANALYZING LARGE WORKERS’ COMPENSATION CLAIMS USING GENERALIZED LINEAR MODELS AND MONTE CARLO SIMULATION
Manuscript to be submitted to the Decision Analytics Journal Fatemeh Davoudi Kakhkia, Steven A. Freemana, Gretchen A. Moshera
aAgricultural and Biosystems Department, Iowa State University, Ames, IA
Abstract
A fundamental role of insurance companies is providing financial protection. To meet that goal, insurance practitioners rely on statistical models to predict future claims. A major challenge in using historical data to forecast future claims costs is to find and fit proper statistical distributions that can explain the behavior of large volumes of claims amount and forecast the severity of future claims. This task is even more challenging when analyzing claims with lower frequency, but high costs. The aim of this paper was to investigate the use of predictive
generalized linear modeling techniques with heavy-tailed distributions to address this challenge. This study utilized claims with total incurred amounts equal to or more than $100,000, from a workers’ compensation claims dataset that includes occupational injuries in agribusiness industries in the Midwest of the United States from 2008 to 2016. Predictive generalized linear regression models were built with gamma, Weibull, and lognormal distributions. The penalized method used to fit models was lasso; models' goodness of fit was assessed by R2, RMSE, AIC, and BIC values. Then, Monte-Carlo simulation models were developed to check the performance of each predictive model in cost estimation of future cases. The results show that the generalized regression model with gamma distribution is the best fit and has the highest predictivity power (R2 = 0.79). In addition, the models detected that injury characteristics (type, cause, body part, nature) and worker’s occupation were predictive of elevated claims occurrence and costs. The conclusions of this study are useful for insurance companies to improve their results concerning
future claims inferences. They can also be used in modifying and estimating insurance pricing within high-risk agribusiness industries. Although the conclusions do not present a generalized character, the approach of this study can be used as a framework to forecast workers’
compensation claims amounts with rare, high-cost events in other industries. This work is useful for insurance practitioners concerned with statistical and predictive modeling in financial risk analysis.
Introduction
According to the National Council on Compensation Insurance Report (2015), among several types of insurance policies, workers' compensation insurance is considered as a unique line of business since it balances the interests of many system stakeholders to protect and retain their jobs from injured employees and their families to employers, medical providers, insurance companies, regulators, and states. There are three main types of workers’ compensation claims: medical only, temporary disability, and permanent disability, among which the greatest costs are imposed by permanent disability (Baldwin & McLaren, 2016). As an economic remediation industry with claims payments as the main cash-flow, the insurance industry provides a means of decreasing monetary loss by spreading or pooling the risk over many insurers (Achieng, 2010). The literature in insurance risk management concentrates on the efficiency of insurance
companies (Shi & Frees, 2010). Since insurance industry has high financial operating expenses, insurers, investors, and regulators are interested in models to understand the behavior of
expenses (Shi & Frees, 2010).
Workers’ compensation provides cash and covers medical and indemnity costs for workers who experience injuries or illness during their employment and provides benefits to the survivors of workers killed at work (Szymendera, 2016). The total incurred amount of a claim is
also called loss cost, which is defined as the proportion of the premium which covers losses and related expenses (Guelman, 2012).
Modeling insurance claims, with a high accuracy and prediction rate, is essential to insurance companies for several reasons. First, statistical modeling of insurance claims provides useful results in estimating loss cost which is important in financial planning in insurance industry (Guelman, 2012). Also, estimating loss cost is significant in actuarial practice of reserving, where portfolios may be formed that generate cash flows with expected values matching the liability cash flow (Engsner, Lindholm, & Lindskog, 2017). In addition, statistical modeling of insurance claims can produce interpretable results about the parameters that affect the workers’ health, which influence employers’ costs, and directly insurance premium setting costs, because injury record of an employer is used to revise premiums and set new pricing (Schwatka et al., 2017).
Generalized linear models with heavy-tailed distributions are widely recognized as an accepted framework for price modeling of insurance loss cost (Guelman, 2012; McCullagh & Nelder, 1989; Anderson et al., 2007; Haberman & Renshaw, 1996). According to Boland (2006), Achieng (2010), and Packová (2015), since insurance data holds large infrequent claim amounts, most heavy-tailed distributions can be used to model claim amounts including gamma, Weibull, exponential and lognormal. Frees (2014) and Nath and Das (2016) stated that applying
regression models with generalized distributions is useful in modeling skewed and fat-tailed data. Keatinge (1999) stated that exponential distribution gains better results in analyzing loss data. Ravi and Butar (2010) expressed that heavy-tailed distributions are a much better fit to financial data in comparison to the normal distribution as financial data are usually highly skewed. Nath and Das (2016) applied heavy-tailed distributions (Weibull and Burr) to a set of
motor insurance claim data due to the highly skewed nature of claims. Tang (2007) studied the tail behavior of a series of Pareto-type claims. Frees, Shi, and Valdez (2009) assessed the actuarial applications of statistical modeling to study the accident frequency, loss type, and severity by incorporating characteristics such as age, gender and driving history in automobile insurance claims. Meyers (2017) used historical loss claims data to predict future claim severity in general insurance using gamma and lognormal distributions because loss data contain
infrequent but large values which makes it different from normally distributed data.
Even though there is a great deal of literature on the statistical analysis of loss data with skewed nature, there is little research on modeling workers’ compensation claims with heavy-tailed distributions or on addressing the effect of both continuous and categorical variables on the cost of claims. This study focused on: (1) finding proper statistical distribution to explain the behavior of large claims in workers’ compensation data, (2) applying generalized linear
regression models (GLMs) with proper statistical distributions to detect the important variables that affect the claims’ escalation, and (3) applying Monte-Carlo simulation for the selected GLMs to estimate the future cost of similar incidents in agribusiness industries.
Data
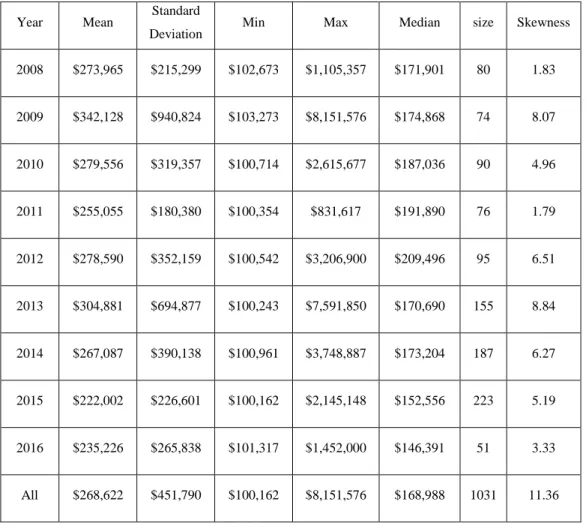
The dataset used in this study was obtained from a private insurance provider in the Midwest of the United States that specializes in insurance products for agribusiness industries. From 2008 to 2016, more than 35,000 claims were recorded in the dataset. Severe claims refer to those with total cost equal or over $100,000. Out of all the workers’ compensation claims in the eight-year period, 2.82% are classified as severe for both open and closed claims with a total incurred amount of $278,000,000. As shown in Table 1, descriptive statistics of the severe claims gives a better understanding of the skewed nature of the data. The high coefficient of skewness
suggests that generalized distributions are proper for modeling the workers’ compensation claims in the dataset (Packová, 2015). The target variable in this study is the summation of expenses, medical costs, and indemnity costs of each claim. The list of variables that were used as input were obtained from the dataset and are shown in Table 2.
Table 1: Descriptive Statistics of Claims by Year (2008-2016)
Year Mean Standard
Deviation Min Max Median size Skewness
2008 $273,965 $215,299 $102,673 $1,105,357 $171,901 80 1.83 2009 $342,128 $940,824 $103,273 $8,151,576 $174,868 74 8.07 2010 $279,556 $319,357 $100,714 $2,615,677 $187,036 90 4.96 2011 $255,055 $180,380 $100,354 $831,617 $191,890 76 1.79 2012 $278,590 $352,159 $100,542 $3,206,900 $209,496 95 6.51 2013 $304,881 $694,877 $100,243 $7,591,850 $170,690 155 8.84 2014 $267,087 $390,138 $100,961 $3,748,887 $173,204 187 6.27 2015 $222,002 $226,601 $100,162 $2,145,148 $152,556 223 5.19 2016 $235,226 $265,838 $101,317 $1,452,000 $146,391 51 3.33 All $268,622 $451,790 $100,162 $8,151,576 $168,988 1031 11.36
Table 2: Description of Predictive Variables
Variable Type Description
Ag-industry categorical
16 levels; grain, agronomy, refined fuel, feed milling, livestock, food processing, poultry, trucking, equipment dealers, greenhouse, biofuel,
farm stores, fruit and vegetables, grain milling, dairy
Gender categorical Male, female, unidentified
Occupation categorical 104 levels; grain elevator operators, poultry producers, bakery operation, packing house operation, etc.
Injury categorical
7 levels; death, major permanent partial disability, medical only, minor permanent partial disability, permanent partial disability, permanent
total disability, temporary total, or temporary partial disability
Body group categorical 6 levels; head, lower extremities, multiple body parts, neck, trunk, upper extremities
Cause
group categorical
9 levels; burn or scald-heat or cold exposure-contact with, caught in/under/between, cut/puncture/scrape/injured by, fall/slip/trip injury, motor vehicle, strain, striking against/stepping on, struck or injured by,
miscellaneous causes Nature
group categorical
3 levels; multiple injuries, occupational diseases or cumulative injury, specific injury
Body part categorical 49 levels; abdomen, ankle, hip, eye(s), buttocks, internal organs, toes, upper leg, teeth, spinal cord, pelvis, soft tissues etc.
Cause categorical
59 levels; chemicals, fire or flame, dust/gases/fumes/vapors, lifting, machinery, reaching, pushing, or pulling, temperature extremes,
jumping or leaping, stationary objects, etc.
Nature categorical
29 levels; dislocation, concussion, burn, amputation, inflammation, laceration, vision loss, rupture, poisoning, freezing, electric shock,
respiratory disorders, foreign body, fracture, etc.
Age continuous min: 17.8 years old; max: 81.7 years old
Methods Generalized linear regression modeling
Although a lot of regression techniques consider the underlying distribution of the response variable as normal, there are situations where the assumption of normality is not appropriate as in insurance claims that are often highly-skewed in nature (Crotty & Barker, 2014). Using generalized regression methods give a straightforward way to analyze the effect of many factors on the target variable without the restriction of the normality assumption
(Cerchiara, Edwards, & Gambini, 2008). According to James (2013), applying generalized regression to accommodate non-linear relationships among variables is an alternative to least square regression method due to higher prediction accuracy, and easier model interpretability by removing irrelevant variables.
Penalization methods and variable selection
The need for using penalization methods (or fitting procedures) in regression modeling is justified by the willingness to accept some bias to reduce variance and avoid overfitting (Crotty & Barker, 2014). Overfitting means that the model works well on the observed data but performs poorly on a new dataset. Penalization methods can deal with this issue through subset selection and shrinkage.
According to Tibshirani (1996), generalized linear models have distinct advantage in terms of inference, and usefulness on real-world problems in comparison to non-linear models (McCullagh & Nelder, 1989). In order to gain better results in terms of prediction accuracy and model interpretability, penalization methods are important. Regarding prediction accuracy, by constraining or shrinking the estimated coefficients, the overfitting is significantly reduced. This highly improves the prediction of the response variable by applying the model in a new dataset.
Regarding the model interpretability, by using the shrinkage method, selecting a subgroup of all the input variables leads into omitting irrelevant, and less relevant variables (to the response variable), and therefore, the unnecessary complexity of the model in decreased.
Based on the work of Crotty and Barker (2014), a summary of various penalization methods and their relationships are depicted in Table 3. The shrinkage (also known as regularization) is preferred since it has the effect of decreasing the variance by shrinking irrelevant estimated coefficients towards zero (James, 2013).
Table 3: Penalization Methods vs Selection and Shrinkage (Crotty & Barker, 2014)
Method Selection Shrinkage
Maximum Likelihood no no
Ridge no yes
Forward Selection yes no
Lasso yes yes
Elastic Net yes yes
Tibshirani (1996) introduced the least absolute shrinkage selection operator (lasso). It is a popular penalization technique as it allows simultaneous estimation and variable selection (Zou, 2012). The lasso estimate is defined by
𝛽̂𝑙𝑎𝑠𝑠𝑜 = 𝑎𝑟𝑔𝑚𝑖𝑛 ∑𝑁𝑖=1( 𝑦𝑖 − 𝛽0 − ∑𝑝𝑗=1𝑥𝑖𝑗𝛽𝑗) 2 Subject to ∑𝑝 𝑗=1|𝛽𝑗|≤ 𝑡
Therefore, lasso is used as the fitting procedure applied in building regression models in this study. By using the lasso method for fitting the generalized regression models, a less complex final equation is gained for each model which includes only a subset of relevant variables as main predictors of the target variable, or the loss cost in this study.
Quantitative measure of performance for model selection
Model selection is a process of seeking the model in a set of candidate models that gives the best balance between model fit and complexity (Burnham & Anderson, 2003). The
comparison criterion should be based on knowledge and history of the data as well as personal preference. Akaike information criterion (AIC) and the Bayesian information criterion (BIC) are the most common model selection methods; AIC finds the most predictive model while BIC finds the true model as the final choice (Burnham & Anderson, 2004).
Other measures of model performance are R2 and RMSE. Values of R2 range from 0 to 1, where 1 is a perfect fit and 0 means there is no gain by using the model over using fixed
background response rates. It estimates the proportion of the variation in the response around the mean that can be attributed to terms in the model rather than to random error. The root means square error (RMSE) is defined as the standard deviation of the response variable.
When it comes to comparing models, the one with the highest R2 and the lowest RMSE is preferred. The statistical details of all the model selection criteria are shown in Table 4 (where k is the number of estimated parameters in the model and n is the number of observations in the dataset).
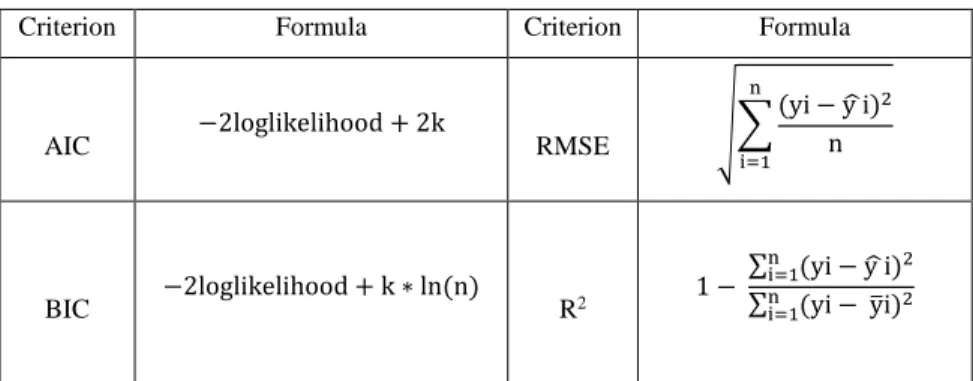
Table 4: Model Comparison Criteria
Criterion Formula Criterion Formula
AIC −2loglikelihood + 2k RMSE √∑
(yi − y ̂i)2 n n i=1 BIC −2loglikelihood + k ∗ ln (n) R2 1 − ∑n (yi − y ̂i)2 i=1 ∑n (yi − y̅i)2 i=1