in drowsiness detection systems using
generative adversarial networks (GANs)
Submitted in partial fulfillment of the requirements of Doctor of Philosophy Degree (Computer Eng.)
By
Mkhuseli Ngxande Student No. 216077070
Under the supervision of: Prof. Jules-Raymond Tapamo
&
Dr MichaelBurke
University of Kwa-Zulu Natal February 2020
OF AGRICULTURE, ENGINEERING AND
SCIENCE DECLARATION
The research described in this thesis was performed at the University of KwaZulu-Natal under the supervision of Prof. Jules-Raymond Tapamo and Dr Michael Burke. I hereby declare that all materials incorporated in this thesis are my own original work except where the acknowledgement is made by name or in the form of reference. The work contained herein has not been submitted in part or whole for a degree at any other university.
Signed:
Name: Mkhuseli Ngxande Date: February 2020
As the candidate’s supervisor, I have approved this thesis for submission.
Signed:... Name: Prof. Jules-Raymond Tapamo Date: February 2020
As the candidate’s co-supervisor, I have approved this thesis for submission.
Signed:
Name: Dr Michael Burke Date: February 2020
OF AGRICULTURE, ENGINEERING AND
SCIENCE DECLARATION 2 - PUBLICATIONS
I, Mkhuseli Ngxande, declare that the following publications from part of this dissertation.1. M. Ngxande, J.-R. Tapamo, and M. Burke, “Driver drowsiness detection using behav-ioral measures and machine learning techniques: A review of state-of-art techniques,” in2017 Pattern Recognition Association of South Africa and Robotics and Mechatronics (PRASA-RobMech), 2017, pp.156–161 [Online]. Available: https://ieeexplore.ieee.
org/document/8261140/
2. M. Ngxande, J.-R. Tapamo, and M. Burke, “DepthwiseGANs: Fast Training Generative Adversarial Networks for Realistic Image Synthesis ,” in2019 Southern African Universities Power Engineering Conference/Robotics and Mechatronics/Pattern Recognition Association of South Africa (SAUPEC/RobMech/PRASA), 2019, pp.111–116 [Online]. Available:
https://ieeexplore.ieee.org/document/8704766
3. M. Ngxande, J.-R. Tapamo, and M. Burke, “Bias Correction in population-based Driver Drowsiness Dataset through Generative Adversarial Network,”IEEE Transactions on Intel-ligent Transportation Systems, 2019 [Under Review]
4. M. Ngxande, J.-R. Tapamo, and M. Burke, “Bias Remediation in Driver Drowsiness Detection systems using Generative Adversarial Networks,”IEEE Access, 2019 [Under Review]
Signed:...
This thesis is dedicated to my Grandmother.
This work was supported and funded by the Council for Scientific and Industrial Research (CSIR) through a studentship programme. I am grateful to have this opportunity to fulfill my dreams. To my supervisor, Prof. Tapamo, thank you for giving me this opportunity to work with you and share ideas. I have learned a lot in this three year journey of my Ph.D. studies. To my co-supervisor, Dr Michael Burke, I am deeply grateful for your support, chats, and quick responses. Furthermore, thank you for your undivided time and dedication through this period of my research and from believing in me.
I am grateful to the image processing group where we share ideas and our difficulties. They have introduced me to a lot of industrial ethics which will help to expand my career. The weekly group meetings have strengthened the importance of teamwork and provided support in how to address problems.
To my family, this thesis is for you because you believed in me and my dreams. It was difficult to leave my comfort zone and step out on own but your support and guidance has made it not only possible, but worthwhile.
Road accidents contribute to many injuries and deaths among the human population. There is substantial evidence that proves drowsiness is one of the most prominent causes of road accidents all over the world. This results in fatalities and severe injuries for drivers, passengers, and pedestrians. These alarming facts are raising the interest in equipping vehicles with robust driver drowsiness detection systems to minimise accident rates. One of the primary concerns of motor industries is the safety of passengers and as a consequence they have invested significantly in research and development to equip vehicles with systems that can help minimise to road accidents. A number research endeavours have attempted to use Artificial intelligence, and particularly Deep Neural Networks (DNN), to build intelligent systems that can detect drowsiness automatically. However, datasets are crucial when training aDNN. When datasets are unrepresentative, trained models are prone to bias because they are unable to generalise. This is particularly problematic for models trained in specific cultural contexts, which may not represent a wide range of races, and thus fail to generalise. This is a specific challenge for driver drowsiness detection task, where most publicly available datasets are unrepresentative as they cover only certain ethnicity groups. This thesis investigates the problem of an unrepresentative dataset in the training phase of Convolutional Neural Networks (CNNs) models. Firstly, CNNs are compared with several machine learning techniques to establish their superior suitability for the driver drowsiness detection task. An investigation into the implementation ofCNNswas performed and highlighted that publicly available datasets such as NTHU, DROZY and CEW do not represent a wide spectrum of ethnicity groups and lead to biased systems. A population bias visualisation technique was proposed to help identify the regions, or individuals where a model is failing to generalise on a picture grid. Furthermore, the use of Generative Adversarial Networks (GANs) with lightweight convolutions called Depthwise Separable Convolutions (DSC) for image translation to multi-domain outputs was investigated in an attempt to generate synthetic datasets. This thesis further showed thatGANscan be used to generate more realistic images with varied facial attributes for predicting drowsiness across multiple ethnicity groups. Lastly, a novel framework was developed to detect bias and correct it using synthetic generated images which are produced by GANs. Training models using this framework results in a substantial performance boost.
Declaration of Authorship i
List of Publications ii
Acknowledgements iv
Abstract v
Contents vi
List of Figures viii
List of Tables x
List of Algorithms xi
List of Acronyms xii
1 Introduction 1
1.1 Motivation. . . 1
1.2 Problem Statement . . . 4
1.3 Aims and Objectives . . . 4
1.4 Contributions to knowledge . . . 5
1.5 Organisation . . . 6
2 Background and Context 9 2.1 Fundamental Concepts of Drowsiness . . . 10
2.1.1 What is drowsiness ? . . . 10
2.1.2 Causes of drowsiness and its signs . . . 11
2.1.2.1 Signs of drowsiness. . . 12
2.1.3 Countermeasures against drowsiness . . . 12
2.1.4 Measurement Methods for Drowsiness Detection . . . 13
2.1.4.1 Physiological Methods . . . 13 2.1.4.2 Subjective Methods . . . 15 2.1.4.3 Vehicle-Based Methods . . . 17 2.1.4.4 Behavioural Methods . . . 18 2.1.4.5 Meta-Analysis . . . 23 2.1.4.6 Hybrid Methods . . . 25
2.2 Commercially Available Systems . . . 26
2.3 Conclusion. . . 27
3 Fundamentals of Deep Learning 30 3.1 Artificial Neural Networks . . . 30
3.2 Convolutional Neural Networks . . . 31
3.2.1 Convolution Layer . . . 32
3.2.2 Activation Functions and Non-linearity. . . 33
3.2.3 Pooling Layers . . . 35
3.2.4 Fully-Connected Layers . . . 36
3.2.5 Batch normalisation . . . 36
3.3 Neural Network Training. . . 37
3.3.1 Loss Function . . . 37
3.4 Optimisation and Learning Rates . . . 38
3.5 Regularisation. . . 41
3.6 CNNs Visualisation. . . 42
3.7 Transfer Learning . . . 44
3.8 Conclusion. . . 45
4 Intersectional accuracy differences in drowsiness detection systems 47 4.1 Related Work . . . 47
4.2 Bias in Machine Learning . . . 49
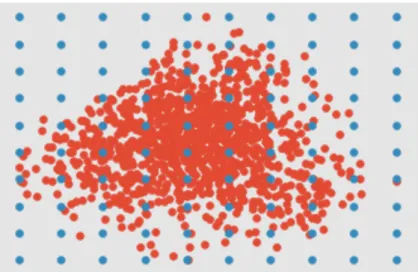
4.3 Population Bias Visualisation . . . 50
4.4 Datasets . . . 53
4.5 Experiments . . . 55
4.5.1 Architectures . . . 55
4.6 Results. . . 58
4.7 Conclusion. . . 63
5 Generative Adversarial Network (GAN)-based data augmentation 66 5.1 Generative Adversarial Networks (GANs) . . . 66
5.2 Conditional Generative Adversarial Networks (Conditional Generative Adversarial Network (CGAN)) . . . 69
5.3 Comparing Performance of GANs . . . 71
5.4 Depthwise Separable Convolutions . . . 72
5.5 Experiments . . . 73 5.5.1 Architectures . . . 73 5.5.2 Datasets . . . 74 5.5.3 Training process . . . 75 5.6 Results. . . 75 5.6.1 Results on CelebA . . . 77
5.6.2 Results on RaFD and Stirling . . . 80
5.7 Conclusions . . . 81
6 GAN-based bias correction 84 6.1 Boosting . . . 85
6.2 Data Augmentation . . . 86
6.3 Proposed Framework . . . 87
6.3.1 GAN Architecture . . . 88
6.3.2 CNN Architecture . . . 89
6.3.3 Population Bias Visualisation . . . 90
6.3.4 Sampler . . . 90
6.4 Experiments and Results. . . 91
6.4.1 Training . . . 91
6.4.2 Results . . . 92
6.4.3 GAN Augmentation Results . . . 92
6.4.4 Learning rate Results . . . 93
6.4.5 Population Bias Visualisation Results . . . 95
6.5 Conclusion. . . 97
7 Conclusions and future work 99 7.1 Conclusion. . . 99
7.2 Limitations . . . 100
7.3 Future work . . . 100
1.1 Road traffic fatality rates . . . 2
1.2 Numbers of road crashes in South Africa . . . 2
1.3 Percentages of road accidents by provinces . . . 3
2.1 Readings of Electroencephalogram (EEG) signals on a person . . . 14
2.2 Driver drowsiness detection process . . . 20
2.3 Meta-Analysis Report . . . 24
2.4 Bayerische Motoren Werke (BMW) active driving assistant. . . 26
2.5 Mercedes-Benz attention assist . . . 27
3.1 Convolution inputs . . . 33
3.2 Sigmoid graph. . . 33
3.3 Hyperbolic Tangent (Tanh) graph. . . 34
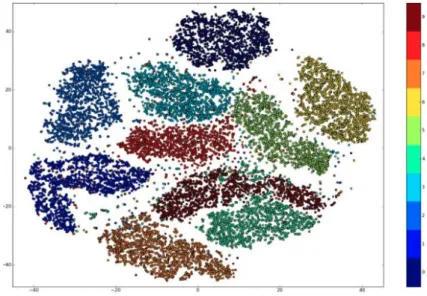
3.4 Layer-Activation . . . 42 3.5 Conv Filter . . . 43 3.6 Activation maps . . . 43 3.7 Saliency maps . . . 44 3.8 t-SNE . . . 44 4.1 2-dimensional grid . . . 52
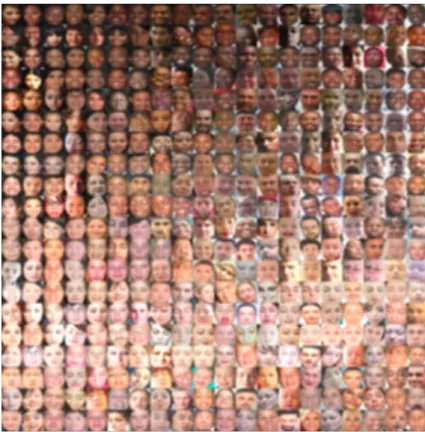
4.2 Organised Principal Component Analysis (PCA) image. . . 53
4.3 NTHU dataset . . . 54
4.4 ULg Multimodality Drowsiness Database (DROZY) . . . 54
4.5 Closed Eyes In The Wild (CEW)dataset . . . 54
4.6 South African dataset . . . 55
4.7 ResNet. . . 56
4.8 Visual Geometry Group (VGG)-19 . . . 56
4.9 Visual Geometry Group-FaceNet (VGG-Face) . . . 56
4.10 Architecture . . . 57
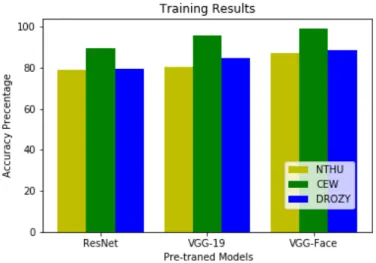
4.11 Training results . . . 57
4.12 Testing results . . . 58
4.13 Saliency results . . . 60
4.14 Testing results on Resnet model . . . 62
4.15 Testing results on VGG model. . . 62
4.16 Testing results on VGG-Face model . . . 63
5.1 Simple GANs architecture . . . 67
5.2 Deep Convolutional Generative Adversarial Network (DCGAN) architecture . . . 68 viii
5.3 DSC vs Standard Convolutions . . . 73
5.4 DepthwiseGAN architecture . . . 74
5.5 Training phase of DepthwiseDG . . . 76
5.6 Training phase of DeeperDepthwiseG . . . 78
5.7 CelebA results . . . 79
5.8 Fréchet Inception Distance (FID) scores of CelebA . . . 79
5.9 FID scores for RaFD dataset . . . 80
5.10 FID score for Stirling dataset . . . 81
5.11 Synthetic data for RaFD and Stirling dataset . . . 81
6.1 Proposed Framework . . . 88
6.2 GAN Architecture . . . 89
6.3 GAN generated image with different facial attributes . . . 94
6.4 Visualisation from Standard datasets . . . 96
2.1 The Karolinska Sleepiness Scale (KSS) Sleepiness Scale . . . 16
2.2 The Stanford Sleepiness Scale (SSS) ratings . . . 16
2.3 Multiple Sleep Latency Test . . . 17
2.4 Convolutional Neural Network (CNN) based detection systems . . . 21
2.5 Support Vector Machines (SVMs) based detection systems . . . 22
2.6 Hidden Markov Models (HMM) based work related . . . 23
4.1 Accuracies in experimentation . . . 58
5.1 GANsArchitecture information . . . 74
6.1 Generator network architecture information . . . 92
6.2 Discriminator network architecture information . . . 92
6.3 Learning rate - accuracy tradeoff . . . 93
6.4 Model classification accuracy . . . 96
1 Image overlay generation . . . 52 2 GAN original algorithm. . . 68 3 Model Training . . . 77
AdaBoost Adaptive Boosting
Adam Adaptive Moment Estimation
ADAGRAD Adaptive Gradient
ADADELTA Adaptive Learning Rate Method
ANN Artificial Neural Network
ArtGAN Artwork Synthesis with Conditional Categorical GAN
AUC Area under the ROC Curve
ACCV Asian Conference on Computer Vision
BN Batch Normalization
BMW Bayerische Motoren Werke
BC-GAN Bayesian Conditional Generative Adversarial Network
BAC Blood Alcohol Concentration
CIFAR-10 Canadian Institute For Advanced Research-10
CEW Closed Eyes In The Wild
COCO 2 Common Objects in Context
CGAN Conditional Generative Adversarial Network
CNNs Convolutional Neural Networks
CNN Convolutional Neural Network
DAGAN DataAugmentation Generative Adversarial Networks
DCGAN Deep Convolutional Generative Adversarial Network
DDD Deep Drowsiness Detection
Deep-LSTM Deep Long-Short-Term Memory Network
DNN Deep Neural Networks
DSC Depthwise Separable Convolutions
DGAN DrowsyGAN
DROZY ULg Multimodality Drowsiness Database
ECG Electrocardiogram
EEG Electroencephalogram
EMG Electromyogram
EOG Electrooculograms
ESS Epworth Sleepiness Scale
Eye-Chimera Eye-Chimera Database
EAR Eye Aspect Ratio
FFT Fast Fourier Transform
FI-DDD Forward Instant Driver Drowsiness Detection
FID Fréchet Inception Distance
FCNN Fully-Convolutional Neural Network
GANs Generative Adversarial Networks
GAN Generative Adversarial Network
GBoost Gradient Tree Boosting
HMM Hidden Markov Models
ILSVRC ImageNet Large Scale Visual Recognition Competition
ICA Independent Components Analysis
IsoMap Isometric Mapping
IR Infra-red
IS Inception Score
KSS Karolinska Sleepiness Scale
LSUN Large-scale Scene Understanding
Leaky-ReLU Leaky Rectified Linear Units
AlignGAN Learning to Align Cross-Domain Images with Conditional Generative Adversarial Networks
LSGAN Least Squares Generative Adversarial Networks
LBP Local Binary Patterns
LLE Locally Linear Embedding
MRI Magnetic Resonance Imaging
MSLT Multiple Sleep Latency Test
NTHU National Tsing Hua University Dataset
PReLU Parametric Rectified Linear Units
PERCLOS Percentage of the Eye Closure
PBV Population Bias Visualisation
PCA Principal Component Analysis
PVTs Psychomotor Vigilance Tests
RFID Radio Frequency Identification
ReLU Rectified Linear Units
RTMC Road Traffic Management Corporation
RSU Roadside Unit
RMSprop Root Mean Square Propagation
SVD Singular Value Decomposition
SWAI Sleep-Wake Activity Inventory
SSS Stanford Sleepiness Scale
StarGan Unified Generative Adversarial Networks for Multi-Domain Image-to-Image Translation
SGD Stochastic Gradient Descent
SVHN Street View House Numbers
SVMs Support Vector Machines
t-SNE t-Distributed Stochastic Neighbor Embedding
Tanh Hyperbolic Tangent
V-I vehicle-infrastructure
V-V Vehicle-Vehicle
VGG Visual Geometry Group
VGG-Face Visual Geometry Group-FaceNet
WGAN Wasserstein Generative Adversarial Networks
WGAN-GP Wasserstein Generative Adversarial Networks with Gradient Penalty
WHO World Health Organization
XGBoost A Scalable Tree Boosting System
YawnDD Yawn Detection Dataset
1.1
Motivation
The significant cost of traffic accidents around the world is estimated to be billions of rands, as reported by the American National Highway Traffic Safety Administration [118]. The World Health Organization (WHO) reveals that South Africa is among the African countries with the highest road traffic accident fatality ratio, of about 26.6 per 100 000 of the population [186]. Arrive Alive reported that the first road collision in South Africa occurred in Maitland, Cape Town in October 1903 [9]. Since then, there has been a drastic increase in road accident occurrence.
In 2006, the Road Traffic Management Corporation (RTMC) reported an increase in road accidents to approximately 12 454 from 8 802 fatal crashes in 2001 [139]. Figure 1.1 shows the fatality ratio analysis that was carried out by the WHO, highlighting the high rate of car accidents in Africa.
Figure 1.2shows numbers of road accidents over a ten year period from 2007 to 2016 in South Africa. The contribution of each province to the percentage of accidents in South Africa in the year 2016 is illustrated in Figure 1.3 [157]. This shows that Gauteng and KwaZulu-Natal provinces had the highest accidents rates in 2016. Moreover, 1 700 people died on South African roads during festive season of 2016 alone, which is a 5% increase from the previous season [115]. Statistics South Africa has shown that one of the major causes of accidents is driver drowsiness [182]. In addition, statistics have shown the top three causes of accidents on South African roads are distracted drivers (for example, a driver using a phone), speeding, or driving under the influence of alcohol [96].
Figure 1.1: Road traffic fatality rates per 100 000 people per region [139].
Figure 1.2: Numbers of road crashes in South Africa from 2007 to 2016 [157].
As machine learning increasingly becomes a technology that is used across many tasks in people’s lives, the automobile industry has started to develop systems aimed at reducing the high rate of road accidents. Deep learning is a sub-field in machine learning that is actively being investigated, along with techniques that can communicate with car electronics to alert a driver of any anomalies. Examples of these systems include collision detection, drowsiness detection and driver skill monitoring [64].
Despite the great success of driver aids in the motor industry, there is evidence to show that these techniques can fail, which may then lead to accidents. A recent case involved an accident
Figure 1.3: Percentages of road accidents per province in the 2016 financial year [157].
caused by a Tesla car in the United States of America, where the driver died while the car was in autopilot mode and crashed into a car-lane divider [13]. Moreover, an Uber self-driving car collided and killed a pedestrian while in autonomous mode in Tempe, Arizona [50].
As deep learning starts to gain traction in the car industry, accidents arising from poor decision making by deep learning systems have become a concern. In particular, systems like driver drowsiness detection could yield incorrect results based on the training data used. This thesis investigates intersectional accuracy differences in drowsiness detection systems and the bias implications caused by using unrepresentative training datasets. It further develops a novel framework that remedies this effect by using synthetic data and a re-sampling technique to generate fairer training datasets, allowing for more accurate models.
Computer vision is a field of research where there are multiple methods to approach numerous visual problems such as face recognition using machine learning techniques. However, there are concerns surrounding the use of people’s faces on training machine learning techniques. In addition, there are privacy issues and questions surrounding faces such as who will own the collected image data, how will this data be shared and stored to prevent the misuse. Companies such as Clearview, have collected data without people’s concerns and that goes further to data-mine more images on their social networks [78]. In addition, some researchers use machine learning to train on faces of people to violate their rights by deciding whether a person is gay or
not [79]. This is a clear indication that there is a need for privacy regulations when dealing with human data and European United has provided some ethics in artificial intelligence [168]. In this thesis, images are collected from publicly available channels and blurred to prevent the violation of using people’s faces.
1.2
Problem Statement
Currently, driver drowsiness detection systems are only available in high-end vehicle models, which are expensive. However, there is an increased demand for accurate and efficient driver drowsiness detection systems on all vehicle models to reduce the rate of road accidents. This has led to the development of deep learning techniques to support this demand. However, deep learning based drowsiness detection systems can be flawed, due to bias that can be influenced by many factors including training data, parameters and the choice of the algorithm used. This work investigates the effects of using publicly available unrepresentative training datasets and shows how this impacts the performance of drowsiness detection systems when tested in an African context. An analysis of current drowsiness detection systems and their training datasets shows that these systems tend to work better on certain ethnicities (light skinned). This poses a problem in the South African context because imported cars with these systems can fail if trained on datasets captured in different demographics. This is due to the fact that South Africa has a diversity of races with different skin complexions. Most individuals in South Africa have dark skin and there is no drowsiness detection dataset that covers dark skinned drivers. The aim of this research is to provide an approach that can close this gap in training data for driver drowsiness detection systems. A novel framework is introduced to remedy the bias in these training datasets.
1.3
Aims and Objectives
The main aim of this research is to develop a framework that corrects aCNNtrained for prediction usingGANsfor targeted data augmentation based on a population bias visualisation strategy that groups faces with similar facial attributes and highlights where the model is failing. The primary objectives are:
1. To investigate which machine learning technique should be used for the driver drowsiness detection task and the availability of training datasets.
2. To develop aCNN model for the detection of driver drowsiness detection.
3. To develop a data augmentation technique for balancing the training dataset where the CNNmodel fails to generalise.
4. To develop a framework that remedies generalisation failures in under represented population groups in the training dataset, and which boosts the performance of drowsiness detection across all population groups.
1.4
Contributions to knowledge
The contributions in this thesis can be summarised as follows:
• A meta-analysis study reviewing machine learning techniques in the detection of drowsiness was completed. This study showed thatCNNsproduce more accurate results when compared to the other machine learning techniques. This study further showed that there is a lack of benchmark datasets for driver drowsiness detection.
• ADNN was trained on publicly available datasets for the driver drowsiness detection task and was used to show that models trained on publicly available datasets exhibit traits of bias when tested in South African contexts.
• A novel population bias visualisation technique is proposed. The visualisation technique highlights individuals and population groups where the model fails to generalise.
• The training speed of GANs is improved by incorporating DSC, and findings on the importance of capacity are provided.
• Synthetic GAN images are used for data augmentation, relying on the translation of drowsiness facial features.
• A framework is proposed to remediate bias in the training datasets used for driver drowsiness detection tasks. This framework can also be used in other tasks that have unrepresentative datasets.
1.5
Organisation
The structure of this thesis is as follows. It should be noted that each chapter has its own literature review, that is based on the chapter’s objective, before presenting implementation details and results. In Chapter 2, fundamental concepts and a review of driver drowsiness detection systems and techniques used are discussed. For driver drowsiness detection systems and the techniques used, special attention is paid to those methods reported as yielding the most accurate results. This is accomplished by conducting a meta-analysis on recent papers. Behavioural methods for driver drowsiness detection systems are of primary interest in this thesis as they are vulnerable to intersectional bias.
Chapter3introduces the fundamentals of machine learning and also the components that build up the CNNnetwork. Training techniques are also discussed in an attempt to improve the accuracy of the network. Transfer learning techniques are also introduced to help where there is limited training data. Chapter 4discusses the implementation ofCNNsin-depth and introduces publicly available datasets for the driver drowsiness detection task. A new population bias visualisation technique that uses Principal Component Analysis (PCA) as a dimensional reduction technique, to identify bias in deep learning models trained for drowsiness detection, is presented. Here, trained model accuracy is overlayed on a grid of faces organised by similarity. This allows for the identification of population groups where the model does not generalise well.
In Chapter 5, a method that can be used to generate multi-domain realistic images from an input image is introduced. GANsare a generative model that consist of two networks competing with one another to produce realistic outputs. The generator network was modified by using the DSC technique to reduce the training time while retaining the quality of the produced synthetic images. The fundamentals ofGANsare discussed and related work is introduced.
In addition, Chapter6 proposes a novel framework that remedies generalisation failures under represented population groups in the training dataset, which boosts the performance of drowsiness detection across all population groups. The framework is composed of a GANarchitecture for generating synthetic data, aCNNmodel for detecting drowsiness, a population bias visualisation technique to highlight where the model is failing and a sampler to target these population groups and search for similar images in the synthetic data.
Finally, Chapter7 concludes the thesis by reviewing the results achieved. This is followed by a discussion on future work and expansion of the research field of road safety, with a particular focus on human behaviour.
We all use transportation to reach our final destinations, whether going to school, a workplace or on vacation. Driving for long hours without taking breaks can be dangerous and leads to accidents. Most accidents are caused by not only drowsiness, but also distraction, weather conditions, high speeds, and alcohol usage. To date, the number of road accidents has increased each year. High-end car models are often manufactured with technologies that can detect whether the driver is falling asleep and can warn the driver. In addition, the motor industry is rapidly growing and improving safety features because driver and passenger safety is among their primary concerns.
This thesis focuses on behavioural methods to measure the level of drowsiness in drivers. Be-havioural methods extract facial information which can be useful when used with deep learning techniques. Deep learning techniques are increasingly used to predict the driving state efficiently using the output from behavioural methods. Other methods are also discussed as they can be used in combination with behavioural methods to yield more accurate and robust drowsiness detection systems.
This chapter starts by introducing the fundamental concepts behind drowsiness as these be-havioural cues are of importance to this research. This is followed by a discussion of signs and countermeasures that minimise the chances of falling asleep while driving. A number of commercially available driver drowsiness detection systems are discussed.
This chapter also provides a systematic literature review that was conducted on machine learning techniques for driver drowsiness detection, along with a meta-analysis on the performance of these techniques. Importantly, the results from this meta-analysis showed thatCNNsyield more accurate results than alternative machine learning techniques, and are growing in popularity.
2.1
Fundamental Concepts of Drowsiness
This section briefly explains the fundamentals of driver drowsiness, which play an important role in identifying the methods investigated in this research.
2.1.1 What is drowsiness ?
Drowsiness or sleepiness are interchangeable terms that define a biological state where the body is in the transition from a state of wakefulness to a sleeping state [161]. It is a biological process that has a drastic effect on the body and mind of a person. In this state, the driver can lose focus on the road because of a lack of concentration. Drowsiness is often circumstantial, with many aspects of the driver’s state and the environment being potential causes. For example, driving for long hours without taking breaks or on a highway at night can induce drowsiness. The body has a biological clock that alerts the person when there is a change in the body such as being hungry or a change in body temperature [44]. The process of being awake and being asleep is controlled both by a circadian pacemaker and by homeostatic factors. Homeostatic factors are those that control circadian rhythms to regulate the timing of states of sleep and wakefulness.
Being awake for long hours builds pressure that triggers the sleeping state, which is difficult to resist [39]. The circadian pacemaker is the internal clock that completes a cycle every 24-hours. This allows a person to prepare for changes in the physical environment that are associated with day or night activities [179]. For people between the ages of 18 and 65 years, normal sleeping duration ranges between 7 and 9 hours [62]. Sleep deprivation leads to sleep debt, which accumulates and can be observed through the emotions and mental state of a person [105]. A driver that drives for 17 hours without taking breaks has abilities that are equivalent to that of a driver with a Blood Alcohol Concentration (BAC) of 0,05%. After driving for more than 21 hours, the driver’sBAC equivalence is about 0,10% which is above South Africa’s legal level of 0.08% [82].
There are many internal and external factors that can interrupt a sleeping schedule. External factors that contribute to changing sleeping routines include work shifts, the effects of light, and driving times [73, 120]. On the other hand, internal factors include lifestyle (such as the intake of alcohol), effects of medication, and poor sleep quality (including insomnia).
2.1.2 Causes of drowsiness and its signs
There are many factors that influence the drowsy state of drivers. These effects can be caused by drivers themselves or by environmental conditions.
Work Shift Schedules
Shift-schedules are often divided into day or night shifts. Shifts vary between different companies and depend on the type of work being done. Night shifts can interrupt the normal sleep-wake cycle that is controlled by a circadian pacemaker. This results in a change of sleeping routines according to the shifts worked. The length and quality of sleep on a night shift is affected by physiological factors which include body temperature.
Light Effect
Light is an external factor that contributes to the sleep routine changes by influencing the need for sleep or by making it difficult to sleep [20]. Light influences the circadian cycle through cells in the retina of the eyes. These cells work together with rods and cones which are responsible for telling the brain when it is night or day, thereby setting the sleeping pattern. Levels of drowsiness in most drivers increase at night because there is no light effect and also due to the temperature inside the car. When driving at night, retina cells send signals to the brain that it is night time and the body will start to adjust and prepare for a sleeping state.
Lifestyle and Medication
The intake of medication such as over the counter prescriptions can have an impact on cognitive and driving abilities, which can lead to road accidents [101]. People often do not take serious note that many medications have side effects. Moreover, every person reacts differently to medication, for example in some cases medication will cause the body to react, resulting in high blood pressure or blurred vision [101]. Alcohol is the most commonly used form of drug consumed by drivers and its side effects include loss of concentration, blurred vision, poor judgement, and drowsiness [47]. Alcohol also affects sleeping cycles and physiological processes that occur during the sleeping process. The effects of alcohol in the human body has been extensively studied and early experiments were performed by Kleitman in 1939 [140].
2.1.2.1 Signs of drowsiness
There are common signs that can indicate a person is drowsy, and these typically involve facial expressions. Some of these features are obvious and are not difficult to notice, such as the following:
• Frequently yawning;
• Being unable to keep eyes open and reduced eye blinking rate;
• Swaying the head forward;
• Eyes start to itch and become red;
• Paying less attention than usual to road markings and signs;
• Crossing of road lanes and a tendency to accelerate; and
• A tendency to stop too close to cars up ahead.
2.1.3 Countermeasures against drowsiness
There are countermeasures that a person can take to prevent drowsiness. If a person needs to drive for a long distance, or perhaps at night, it is recommended to have sufficient sleep before the journey.
Consumption of Caffeine
Most people use caffeine products such as coffee, energy drinks, soft drinks, and tablets or capsules to avoid falling asleep [34, 28]. Although people think this is an effective solution, caffeine has a short-term effect, which last for only one to two hours and thereafter actually helps to induce sleep. Furthermore, it takes about thirty minutes to enter the bloodstream and for those who consume caffeine regularly, its effect can be minimal [65].
Taking Naps
The South African Traffic Department recommends that drivers should take naps during stops when on a long journey [138]. A nap of about 15- to 20 minutes in duration is enough to energise
the body, and also has an additional benefit in helping to overcome drowsiness after stretching your legs. Driving with a passenger on a long drive is also helpful because this person can keep the driver awake or alert the driver if they notice symptoms of drowsiness. An alarm could be also used to help alert the driver.
2.1.4 Measurement Methods for Drowsiness Detection
A number of methods used to detect and measure driver drowsiness state are currently being researched and implemented. These methods are grouped into four categories: physiological, behavioural, vehicle-based, and hybrid methods. Behavioural methods are of primary interest to this research and are currently being developed for detection of drowsiness using publicly available datasets for training and testing. The section below provides a brief survey of drowsiness detection methods in each of the above-mentioned categories.
2.1.4.1 Physiological Methods
Physiological methods are those that obtain direct information about the driver’s state by assessing their physical conditions. This can be done by using an electronic device that is connected to different parts of the body to collect information about a person’s state, such devices include Electrooculograms (EOG), Electroencephalogram (EEG), Electrocardiogram (ECG), and Electromyogram (EMG) [55,89,155]. Using these devices can yield highly accurate results for driver drowsiness identification, but these methods are not widely accepted because of practical implications [36]. Moreover, electro-physical devices use electrodes that are attached to the driver’s head, chest, or the face. The implementation of a real-time application using such methods is not acceptable because the electrodes can cause irritations and discomfort to the driver [171]. A brief discussion on electro-physical devices is discussed below:
EEG – is a device that reads electrical activity generated within the brain by the firing of neurons [41]. Readings are collected by placing electrodes on the scalp of the driver to find brain signals at a certain frequency. Figure2.1shows a person wearing an electrode headset for readingEEGsignals. Drowsiness levels appear on theEEGspectrum when there is an increase of activity in the frequency bands that are generated by the parietal and central regions of the brain. Results are obtained by placing the device on the person and measuring signals. The collected signals are then converted into a waveform that can be visualised [80]. In much research, EEGis
Figure 2.1: Readings of EEGsignals being captured on a person [80].
used as a reference indicator because it is capable of producing efficient results when detecting traces of drowsiness in drivers. Belakhdar et al. investigated the use of an Artificial Neural Network (ANN) on a single EEG channel, to detect drowsiness [14]. Ten people were tested and nine features were captured from one EEGchannel using the Fast Fourier Transform (FFT) features. These features were used to train theANNclassifier. An accuracy rate of 86.1% and 84.3% was achieved when classifying users as drowsy or alert, respectively. [14].
ECG –is a graphical presentation that depicts electrical activity generated by the heart pulse [97]. ECGmakes use of electrodes that are placed on the skin to detect an electrical change on the skin caused by heart muscles [122]. It is a portable device which uses a non-invasive method where waves from the heart are measured with a variation of blood volume in tissues where a light source is used together with a detector.
EMG – is a device used to record the activity of the muscles when they are at rest and when there is movement [32]. The primary purpose ofEMGis for diagnosis based on information from muscle and motor neurons [59]. EMGreads and translates signals from the motor neurons into graphs, numerical values or sounds that can be interrupted by a computer to make a diagnosis. A needle electrode is inserted into the muscles to measure muscle signals.
EOG – is a technique used for measuring different levels of eye movement through the resting potential of the retina [151]. The signals produced byEOG record the difference between the electrical voltage of the front and back of the eye [111]. To obtain recordings, an electrode is placed on the skin near both eyes. These electrodes are placed in different positions, horizontally to reflect the horizontal eye movement, with a vertical electrode to reflect the vertical movement. Signals can be acquired by sampling at a frequency of 256Hz and resolution of 16 bit [23]. Zhu et
al. presentedEOG-based drowsiness detection using CNNs. An unsupervised learning approach to estimate driver fatigue based onEOG was used [198]. Their results showed that ad-hoc feature extraction yielded effective results.
2.1.4.2 Subjective Methods
Subjective methods are non-invasive and consist of a series of tasks given to the driver and the completion of questionnaires. These tasks are monitored by a trained individual to assess and quantify the sleepiness levels of a driver. There are different subjective methods that can be used to evaluate the sleepiness levels of the drivers including the Epworth Sleepiness Scale (ESS), the Karolinska Sleepiness Scale (KSS), the Stanford Sleepiness Scale (SSS), the Sleep-Wake Activity Inventory (SWAI), and the Multiple Sleep Latency Test (MSLT).
ESS – is an instrument used to measure average daytime sleepiness, in order to differentiate between normal sleepiness levels and excessive daytime sleepiness. It was introduced by Dr Murray Johns at Epworth Hospital in 1991 [76] and makes use of questions designed to measure an individual’s sleepiness levels. These are based around various situations an individual may find themselves in, including watching television, sitting in a car due to traffic congestion, or sitting inactive in a public place. The questionnaires consist of eight questions and are rated up to 4-points containing different weights as follows:
No chance of dozing (0 points);
Slight chance of dozing (1 point);
Moderate chance of dozing (2 points); and
High chances of dozing (3 points).
Individuals with a score from 0 to 9 are considered to be awake and those with 15 points and above show traits of severe daytime sleepiness levels.
KSS –is a tool that measures an individual’s level of sleepiness at a particular time of the day [5]. This consists of a self-report process that takes about five minutes to complete. There are two versions, where the first version has labels on every other step and the second uses labels on every step on the 9-point scale. Table2.1defines the KSSscores.
Table 2.1: TheKSSSleepiness Scale KSSscores Description Scores Extremely alert 1 Very alert 2 Alert 3 Rather alert 4
Neither alert nor sleepy 5
Some signs of sleepiness 6
Sleepy, but no difficulty remaining awake 7 Sleepy, some effort to keep alert 8 Extremely sleepy, fighting sleep 9
Table 2.2: TheSSSratings
SSS ratings
Description Scale Rating
Feeling active, vital, alert, or wide awake 1 Functioning at high levels, but not fully alert 2 Awake, but relaxed; responsive but not fully alert 3 Somewhat foggy, let down 4 Foggy; losing interest in remaining awake; slowed down
5
Sleepy, woozy, fighting sleep; prefer to lie down 6 No longer fighting sleep, sleep onset soon; having dream-like thoughts
7
Asleep x
SSS – is a self-report questionnaire instrument that was developed by Dement Hoddes and colleagues in 1972 [63]. This measure uses an hourly test performed to evaluate the level of sleepiness. It uses a scale from 1 to 7 to determine the level of sleepiness. Table 2.2 defines theSSS level scale rating. TheSSS is a simpler version of theKSSand thus takes less time to evaluate.
SWAI– is a multidimensional self-report tool used to measure the level of sleepiness in a clinical setting [142]. This measure contains 59 items which have domain scales for evaluation of sleepiness levels. The score domains include excessive daytime sleepiness, distress, social desirability, energy levels, ability to relax, and nighttime sleep. The test takes approximately 10 to 15 minutes to complete, which is longer than theKSSand SSStests.
Table 2.3: Multiple Sleep Latency Test
MSLTLevels Minutes before falling
asleep Sleepiness Levels 0 - 5 Severe 5 - 10 Troublesome 10 - 15 Manageable 15 - 20 Excellent
how quickly an individual falls asleep in a quiet environment [21]. Those taking the MSLT are given five scheduled naps each lasting 20 minutes, two hours apart. The tests are done in different environments including a dark room, a quiet room, a comfortable environment without distractions, or rooms with environmental factors that may prevent them from sleeping. Data can be collected from brain waves,EEGtools, muscle activities, oxygen levels, and eye movements. Table 2.3shows the MSLTscores. The sleepiness levels indicate that if an individual falls asleep within five minutes of the test, they are considered pathologically sleepy. On the other hand, individuals that take more than 10 minutes to fall asleep are considered to have normal sleepiness levels.
Subjective methods are not practical for monitoring driver drowsiness tasks, but they can be useful when used in combination with other drowsiness measuring methods to produce informed decisions and to provide ground truth labelling for behavioural detection systems.
2.1.4.3 Vehicle-Based Methods
Vehicle-based methods rely on the vehicle’s control system, which includes steering wheel angle, braking system indicators, lane position information, and the speed of the vehicle [16]. Together with behavioural methods, these can be used to create robust and efficient systems.
Lane position monitoring –This technique uses road lanes to detect the position of the car on the road. The placement of the vehicle in the centre, left or right lane of the road [86,
137], can be used to assist the driver to leave a space between their own and oncoming cars and to detect if a vehicle crosses the line. Lane departure systems can warn the driver about collisions, potential distractions, and can flag drowsiness [184]. Zheng et al. proposed a new system for lane position detection based on Radio Frequency Identification (RFID) and vision [196]. The system is divided into two processes which include lateral position detection, and the
detection of the absolute or relative position of other vehicles. Errors from lateral positioning GPS/DGPS were revised by using a lane judgement subsystem [196]. Furthermore, Zheng et al. proposed vehicle-infrastructure (V-I) positioning using a single Roadside Unit (RSU), and Vehicle-Vehicle (V-V) relative positioning algorithms. The system is motivated to be a useful approach preventing road accidents in dense traffic [196].
Driving at High Speed –In South Africa, the speed limit is 40 to 60km/h in urban areas, 80 to 100km/h in rural areas and 120km/h on freeways[114]. Road accidents that are caused by excessive speed have a high mortality rate. When a driver falls asleep, they become unaware of the speed they are driving at and it can be too late to regain control of the vehicle if they wake. 16.5% of accidents between 1999 and 2008 were speed-related accidents caused by drowsy driving [170]. When a driver is about to fall asleep, they tend to increase speed. The increase in the speed can lead to accidents since the driver is not paying attention to the road because they are in a sleepy state.
Steering wheel movement measurements – A number of studies have investigated the use of steering wheel measurements to detect consciousness by observing steering patterns [121]. This technique uses sensors that are mounted on the steering wheel to collect data that can be further analysed for drowsiness. When the driver is in a drowsy state, steering wheel correction is reduced. The combination of steering wheel movement measure and lane departure techniques can overcome false positive situations where small steering angles are required to follow a road safely.
2.1.4.4 Behavioural Methods
Faces contain information that can be used to interpret levels of drowsiness. There are many facial features that can be extracted to infer a driver’s level of drowsiness. Behavioural methods measure levels of drowsiness through the use of mounted cameras in the car that observe facial features such as eye state, head movement, blinking rate and the presence of yawning [109].
Eye-state detection – When a driver has been driving for long hours or at night, they tend to lose focus of the road and control of the vehicle. When a driver is drowsy, their blinking rate is reduced and their eyes tend to be red. Some researchers track eye movement to detect the state of the driver [49]. It has been shown that closing the eyes can lead to head-on collisions and is a significant cause of road accidents [154]. However, drowsiness impacts the eye state and
can be used as a detection measure. Methods that are used to measure the level of drowsiness include the Percentage of the Eye Closure (PERCLOS) and the Eye Aspect Ratio (EAR) [30,
173]. TheEAR was introduced by Soukupora and Cech in 2016, with the EARcomputed as the ratio between the height and width of the eye [173]. In contrast, PERCLOSis the percentage of eye closure over a period of time. The difference between these two methods is that EAR classifies the ratio of the eye as it decreases whereasPERCLOS classifies whether eyes are open or closed over a period of time.
Yawning – Frequent yawning is a sign that a driver needs to rest. Detection of yawning can be an early warning sign that can trigger an alarm for a driver to be made aware of their state. However, yawning alone cannot be used to determine that the driver is drowsy because it can yield false positive results. Many researchers use yawning with other features to detect and draw the conclusion that the driver is drowsy [2,149].
Head Position Detection –The head position tends to sway forward when the driver is drowsy. This can cause a driver to lose focus on the road and potentially cross the road lanes. A number of researchers use head tilt angles to determine the state of the driver [145]. The normal angle of the driver’s head is determined and an alarm is raised when the angle goes beyond a certain angle.
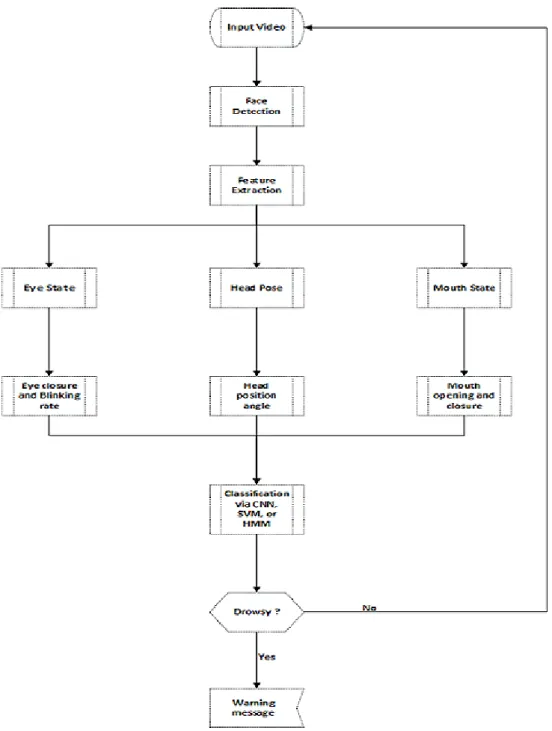
This thesis focuses on the use of vision-based behavioural methods to measure the level of drowsiness in drivers. This process typically relies on a mounted camera in the car that is used to monitor a driver’s facial attributes, as mentioned in Section2.1.4.4. These facial attributes can then be used by machine learning techniques such as CNNs, SVMsor HMMs for drowsiness detection. The process of identifying the driver’s state starts by passing labelled data to a given machine learning technique, as part of a step termed the training phase. The series of steps that are followed in figure 2.2suggests a common process for detection of drowsiness. These steps are as follows:
Input Video –This is the stage where video frames from a fixed camera or a smartphone are broken down into a series of images. The video frames are taken in such a manner that only the face of the driver is captured in the image.
Face Detection – The second stage typically aims to detect the face in the image frames. The Viola and Jones detector is the most commonly used algorithm to detect the driver’s face from within the image [177]. However, when CNNsare used, the whole image is typically fed to a
Figure 2.2: Driver drowsiness detection process.
network that has multiple filters and features are automatically extracted. CNNscombine the two stages of detecting the face and of feature extraction.
Feature Extraction –If face detection is applied, features are usually extracted using different methods such as landmark localisation, Histogram of Oriented Gradient (HOG), and Local Binary Patterns (LBP).
Feature Analysis – Extracted features can then be processed further, as is the case for PERCLOS or EARfor eye analysis or mouth-based methods for yawning detection.
Table 2.4: CNNbased detection systems
Author/s Year Measure Frame Rate (fps) Accuracy Dwivedi et al. [36] 2014 Visual features 60 78% George and Routray [46] 2016 Eye gaze 24 98.32%
Reddy et al. [134] 2017 Eye and mouth state 72 91.6% Zhang et al. [195] 2017 Eye state N/A 95.18% Jie Lyu et al. [98] 2018 Eye and mouth state 37 90.05% Rateb Jabbar et al. [72] 2018 Eye and yawning state 30 87% Young-Joo Han et al. [56] 2018 Eye state 22 94% Mohammed Ghazal et al. [48] 2018 Eye state 14 95% Wang Huan Gu et al. [52] 2018 Yawning state 50 99%
Classification – The classification stage consists of classifiers that are used for decision-making regarding a driver’s level of drowsiness. If the classifier detects traits of drowsiness based on the weighted parameters, then an alarm will be activated suggesting that a driver takes a break.
Behavioural methods exhibit various limitations because their performance is affected by lighting conditions, camera movements, and the frame rate used to capture images of the driver’s face. Light variation can typically be eliminated by using Infra-red (IR) cameras. Various measures are used in different studies for detecting a face and extracting features from the video feed. Unfortunately, most behavioural drowsiness detection studies use different datasets that may favour their own algorithms. This is due to the lack of standardised datasets that can be used as a benchmark. As a result, it is hard to compare approaches by simply evaluating reported accuracies. Machine learning techniques that classify different levels of drowsiness are now discussed, along with a review of measures that form a driver drowsiness detection system.
CNNs – Consist of interconnected layers of neurons, where data is passed through every layer and various computations are performed. More detailed information about CNNsis provided in Chapter3. CNNsare the most commonly used machine learning techniques for driver drowsiness detection, as indicated in Table2.4.
Dwivedi et al. proposed an algorithm for driver drowsiness detection using representation learning [36]. Here, the popular Viola and Jones algorithm was used to detect the faces. Images were cropped to 48 x 48 square images and fed into the first layer of the network which consisted of 20 filters. The whole network contains two layers. The output of theCNNs was passed to a softmax layer for classification. This system did not allow for a consideration of head pose changes and as a result can fail. However, Huynh et al. used a 3DDNNto obtain more accurate results [68]. Here, the face is tracked by a combination of a Kernelized Correlation filter with a
Table 2.5: SVMsbased detection systems
Author/s Year Measure Frame Rate (fps) Accuracy Sabet et al.[144] 2012 Eye state 25 98.4% Punitha et al.[130] 2014 Eye state 15 93.5% Pauly and Sankar[125] 2015 Eye state 5 91.6% ALAnizy et al.[6] 2015 Eye closure 60 99.74%
Manu [102] 2017 Eye and Mouth state 15 94.58% Zhuoni Jie et al. [75] 2018 Yawning state 10 94%
Souto et al. [158] 2018 Eye state 15 78%
Kalman filter for robust face tracking. The extracted face regions are then passed to 3D-CNNs which is followed by a gradient boosting machine for classification. This system works well even if the driver is changing head position [68].
SVMs – are a group of supervised learning methods for classification and regression problems based on decision planes to separate a set of training data into their different classes. They were first introduced by Boser et al. in 1992 in an attempt to find a hyperplane which separates training data into different classes according to their features [18]. SVMsuse labelled data as inputs and for the driver drowsiness detection problem,SVMscan differentiate whether a driver’s eyes are open or closed.
A great deal of work has attempted to utilize the capabilities of SVMs in the detection of drowsiness. Different measures have been used as features to determine a driver’s level of drowsiness using SVMs. A comparison of these measures is presented in Table 2.5.
AL-Anizy et al. proposed a fully automatic system that is capable of detecting driver drowsiness [6]. For face detection and eye extraction, the well-known Haar feature matching algorithm was used. SVMswere then trained to classify when eyes are open or closed and to trigger an alarm. Similarly, [144] proposed a system that can detect driver drowsiness and distraction. Here, the Viola and Jones algorithm was used for face detection and colour histograms with LBPapplied to track the face over frames. The system achieved an accuracy of 100% in face detection, but a potential downfall of this approach is the low frame rate achievable, which could result in missed facial expressions.
HMMs – are statistical models that use hidden states which are based on observed states defined by probabilities to make predictions. The first HMMwas developed by Leonard Baum and colleagues in the late 1960s and early 1970s [12]. HMMs are now widely used in other
Table 2.6: HMMbased work related
Author/s Year Measure Frame Rate (fps) Accuracy Sun et al.[163] 2013 Eye blinks 61 90.99% Tadesse et al.[167] 2014 Eye closure 20 97.0%
Zhang et al.[194] 2015 Eye state N/A 95.9% Choi et al. [24] 2016 Eye and head state 16 to 20 92%
fields including facial expression recognition, gene annotation, and computer virus classification [128,190]. For the driver drowsiness detection task, Table 2.6shows the range of features and approaches used byHMM-based drowsiness detectors, with the exception of Zhang et al. [194] and Choi et al. [24], who omitted information required for comparing their findings and are therefore not included in this meta-analysis. Nakamura et al. proposed a new facial feature measure by using changes in wrinkles detected by calculating the local edge intensity on the face [112]. They used an IRcamera to eliminate illumination changes and allow for operation in both day and night conditions. Unfortunately, this system can yield false results when used on older people because they have deeper wrinkles. In contrast, Bagci and Ansari implemented an HMM for eye tracking based on colour and geometrical features [11]. For illumination elimination, authors used a two-level Lloyd-max quantization intended to be robust to illumination changes. Unfortunately, this system is designed for indoor conditions and it fails to detect the face if the driver is not facing forward.
2.1.4.5 Meta-Analysis
A great amount of work has been conducted in the field of road safety to minimise road accidents. Industries play a vital role in providing these safety features to detect drowsiness. However, a challenge identified in the reviewed papers is that most systems used their custom datasets. This challenge makes it difficult to compare these techniques and to have standard benchmark datasets. Most of the datasets used to test machine learning techniques are not publicly available because of issues around privacy and identity security.
In an attempt to provide a fair comparison, a systematic literature review was conducted on machine learning techniques for driver drowsiness detection, along with a meta-analysis of the performance of these techniques.
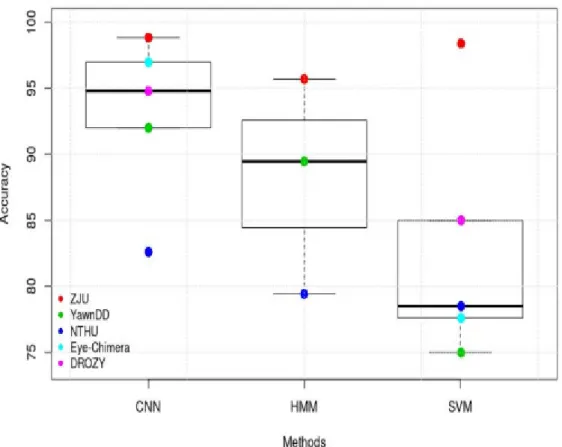
Figure 2.3: Meta-Analysis Report
This meta-analysis was conducted using 40 papers that were based on the three techniques described above. From the collected papers, various metrics were extracted for comparison including datasets, facial expression features, frame rate, and accuracy levels. The meta-analysis report showed that CNN methods were used most commonly and also yielded more accurate results thanSVMsandHMMs. A non-parametric Skillings-Mack test was conducted and rendered a Chi-square value of 6.66, which was significant at p =0.035. This test showed that there is a difference in performance between the compared techniques. The most common test datasets were identified from the papers to provide a fair comparison, these datasets includeDROZY[104], Eye-Chimera Database (Eye-Chimera) [136], National Tsing Hua University Dataset (NTHU) [27], Yawn Detection Dataset (YawnDD) [3], and the Zhejiang University Eyeblink Database (ZJU) [199]. Figure 2.3shows the box-plots of the accuracies obtained for each technique along with the associated dataset for comparison. The CNNs performance and number of uses show a great interest in this approach. Chapter4 will show howCNNsare used for driver drowsiness detection. It is also important to note that the other two techniques were difficult to compare due to insufficient data.
they cover a limited range of races. This poses challenges in the South African contexts. South Africa is a diverse country with people of a variety of races with different skin complexions. The Bantu-speaking races dominate South African demographics at 78.4%, whites make up 10.2% of the population, Coloureds (people of mixed race) contribute 8.8%, and 2.6% are Asians [183]. The population of people in South Africa is at 57 million, as reported by Statistics South Africa [187]. The value of cars imported to South Africa was about R59 billion in 2017 [38]. This represents a high number of vehicle imports and increase the potential for failure if car drowsiness detection systems are designed and tested on data that excludes a large portion of South African population groups, especially dark-skinned individuals.
2.1.4.6 Hybrid Methods
All of the previously mentioned methods have advantages and limitations. Limitations in vehicle-based methods include weather and road conditions. Vehicle-vehicle-based methods work best on specific roads that have visible road markings and minimal road defects. In poor road conditions, vehicle-based methods can yield more false-positive results. On the other hand, physiological methods yield more accurate results. However, these require that a driver must wear a device that measures their state of drowsiness, so it is a challenge to implement real-world applications that incorporate this method.
Hybrid systems combine drowsiness detection methods to produce more robust systems. Combin-ing two methods can yield better and more accurate results. For example, Veena and Subhashini used a combination of physiological and behavioural methods to detect driver drowsiness [162]. This system used wireless sensors for eye blink detection and a biomedical sensor placed on the steering wheel or on the driver’s spectacles. The hybrid method proposed by Veena and Sub-hashini showed promising results with low-cost sensors [162]. Similarly, Agustin et al. proposed a hybrid method that combines the information from pulse rate monitoring, eye monitoring, and head movement resulting in increased the drowsiness detection accuracy [4]. This system used fuzzy logic for prediction. The pulse rate was measured using a pulse oximeter, while eye and head movements were tracked using a camera. The correctness was evaluated by using the number of correct responses over the total number of samples. Pulse rate contributed about 40% towards the final decision of the system, while eye movement accounted for 35% and head monitoring 25% [4].
2.2
Commercially Available Systems
Motor industries have been engaged in research and implementation of accurate and increasingly robust driver drowsiness detection systems. However, companies use different measuring methods for the implementation of such systems. Driver drowsiness systems are available in different vehicle model brands. The following section describes a number of systems that are currently being used.
The rest recommendation system – This is an Audi system that analyses the driver’s be-haviour by monitoring steering, gear lever, and pedal movements [10]. The system is automatically activated at a speed between 65 and 200 km/h. The information from all these components is monitored and if there is a change in the pattern, the driver will hear an audio notification and receive a visual prompt alerting them. The system also provides an easy to read interface that recommends if a driver needs to take a break.
Active Driving Assistant –ThisBMWsystem includes a camera-based lane departure warning and collision warning [33]. This system detects lane markings, and if the system detects that the driver has changed lane unintentionally then the steering wheel will vibrate. Figure2.4 shows theBMW active driving assistant system. The system is activated by the car’s speed, at 70km/h
Figure 2.4: BMWactive driving assistant [33]
the system starts to collect information on unintentional lane changes and a warning is displayed on the car’s cluster [17] if this is detected.
Attention Assist – This is a Mercedes-Benz system that is equipped with several sensors which include EEGsensors that are placed on the steering wheel. The system is activated between
speeds of 80 and 180 km/h, where it measures steering wheel patterns and combines this with other information such as duration of the trip and the time of day [107]. If the information collected shows that the driver is drowsy, a warning (a coffee cup signal) will be displayed in the car’s cluster, followed by an audible tone. Figure 2.5shows the visual alert from the system.
Figure 2.5: Mercedes-Benz attention assist [107].
Driver Alert – The Ford system uses small forward-facing and rear view cameras that are connected to the onboard computer [157]. The rear-view camera is trained to identify lane markings on both sides of the vehicle. When the driver is crossing road marking lanes, the system looks at the road ahead and predicts the position of where the vehicle should be relative to lane markings. Once the driver makes the mistake of crossing the lane markings, an alert will be displayed as a text message in the car’s cluster. If the driver ignores the message, another alert will be triggered and the driver has to acknowledge it by pressing an “OK” button. If the driver continues to ignore the message, the last stage of this system requires that the driver stop the car and acknowledge the alert by opening the door.
2.3
Conclusion
This chapter has explored fundamental concepts of drowsiness together with measurement methods used to distinguish different levels of drowsiness. It further discussed available driver drowsiness detection systems that are currently in use on high-end car models. In particular, this chapter focused on behavioural methods, which use sensors to track facial features in order to identify drowsiness. The South African population was also discussed as a potentially problematic case for behavioural methods, as it is a particularly diverse country. A general approach to driver
drowsiness detection was highlighted, which clearly shows what is needed for implementing an effective system.
A literature review was conducted on machine learning techniques for the task of driver drowsiness detection. A meta-analysis of the performance of the machine learning techniques was conducted. CNNswere shown to provide more accurate results and were extremely popular, this is due to their rapid growth since a 2012 breakthrough by Alex Krizhevsky. The following chapter discusses in more detail the fundamentals ofCNNs, while details on how they are used to implement a driver drowsiness detection system are discussed in Chapter4.
We are entering an era where data is collected each and every day. This data can be in various forms such as video, images, and text. There is a need to interpret this data and discover valuable hidden information. One of the most commonly used techniques to interpret data is by machine learning. Machine learning consists of methods that can automatically detect patterns in data, and then use the uncovered patterns to predict future data, or to classify objects in images. In this thesis, we use deep learning, which is a subclass of machine learning that learns from large amounts of data, for the driver drowsiness detection task. The fundamentals of deep learning are described in this chapter.
3.1
Artificial Neural Networks
An artificial neuron is a mathematical model that is inspired by neurons in the human brain. This artificial model tries to simulate the structure and the functionalities of a biological neural system in a computerised form. The perceptron [127], relies on three steps, in the first step inputs xi are accepted and multiplication is performed on each input value with individual weights wi. The second step involves the summation of all the weighted inputs and the addition of bias to the neuron, to form the neuron’s pre-activation z.
z=b+X
i
wixi, (3.1)
wherebis the bias value of the neuron. The final step is the activation stage, where the previously weighed inputs and bias are passed through an activation function.
3.2
Convolutional Neural Networks
CNNsare multistage mechanisms that learn a data representation in order to fulfil a specific goal. Data is passed through sequentially stacked layers to learn different features that represent the data. CNNshave dominated many computer vision tasks since the breakthrough shown by Alex Krizhevsky in the ImageNet Large Scale Visual Recognition Competition (ILSVRC) in 2012 [87]. However, the history of CNNsgoes back to the 1940s, where McCulloch and Pitts introduced mathematical models that were inspired by human neural activities in 1943 [106]. In 1958, Frank Rosenblatt showed how a probabilistic model could learn from the observations, and how the information is stored and remembered [141]. In 1980, Fukushima proposed a neural network model called neocognitron which is said to be self-organised [45]. His model involved learning without being taught and recognised stimulus patterns based on geometrical similarity. Since then, the field had slow improvement until 1989, where LeCun et al. applied backpropagation to neural networks [91]. Their work was inspired by the experiments conducted by Hubel and Wiesel in 1962, who studied the visual cortex of animals [67]. The success of Alex Krizhesky in 2012 brought much interest in the computer vision communities and this led to many progressive works. A brief summary of the highlights of some improvements made thus far is described below, with reference to the ILSVRC:
ZFNet (2013) –In 2013 the winners of the ILSVRCwere Matthew Zeiler and Rob Fergus from New York University [193]. Their model achieved an 11.2% error rate, improving upon the 2012 error rate of 15.4% obtained by AlexNet. Although ZFNet is similar to AlexNet, ZFNet was modified by introducing a deconvNet and decreasing filter sizes from11×11pixels to7×7pixels.
GoogleNet (2014) – GoogleNet is a 22 layerCNN that won the 2014ILSVRC. The novelty of this work was the introduction of the Inception module [164]. This module aims to reduce computational costs while increasing the width and depth of the network. The inception module has been extended several times with recent iterations including Inception-V3 [166] and Inception-V4 [165] models.
VGG (2014) – TheVGG developed by Karen Simonyan and Andrew Zisserman consists of two versions (VGG-16 and VGG-19 models) and was awarded second place in theILSVRC2014 challenge [153]. The two network architectures have depths of 16 and 19 layers respectively. VGG decreased the filter sizes of ZFNet to 3 x 3 with the motivation that these smaller filter sizes are capable of gathering more information from input images.
ResNet (2015) – This network, developed by Microsoft Research Asia, won the 2015ILSVRC with an error rate of 3.6% [57]. This model uses a residual learning framework that aims to simplify the training of deeper networks and yield higher accuracy. This network consists of 152 layers and was extended to 1001 layers on CIFAR-10, achieving an error rate of 4.62% [58].
It is clear that there is a trend of increasing the depth of the network, producing increasing performance, while reducing computational costs. However, these trends can make CNNsmore vulnerable to over-fitting. Strategies for avoiding over-fitting include Batch Normalization (BN) [71] and dropout [159].
CNNs consist of multiple different layers. These layers include convolution, BN, activation, pooling, and fully connected layers. All these layers work together to achieve a specific goal. These layers are discussed in the following section.
3.2.1 Convolution Layer
Convolutional layers are the most important building blocks of the CNNarchitecture. They are linear, shift-invariant operational layers which perform a locally weighted combination of the inputs. The benefit of this layer is that parameters are shared across the layer which results in fewer parameters. The second benefit is obtained by restricting each neuron to small localised regions of the input vector rather than the entire image. The convolution layer starts by accepting a three-dimensional image tensor, containing three channels if it is a colour image and one channel if it is black and white, sized pixels with height and the width of the image tensor as shown in Figure3.1. These layers extract low-level features from the input tensor I by means of convolution operations using a two-dimensional kernel K,
c(i, j) = (K∗I)(i, j) =X m X n I(i−m, i−n)K(m, n) +bm,n (3.2)
where bm,n is a bias parameter, andi, j denote the coordinates of a feature map pixel. There are also other parameters needed to be considered in this layer including stride and padding.
![Figure 1.2: Numbers of road crashes in South Africa from 2007 to 2016 [ 157].](https://thumb-us.123doks.com/thumbv2/123dok_us/9919692.2484962/18.893.198.697.520.803/figure-numbers-road-crashes-south-africa.webp)
![Figure 1.3: Percentages of road accidents per province in the 2016 financial year [ 157].](https://thumb-us.123doks.com/thumbv2/123dok_us/9919692.2484962/19.893.243.668.122.511/figure-percentages-road-accidents-province-financial-year.webp)
![Figure 3.6: A modification of the global average pooling using the class activation mapping (CAM) localisation from GoogleNet-GAP [197].](https://thumb-us.123doks.com/thumbv2/123dok_us/9919692.2484962/59.893.236.659.385.722/figure-modification-average-pooling-activation-mapping-localisation-googlenet.webp)