econ
stor
www.econstor.eu
Der Open-Access-Publikationsserver der ZBW – Leibniz-Informationszentrum Wirtschaft
The Open Access Publication Server of the ZBW – Leibniz Information Centre for Economics
Nutzungsbedingungen:
Die ZBW räumt Ihnen als Nutzerin/Nutzer das unentgeltliche, räumlich unbeschränkte und zeitlich auf die Dauer des Schutzrechts beschränkte einfache Recht ein, das ausgewählte Werk im Rahmen der unter
→ http://www.econstor.eu/dspace/Nutzungsbedingungen nachzulesenden vollständigen Nutzungsbedingungen zu vervielfältigen, mit denen die Nutzerin/der Nutzer sich durch die erste Nutzung einverstanden erklärt.
Terms of use:
The ZBW grants you, the user, the non-exclusive right to use the selected work free of charge, territorially unrestricted and within the time limit of the term of the property rights according to the terms specified at
→ http://www.econstor.eu/dspace/Nutzungsbedingungen By the first use of the selected work the user agrees and declares to comply with these terms of use.
zbw
Leibniz-Informationszentrum Wirtschaft Leibniz Information Centre for EconomicsDemeulemeester, Sarah; Hottenrott, Hanna
Working Paper
R&D subsidies and firms' cost of debt
DICE Discussion Paper, No. 201
Provided in Cooperation with:
Düsseldorf Institute for Competition Economics (DICE)
Suggested Citation: Demeulemeester, Sarah; Hottenrott, Hanna (2015) : R&D subsidies and firms' cost of debt, DICE Discussion Paper, No. 201, ISBN 978-3-86304-200-4
This Version is available at: http://hdl.handle.net/10419/122148
No 201
R&D Subsidies and
Firms’ Cost of Debt
Sarah Demeulemeester,
Hanna Hottenrott
IMPRINT
DICE DISCUSSION PAPER
Published by
düsseldorf university press (dup) on behalf of
Heinrich‐Heine‐Universität Düsseldorf, Faculty of Economics,
Düsseldorf Institute for Competition Economics (DICE), Universitätsstraße 1,
40225 Düsseldorf, Germany www.dice.hhu.de Editor:
Prof. Dr. Hans‐Theo Normann
Düsseldorf Institute for Competition Economics (DICE)
Phone: +49(0) 211‐81‐15125, e‐mail: normann@dice.hhu.de
DICE DISCUSSION PAPER
All rights reserved. Düsseldorf, Germany, 2015
ISSN 2190‐9938 (online) – ISBN 978‐3‐86304‐200‐4
The working papers published in the Series constitute work in progress circulated to
stimulate discussion and critical comments. Views expressed represent exclusively the
authors’ own opinions and do not necessarily reflect those of the editor.
1
R&D Subsidies and Firms’ Cost of Debt
Sarah Demeulemeestera and Hanna Hottenrotta,b,c
a Dept. of Managerial Economics, Strategy and Innovation, KU Leuven, Belgium b Düsseldorf Institute for Competition Economics (DICE), University of Düsseldorf, Germany
c
Centre for European Economic Research (ZEW), Mannheim, Germany November 2015
Abstract
Financing research and development (R&D) through loans is usually a costly endeavor. Information asymmetry, outcome uncertainty and low collateral value tend to increase the cost of debt. Based on a large panel of heterogeneous firms, this study shows that recipients of public R&D grants, on average, face lower costs of debt. The findings also suggest that a process of certification in which the subsidy signals the quality of the firm’s R&D to external lenders rather than a ‘resource effect’, i.e. the direct liquidity impact of the subsidy, explains this observation. The comparison between young and established firms shows that the certification effect for young firms primarily stems from subsidies for basic research, that is, for the stage of R&D in which outcome uncertainty and information asymmetries are typically larger. In addition, young firms seem to benefit from a ‘formation effect’ through learning from the subsidy application process. Application experience may improve young firms’ R&D project plans in a way that reduces information asymmetries between firms and lenders.
Keywords: Innovation policy, Research & Development, R&D subsidies, cost of debt, financial constraints
JEL codes: O31, O38, G30
Author contact details:
Sarah Demeulemeester(Corresponding author), KU Leuven, Department of Managerial Economics, Strategy and Innovation, Naamsestraat 69, 3000 Leuven, Belgium. E-mail: sarah.demeulemeester@kuleuven.be
Hanna Hottenrott, Düsseldorf Institute for Competition Economics (DICE), University of Düsseldorf, Universitätsstrasse 1, 40225 Düsseldorf, Germany. E-mail: hottenrott@dice.hhu.de
Acknowledgements
We thank the Centre for R&D Monitoring (ECOOM) at KU Leuven for access to the R&D survey data and IWT for providing the subsidy data. We are grateful to Dirk Czarnitzki, participants at the 5th European Conference on Corporate R&D and Innovation (CONCORDi, October 2015) in Seville (in particular Bronwyn H. Hall, Ruslan Lukach, and Jürgen Janger), and participants of the PhD Workshop organized by the University of Turin and Collegio Carlo Alberto (December 2014) for helpful comments and suggestions. We are also grateful to Tom Swerts, the head of general credit management at a large Belgian bank for an interview on the relevance of R&D subsidy grants and loan applications.
2
1.
Introduction
Well-performing capital markets are essential to drive a region’s economic growth through facilitating investments in research and development (R&D) and innovation (see e.g., Levine, 1997; de la Fuente and Marin, 1996; Levine, 2005). Frictions in financial markets may hamper such investments, leading to slower technological progress (Aghion et al., 2005; Brown et al., 2009). The most prominent friction is the occurrence of information asymmetries between the investing firm and external financiers regarding the quality, i.e., the expected returns of an R&D project (see Hall and Lerner, 2010, for a survey). External financiers may therefore be reluctant to finance R&D projects, especially of firms that have little reputation, low collateral value, and a high overall risk of bankruptcy. Indeed, financing constraints have been shown to be most binding for small and young firms (Himmelberg and Petersen, 1994; Carpenter and Petersen, 2002; Müller and Zimmerman, 2009; Czarnitzki and Hottenrott, 2011a) or firms pursuing radical innovation strategies (Czarnitzki and Hottenrott, 2011b).
Compared to other external financiers such as banks, venture capitalists are typically better able to overcome asymmetric information problems by specializing in certain sectors, carefully screening and monitoring the investment, and by offering expertise to the firm (Tyebjee and Bruno, 1984; Hall and Hofer, 1993; Shepherd et al., 2000; Gompers and Lerner, 2001; Baum and Silverman, 2004). However, venture capital is usually not the most common form of financing innovative projects, particularly in Europe (Bottazzi and Da Rin, 2002; Hall and Lerner, 2010). First, venture capital tends to target start-ups in a selected, but limited number of sectors. Moreover, it entails equity-type investments and most often the involvement of the venture capitalist in business activities, which not all owners appreciate. In fact, in continental European countries the financial market is generally ‘bank-based’ rather than ‘market-oriented’ (Degryse and Van Cayseele, 2000; Vermoesen et al., 2013), which stresses the role of banks in financing innovation activities and the challenge firms face to overcome information asymmetries. In addition, a recent literature review of Kerr and Nanda (2014) highlights that also in the US, bank loans are a relevant source of financing innovation. One way of directly addressing market failures which lead to financing constraints for innovation are public subsidy programs that provide R&D grants (see e.g., Klette et al., 2000). The impact of such grants on firms’ innovation investments has been subject to a large stream of studies concerned with whether or not such programs trigger additional investments or
3
simply crowd out privately financed investments. These studies generally find that recipient firms invest higher amounts in R&D compared to non-recipients even when the selection into these support programs is accounted for (see e.g., Aerts and Czarnitzki, 2006; Aerts and Schmidt, 2008; Czarnitzki and Lopes-Bento, 2013; Hottenrott and Lopes-Bento 2014).
The mechanisms through which such additional investments become feasible, however, have received much less attention. Takalo and Tanayama (2010) argue that, in principle, R&D subsidies can reduce a firm’s financing constraints in two ways. First, the subsidy lowers the need for external funding, thus reducing the overall cost of financing R&D. Second, the receipt of an R&D subsidy can provide an “informative signal to the market-based financiers” (Takalo and Tanayama, 2010, p. 18). Participation in government-sponsored support programs can thus signal qualitative information to investors, hereby reducing their screening costs related to evaluating the firm or project (Narayanan et al., 2000). By providing a quality certification, subsidies may not only help firms investing in R&D by providing money directly, i.e. a ‘resource effect’, but subsidies may also facilitate access to external financing (Feldman and Kelley, 2006; Kleer, 2010). This mechanism may work for both institutional investors and banks. Lerner (1999), for example, shows that high-tech firms that received a government grant as part of the US Small Business Innovation Research (SBIR) program are better able to attract external financing from venture capitalists. He suggests that this is because the subsidy can certify the otherwise hard-to-observe quality of the awardees to investors. In the context of bank financing, Meuleman and De Maeseneire (2012) find that SMEs that received an R&D subsidy are more likely to attract long-term debt financing. Recently, scholars therefore pointed to the importance of ‘selective’ support schemes as opposed to ‘automatic’ schemes like tax credits (e.g., Colombo et al., 2011; Grilli and Murtinu, 2012).
The challenge related to the identification of the effects of public R&D grants on access to financing is the distinction between the different channels through which the subsidy may work, i.e., a direct ‘resource effect’ which improves the liquidity situation of the firm and a
‘certification effect’. Moreover, alongside the ‘resource effect’ and ‘certification effect’ there
is another possible channel, which has so far not been addressed, through which participation in subsidy programs may affect the lending situation of firms. An exploratory interview with the head of general credit management at a large Belgian bank pointed to this third mechanism that may be labeled as ‘formation effect’: “Firms that have gone through the subsidy application process did their homework and are better prepared to respond to the
4
critical questions posed by the bank when applying for a loan.” Such a ‘formation effect’ may
become possible if the screening process conducted by the government agency resembles the evaluation procedure of a bank. By going through the grant application process, particularly inexperienced firms improve their R&D project plan and gain experience in defending the commercialization potential of their project. In line with this view, a recent study by Grilli and Murtinu (2015) shows that the receipt of a ‘selective’ government subsidy increases an NTBF’s access to R&D alliances and that the capability to ‘exploit’ this signal is reinforced through the founder’s industry-specific work experience.
This paper aims to contribute to previous work in at least two major ways. First, the impact of the subsidy on external financing might not only be access to loans, but it may also affect the
cost of debt. Although previous studies investigated whether obtaining government support for R&D increases the firm’s access to external sources of financing (Lerner, 1999, Feldman and Kelley, 2006; Meuleman and De Maeseneire, 2012), evidence of the impact on external capital cost is missing. So far, we can only derive expectations from the accounting literature which suggests that – in general – disclosure can lower the cost of debt (Sengupta, 1998; Francis et al., 2005). One novelty of this study is therefore to investigate how the receipt of an R&D grant affects a firm’s cost of debt. Second, next to the separation from ‘certification’
and ‘resource effects’, this study tests explicitly for a ‘formation effect’, that is, whether
application experience independent of grant success plays a role in the cost of debt. The analysis is based on a unique, comprehensive dataset of Belgian subsidized and non-subsidized firms (including rejected applicants) at different stages of maturity and active in a variety of sectors.
For different panel model specifications, we find evidence of the existence of a certification effect, which is associated with a lower average cost of debt while we can rule out the dominance of a resource effect. Differentiating between young and established firms shows that young firms mainly benefit from grants for basic research projects, which is the type of activity that typically suffers more from financing constraints compared to product or process development projects (Czarnitzki et al., 2011). In addition, young firms appear to benefit from a ‘formation effect’ in which having applied for a subsidy has a beneficial impact on the cost of debt irrespective of the granting decision. This result points to the existence of learning effects through the subsidy application process, i.e., a “preparation premium” that is of greatest value for young, inexperienced firms. The results are robust to different model specifications and to accounting for the endogeneity of the subsidy receipt.
5
The paper proceeds as follows: The next section reviews the relevant previous research on which we base our research questions. Section 3 presents the data and methodology for the empirical analysis. Section 4 presents the results and section 5 concludes.
2.
Direct and Indirect Effects from an R&D Grant Receipt
Governments typically address potential underinvestment in innovation by setting up public support programs such as R&D subsidy schemes. Such programs, especially selective ones, i.e., grant application-based and targeted schemes, have been shown to trigger additional investments in the recipient firms, at least on average (see e.g., David et al., 2000). Not surprisingly, R&D subsidies are one of the largest and fastest-growing forms of industrial aid in developed countries (Nevo, 1998; Pretschker, 1998). R&D grants usually work as co-funding schemes in which the co-funding agency takes over part of the proposed project cost. The share in total project costs covered by the agency is referred to as the subsidy rate
(Hottenrott et al., 2014; Takalo et al., 2013a; Takalo et al., 2013b). Such schemes are usually designed so as to increase private investments by compensating the investing firm for the social returns to the investment. Previous research of such direct effects, however, also suggests that firms not only seem to match the grant with their required share but also seem to invest more in R&D outside the scope of the grant (Clausen, 2009; Hottenrott et al., 2014). In principle, such additional investments may become feasible through several mechanisms. First, previous research has shown that the more internal resources the firm has at its disposal, the lower the likelihood of suffering from financial constraints (Himmelberg and Petersen, 1994; Savignac, 2008; Hottenrott and Peters, 2012). As grants constitute a liquidity shock, these additional resources may reduce a firm’s default risk, making lenders more willing to provide a loan. At the same time, grants lower the required amount of internal and external financing the firm needs to develop itself. R&D subsidies can therefore stimulate private R&D investment by enabling firms to finance a smaller part of their projects with debt capital (Czarnitzki, 2006). As firms receiving an R&D grant need to raise less money externally, the subsidy affects the capital cost by lowering the need for external financing because the cost of debt typically declines with a decreasing total level of debt (see e.g., Pittman and Fortin, 2004). Smaller requested loans may further have a higher granting probability and may come at lower interest rates. These mechanisms can be summarized as ‘resource effects’. Following the approach of Lerner (1999), Meuleman and De Maeseneire (2012) control for what they
6
call the ‘buffering effect’ and show that this effect only matters for short-term debt, but that for long-term debt a ‘certification effect’ is prevalent.
Indeed, previous research has pointed to the existence of a ‘certification effect’ of public subsidies (e.g., Lerner, 1999; Feldman and Kelley, 2006; Meuleman and De Maeseneire, 2012). Similar to other signaling devices, an R&D grant receipt may provide an observable signal that serves to alleviate information problems, similar to a job market signal as first discussed by Spence (1973). More specifically, managers of firms investing in R&D may reduce information asymmetries between them and the bank by revealing qualitative information about their R&D projects through mentioning the grant receipt (Narayanan et al., 2000). For such certification to work, the signaling device must be difficult or costly to obtain and must be easily observed and verified by outsiders (Spence, 1973), as it is in the case for patents (see e.g., Long, 2002; Hottenrott et al. 2015a). Likewise, selective1 R&D subsidies from a reputable government agency meet the conditions for an effective signal. Lerner (1999), for instance, finds that high-tech firms that are awarded a grant stemming from the SBIR program are better able to attract venture capital funds as the awards can ‘certify’ the firms to private financiers and in this way lower information asymmetries. Feldman and Kelley (2006) illustrate that participants of the US Advanced Technology Program attract more financing from all other external funding sources compared to non-subsidized firms. They argue this is because a government R&D subsidy assigns a ‘halo effect’ to the recipients, which raises financing opportunities from other fund providers. In line with this finding, Meuleman and De Maeseneire (2012) show that firms that received an R&D subsidy within the SME-scheme from the Ministry of Technology in the Belgian region of Flanders increased their long-term debt financing following the subsidy award pointing to a certification effect that facilitated these additional long-term loans.
Third, in addition to the certification effect and the resource effect, there may be another possible mechanism related to the subsidy application process, which mainly applies to young or less experienced firms. For more established as well as for young firms, bank loans play a major role in bank-based capital markets such as in Western Europe (Achleitner et al. 2011). Robb and Robinson (2014) show that US startups also rely to a large extent on debt financing. Being prepared when seeking funding from external financiers, especially when these are not
1 See Colombo et al. (2011) for a definition of a ‘selective subsidy’: “A selective scheme provides financial
support to selected applicants. Applicants compete for receiving a subsidy and their projects are judged by committees formed by experts.”
7
specialized in the business area of the applicant firm, is therefore essential (see e.g., Cardon et al., 2009; Pollack et al., 2012). The main way in which this preparation is usually fulfilled is by developing a business plan that helps to convince investors and thus to increase the firm’s access to external financing. As noted by Zimmerer and Scarborough (2008; p. 123): “A business plan is a planning tool for transforming an idea into reality. … Its primary goals are to guide entrepreneurs as they launch and operate their businesses and to help them acquire the necessary financing to launch”. Potential lenders such as banks typically emphasize the financial part of such a business plan when deciding on the provision of funds (Mason and Stark, 2004; Zimmerer and Scarborough, 2008). Chen et al. (2009) argue that the ‘preparedness’ of the entrepreneur when presenting a business plan is salient in influencing the venture capitalists’ decision for providing financing. Moreover, Rasmussen et al. (2011) suggest that the ability to identify an opportunity and translate it into a clear and feasible “business concept” is pivotal for university spin-offs to raise their reliability and ability to gain access to key resources such as financing.
Selective subsidy programs in which the assignment of the grants is based on a screening process involving expert reviews and interviews might simulate this project plan preparation. The screening of the subsidy applications often involves a review process of an R&D project plan, containing information on the financial and market prospects of the R&D project. One example is the evaluation process of the agency for Innovation by Science and Technology (IWT) in Flanders (see e.g., Czarnitzki and Lopes-Bento, 2013).2 Applying for a subsidy, irrespective of whether or not the subsidy is granted, might therefore assist firms in improving their R&D project plans and preparing themselves for applying for debt. In the accounting literature, it has also been shown that information quality affects a firm’s “real decisions”, which subsequently influence the cost of capital (Lambert et al., 2007). Better preparation and enhanced R&D project outlines alleviate asymmetric information between the lender and borrower, allowing them to persuade the external investor and possibly reduce the external capital cost. As the learning potential and the asymmetric information are typically higher for young firms, this type of indirect mechanism, i.e. a ‘formation effect’ of R&D subsidy schemes may matter more for less experienced firms compared to more established ones.
8
3.
Data and Method
3.1 Data
We combine four data sources into a unique database in order to investigate the indirect effects of R&D grants on firms’ cost of debt. First, detailed information on all R&D subsidy applications, including granted as well as rejected proposals, is provided by IWT’s (the Flemish agency for Innovation by Science and Technology) ICAROS database. IWT is the main institute for offering financial support for R&D and innovation in Flanders. Firms that apply for an R&D subsidy at IWT have to go through a peer review process before a granting decision is made. Each applicant (or consortium) is required to submit a detailed description of the R&D project, a plan explaining how it will account for the risks, and carefully describe expectations such as the commercialization potential of the project, the financial feasibility, and the potential benefits for the region. An expert panel, consisting of internal and external referees, executes the evaluation of the project proposal, paying particular attention to the economic valorization potential of the project. The original funding data covers the period 1992 to 2011 and includes virtually all applications that were submitted during that period. Next to the applicant information, the subsidy amount, the total projects costs and, hence, the subsidy rate, the funding data contain information on the starting and end date, i.e., the duration of the project and the specific scheme under which the project was submitted. Firms can apply for different schemes within the R&D program that distinguish (basic) research projects from experimental product or process development, as well as mixed projects that involve both research and development.
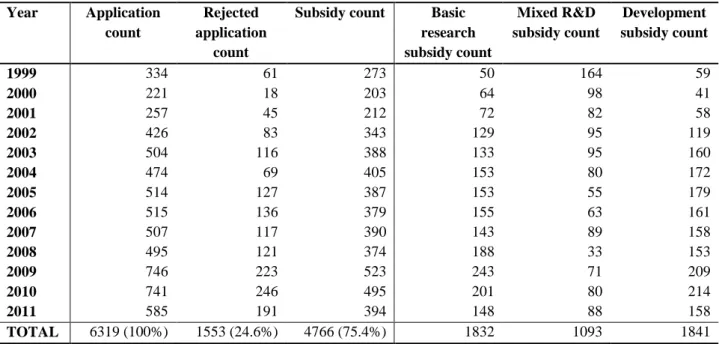
Table 1 displays an overview of the granted and rejected R&D subsidy applications in Flanders in the period 1999–2011. The total number of R&D grants throughout the period under study amounts to 4,766. About one quarter of all subsidy applications was rejected during the 13 years considered, resulting in an overall grant rate of 75.4%. The number of granted R&D subsidies and also the number of denied applications peaked in the post-financial crisis years 2009 and 2010. Of the firms that applied for a subsidy, the average application count amounts to 1.3 in a certain year. The total count of research grants (1,832; 38.4%) is similar to the total count of development grants (1,841; 38.6%), whereas the total mixed R&D subsidy count is lower (1,093; 22.9%). The different schemes differ in their subsidy rate. Due to the potentially higher social returns and spillover effects, basic research projects tend to be co-funded by the agency with a larger share (56.0% on average), while
9
development projects have an average subsidy rate of 37.6%. Subsidy rates for mixed projects are usually in-between the two (with a mean of 46.0%). The overall subsidy rate is 46.4%.
--- Insert Table 1 here ---
We obtain information on the firms’ overall R&D and innovation activities from the Flemish part of the OECD R&D surveys.3 We match firms from the ICAROS subsidy database with the R&D surveys based on the firms’ unique tax numbers. In addition, the R&D surveys cover the vast majority of potentially R&D-active firms in Flanders, which provides us with a large ‘control group’ of firms that did not apply for R&D subsidies.
In addition, the BELFIRST database assembled by Bureau van Dijk provides financial and accounting information of all firms in our sample, which we can also merge using tax numbers. Based on firms’ names and addresses, we further collect firms’ patent applications (and granted patents) from the PATSTAT database provided by the European Patent Office. Due to the entry and exit of firms and the non-compulsory nature of the R&D surveys, the resulting panel structure is unbalanced. Therefore, we require that each firm is observed at least twice in the dataset in order to estimate meaningful panel data models. After the elimination of incomplete records and outliers, the final dataset comprises 5,796observations from 1,689 different firms, covering the period 2000–2012.4 The final sample employed in this study consists of firms at different stages of maturity and active in different sectors. Table 2 shows the industry structure of the firms in the sample.
--- Insert Table 2 here ---
3.2 Variables
Debt financing
The main dependent variable is the firm’s average cost of debt. We compute this indicator by dividing interest paid5 in year t by the amount of total assets in year t (cost of debtt).
Normalizing interest paid by means of total assets allows accounting for differences in firm size and hence potential gross financing needs. Moreover, this results in a comparable measure of debt charges across firms, irrespective of their debt levels, and indicates how
3
The Flemish R&D survey is conducted every two years according to the Frascati-Manual (OECD [2002], ‘Proposed Standard Practice for Surveys on Research and Experimental Development: Frascati Manual: The Measurement of Scientific and Technological Activities Series’, Paris).
4 This time period starts 1 year after the aforementioned time period of 1999–2011 covering the subsidy
information as a 1-year lag of the subsidy variables is used in the analyses.
10
much interest the firm pays per asset employed. Further, scaling interest paid by debt levels would be rather inappropriate because the relative amounts of short-term and long-term debt are added to the model as explanatory variables due to their impact on interest paid. In addition, to measure access to debt financing we derive a variable indicating whether the firm increased its debt in year t compared to the previous year (change in debtt).
R&D Subsidies
From the detailed subsidy information, we can derive a variety of subsidy indicators. We employ a multitude of different indicators in the analysis to avoid the possibility that effects are due to a specific measurement of the subsidy receipt. The first variable is the R&D subsidy rate, i.e., the share in the total R&D project borne by the funding agency (subsidy ratet-1). We can split the subsidy rate variable into the three types of subsidies: basic research
subsidies (basic subsidy ratet-1), mixed subsidies (mixed subsidy ratet-1), and development
subsidies (development subsidy ratet-1). We employ a one-year lag to prevent direct
simultaneity between dependent and independent variables. In addition, we construct a simple binary variable indicating whether the firm received at least one R&D subsidy (subsidy dummyt-1) and a count of the number of granted subsidies (subsidy countt-1). A further main
independent variable indicates whether the firm submitted at least one subsidy application that was rejected (rejected dummyt-1).
In a set of additional tests, we employ different versions of these variables in the model. These measures include the total amount of received subsidies scaled by total assets ([subsidy amount/total assets]t-1), the count of subsidy applications including rejected ones (application
countt-1), and the share of granted subsidies over the total number of applications (grant rate
t-1). The regressions also include a set of past subsidy indicators relating to the years t-2 and t-3
which allow us to test for the persistency of the subsidy effect over time.
Control Variables
The amount of R&D investments gives an indication of the overall funding requirements for R&D in year t. In addition, this variable controls for the firms’ risky, longer-term investments that typically face a higher capital cost compared to other types of investment. As the distribution of R&D expenditures across firms is highly skewed, we scale it by the number of
11
employees (R&D expenditures per emplt). The firm’s patent stock6 serves as a proxy for past
R&D success (ln[patent stock]t-1) and it controls for other signaling mechanisms that have
been shown to matter in the context of R&D financing (see e.g., Hottenrott et al., 2015a). The ratio of cash flow over total assets in year t-1 allows us to account for past firm performance, as well as for the presence of internal funds ([cashflow/total assets]t-1). In addition, the extent
to which current assets cover current liabilities is an indicator of the current operating liquidity or solvency (liquidityt). We also account for the firm’s leverage by including the
level of short-term debt and the level of long-term debt, both scaled by total assets ( [short-term debt/total assets]tand [long-term debt/total assets]t). Other firm-level control variables
capture firm size effects (ln[empl]t), non-linearities (ln[empl2]t) in these effects, and firm age
(aget). Year dummies are included to capture business cycle effects that may affect both the
access to debt as well as the cost of debt. Industry dummies based on the firms’ main activity according to the NACE (rev. 2) capture sector-specific differences in models that do not contain firm fixed effects.7
3.3 Sample Characteristics
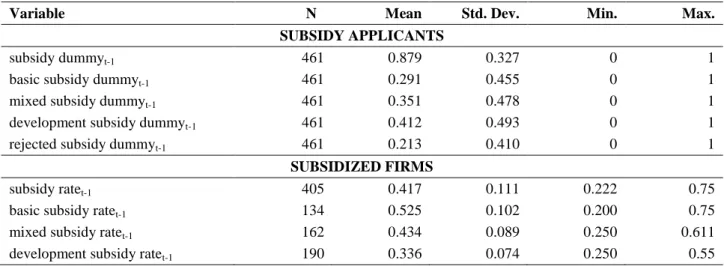
Table 3 displays summary statistics of the relevant variables for the applicants and the subsidized firms respectively. The final sample contains 461 applicant-year observations, which account for 780 applications during the period of analysis. Of the firms that filed at least one application in a certain year, 29.1% were granted at least one basic research subsidy, 35.1% a mixed subsidy, and 41.2% a subsidy for development projects. The total number of granted subsidies equals 668 and the number of rejected applications amounts to 112. In the final sample, 405 firm-year observations received at least one subsidy, of which at least 134 were ‘basic’, 162 were ‘mixed’, and 190 were ‘development grants’. Of the subsidized firms, the mean subsidy rate equals 41.7%.
--- Insert Table 3 here ---
Table 4 shows the distribution of first-time applications across years in our final sample. Of the total number of subsidy applications (780), about 14.7% are first-time subsidy applications.
--- Insert Table 4 here ---
6
A depreciation rate of 15% is assumed (see Griliches and Mairesse, 1984).
12
Table 5 shows the descriptive statistics of the full sample (both subsidized and non-subsidized firms). The mean debt charges are approximately 1.2% of total assets and about 38% of the firms increased their debt level compared to the previous year. Firms in the sample spend, on average, €5,163 per employee on R&D per year. The mean patent stock of all firms in the sample equals 1.17 and about 363 (i.e., 21.5% of all) firms have an average patent stock that is larger than zero in the period under study. Regarding the financial indicators, the firm’s average cash flow amounts to 9.4% of its total assets, current assets are typically 77.7% larger than current liabilities, and the ratios of short-term debt over total assets and long-term debt over total assets are equal to 10.6% and 14.2% respectively. The average age of the firms in the sample is 29 years (the median equals 24), while the mean size amounts to 235 employees (the median is about 81).
--- Insert Table 5 here ---
3.4 Identification Strategy
3.4.1 Base Model
The panel structure of our data allows the implementation of fixed effects regression models. The advantage of this method is that it accounts for time-constant unobserved heterogeneity through firm-specific effects. Cost of debt in firm 𝑖 is estimated as a function of subsidy application indicators, innovation-related measures, financial indicators, age and size controls, and business cycle effects. The general model can be written as follows:
𝐶𝑜𝑠𝑡 𝑜𝑓 𝑑𝑒𝑏𝑡𝑖 = 𝛼 + 𝑆𝑖𝛾 + 𝐼𝑖𝜆 + 𝐹𝑖𝜇 + 𝐴𝐸𝑖𝛿 + 𝑇𝑖𝜋 + 𝑢𝑖 + 𝑐𝑖 (1)
The vector 𝑆 consists of the subsidy application indicators: a variable referring to the subsidy receipt (either [subsidy rate]t-1, [subsidy dummy]t-1 or [subsidy count]t-1) and a variable
indicating whether firm 𝑖has at least one rejected subsidy application (rejected dummyt-1):
𝑆𝑖 = 𝜃1(𝑠𝑢𝑏𝑠𝑖𝑑𝑦 𝑟𝑒𝑐𝑒𝑖𝑝𝑡)𝑖+ 𝛽(𝑟𝑒𝑗𝑒𝑐𝑡𝑒𝑑 𝑑𝑢𝑚𝑚𝑦)𝑖 (2)
The vector 𝐼 in equation (1) comprises innovation-related measures such as the relative amount of R&D expenditures (R&D expenditures per emplt) and the patent stock (ln[patent
stock]t-1). 𝐹 consists of financial indicators such as past performance ([cashflow/total assets] t-1), liquidity (liquidityt) and debt leverage ([short-term debt/total assets]t and [short-term
debt/total assets]t). 𝐴𝐸 contains age (aget) and size controls (ln[empl]t and ln[empl2]t). 𝑇
comprises the set of year dummies. Further, 𝛾, 𝜆, 𝜇, 𝛿 and 𝜋 represent vectors of parameters to be estimated. Finally, parameter 𝑢 is the error term, and 𝑐 captures the time-constant firm-specific effect. The parameter 𝛼 is the constant.
13
A priori, one would expect 𝜃1 (in equation 2) to be negative in the presence of resource and/or certification effects. The next subsection clarifies the identification of the different mechanisms in more detail. Parameter 𝛽 is not expected to indicate a significant impact on cost of debt as a negative signal following from a rejected application is typically not observed (see e.g., Meuleman and De Maeseneire, 2012). The inclusion of the rejected application variable also captures a firm’s efforts to get a grant even if the application was not successful.
3.4.2 Identification of a Resource Effect
To identify the potential resource effects of an R&D grant receipt on the cost of debt, the vector 𝑆𝑖 of equation (1) is extended to the following expression:
𝑆𝑖 = 𝜃1(𝑠𝑢𝑏𝑠𝑖𝑑𝑦 𝑟𝑒𝑐𝑒𝑖𝑝𝑡)𝑖+ 𝜃2(𝑠𝑢𝑏𝑠𝑖𝑑𝑦 𝑎𝑚𝑜𝑢𝑛𝑡
𝑡𝑜𝑡𝑎𝑙 𝑎𝑠𝑠𝑒𝑡𝑠 )𝑖 + 𝛽(𝑟𝑒𝑗𝑒𝑐𝑡𝑒𝑑 𝑑𝑢𝑚𝑚𝑦)𝑖 (3)
In particular, we add the subsidy amount scaled by total assets ([subsidy amount/total assets]
t-1) on top of the subsidy receipt variable (either [subsidy rate]t-1, or [subsidy dummy]t-1). The
parameters to be estimated are 𝜃1, 𝜃2.and 𝛽.To identify the resource effects in addition to the main effect of the subsidy receipt (𝜃1), coefficient 𝜃2 denotes the sign and magnitude of the
liquidity impact of R&D subsidies on the cost of debt. The larger the subsidy amount relative to the firm’s asset base, the more relevant it should be for a bank’s lending decision. The potential influence of a resource effect should therefore be reflected in a significant and negative impact of the relative subsidy amount (𝜃2), next to the possible negative impact of the subsidy receipt as such (𝜃1).
3.4.3 Identification of a Certification Effect
The prominence of the certification effect can be identified by means of the subsidy receipt indicator as outlined in equation (3). In particular, coefficient 𝜃1 indicates the strength of this effect. If 𝜃1 points to a negative and significant impact of the subsidy receipt while the relative subsidy amount does not significantly affect cost of debt, the existence of a certification effect that lowers asymmetric information problems between the lender and investor will be confirmed.
Moreover, as the certification effect is expected to be stronger for more information-opaque activities (see e.g., Meuleman and De Maeseneire, 2012; Hottenrott et al. 2015b), an additional test for the identification of the certification effect is to divide the subsidy receipt
14
variable based on the three different schemes. Thus, the subsidy receipt indicator of the base model is adapted to the following expression:
𝑆𝑖 = ∑ 𝜃𝑘 5
𝑘=3
(𝑠𝑢𝑏𝑠𝑖𝑑𝑦 𝑟𝑒𝑐𝑒𝑖𝑝𝑡 𝑝𝑒𝑟 𝑠𝑐ℎ𝑒𝑚𝑒)𝑖 + 𝛽(𝑟𝑒𝑗𝑒𝑐𝑡𝑒𝑑 𝑑𝑢𝑚𝑚𝑦)𝑖 (4)
The coefficients 𝜃3, 𝜃4 and 𝜃5 are the parameters to be estimated for the basic subsidy, the mixed subsidy, and the development subsidy receipt respectively. Previous research has shown that financing constraints are particularly binding for investments in research projects compared to development, because information asymmetries are typically stronger for more basic research projects that are further away from commercialization and hence more uncertain in terms of their expected returns (Czarnitzki et al., 2011). Therefore, one would expect that the negative impact of the R&D subsidy receipt on a firm’s cost of debt is stronger for ‘basic subsidies’ (𝜃3) compared to ‘mixed’ (𝜃4) or ‘development’ subsidies (𝜃5).
3.4.4 Identification of a Formation Effect
For the identification of a formation effect, vector 𝑆𝑖 of the base model [equation (1)] is
adapted to the following specification:
𝑆𝑖 = 𝜃6(𝑔𝑟𝑎𝑛𝑡 𝑟𝑎𝑡𝑒)𝑖+ 𝜃7(𝑎𝑝𝑝𝑙𝑖𝑐𝑎𝑡𝑖𝑜𝑛 𝑐𝑜𝑢𝑛𝑡)𝑖 (5)
Parameter 𝜃6 estimates the effect of the firm’s success rate in the application process. Coefficient 𝜃7 captures the intensity to which a firm aimed at attracting R&D grants. This is an important control variable given that the grant rate may by definition decrease if the number of trials increases or – the other way around – firms may apply more frequently if not all applications had been successful.
If 𝜃6 shows a negative sign, that is, a lower cost of debt is observed for higher grant rates,
evidence will point in the direction of either the resource effect or the certification effect, depending on the outcome of the resource effect test [see equation (3)]. If 𝜃7 adversely influenced a firm’s debt charges, keeping the grant rate constant, the result would favor the existence of a formation effect. In particular, this would mean that applying for an R&D grant is beneficial in terms of having a lower cost of debt irrespective of the grant success. This would suggest that the application process provides learning potential per se, for instance, through inducing firms to prepare and revise their R&D project plans. Note that an additional way to test for the formation effect is to consider coefficient 𝛽 of the rejected application dummy variable [see equation (2)]. In particular, a negative and significant β in equation (1)
15
would allude to the preparation benefit of the subsidy application process in which the rejected grants also have an effect on interest rates.
3.4.5 Firm heterogeneity
If there are indeed indirect effects of R&D subsidies on firms’ cost of debt, we would expect them to be stronger for young, inexperienced, and less-established firms that do not yet have a sound reputation or strong relationships with their bank. To test for such differences, we perform the tests outlined in equations (4) and (5) for young and established firms separately.
4.
Results
4.1 Basic Model
Table 6 displays the results of the base model for three different versions of the R&D subsidy receipt variable: the subsidy rate, the subsidy dummy, and the subsidy count. As can be observed, the receipt of an R&D grant in year t-1 has a negative and significant impact on a firm’s average interest rate in year t, all else constant. As an illustration, a 100% increase of the past subsidy rate reduces the cost of debt by 0.202%, which is 14.4% of the average cost of debt (1.4%) of those firms with an initial positive cost of debt. Likewise, the coefficient of the subsidy dummy variable amounts to -0.077, meaning that the receipt of an R&D grant in year t-1 lowers the share of debt charges over total assets in year t by 5.5% of the mean cost of debt of all firms in the sample.8 The variable indicating the number of denied R&D grant requests does not significantly affect the cost of debt capital. This is in line with previous evidence suggesting that external parties do not observe the negative signal of a rejected subsidy application (Meuleman and De Maeseneire, 2012). Although the signs of the past subsidy indicators relating to the years t-2 and t-3 are negative, they are not statistically significant.9
The signs of the coefficients of most control variables are as expected. R&D spending has a positive impact on a firm’s external capital cost. This is consistent with existing research that has shown that financing R&D investment externally is more expensive compared to capital investment (Czarnitzki and Hottenrott, 2011a). The patent stock is not statistically significant. The cash flow measure highlights that past firm performance, marking the presence of internal funds, has a strong and negative impact on cost of debt. Further, firms that have a
8
-0.077/0.014 = -5.5
16
higher operating liquidity ratio pay, on average, less debt charges. As expected, the amount of debt charges positively correlates with the firm’s level of debt. Likely because of long-term relationship lending and reputation building, older firms face, on average, a lower capital cost. Firm size, measured by the number of employees, has an inverse U-shaped effect.10
Insert Table 6 here
---4.2 Resource or Certification Effect?
To test for the existence of the resource effect, the relative subsidy amount is added to the base model. Table 7 shows the results. The subsidy rate and the binary subsidy variable remain significant. Receiving a larger total amount of subsidies, relative to total assets, does not significantly strengthen the negative influence on the cost of debt capital. This result suggests that the negative impact of a subsidy receipt on the cost of debt stems mainly from a certification effect and not only from a resource effect,11 supporting the view that the signaling value of receiving public support can significantly affect the cost of debt. The impact of the other control variables is very similar to the base model.
--- Insert Table 7 here ---
4.3 Formation Effect: Young versus Established Firms
As young firms in particular may benefit from acquiring experience in preparing their R&D project plans when applying for loans, we divide the sample into young and established firms to check for differences between the two groups. In a baseline version of the models, a firm is classified as being young when it belongs to the 50% youngest firms in the sample (i.e., their age is 23 years or younger). The regression results are displayed in Table 8. Model (1) and Model (3) contain the tests for a formation effect. For young firms (Model 1), the number of subsidy applications negatively influences their cost of debt, irrespective of whether or not the subsidy was granted. For more established firms, the share of granted subsidy applications matters, pointing only to the certification effect (Model 3). This result suggests the existence of a “preparation premium” for younger firms through applying for a subsidy. The financial part, in particular the commercialization potential of the R&D project, is especially important for the funding agency IWT. Hence, having gone through the grant application process of the
10 The maximum level of (debt charges/total assets) is at a firm size of 556 employees. 11
The VIF (variance inflation factor) test indicates that the inclusion of the subsidy amount in addition to the other subsidy indicators does not cause multicollinearity.
17
government agency may predominantly help inexperienced firms to strengthen their project outline, which also prepares them for a loan application process at a financial institution. Models (2) and (4) show that the subsidy rate is significant only for young firms. This is consistent with earlier studies pointing out that certification matters more where the degree of asymmetric information is high, which is typically the case for research projects for which the subsidy rate is higher, and for smaller and younger firms more generally (see e.g., Lerner, 1999; Meuleman and De Maeseneire, 2012). It is, however, remarkable that for young firms, having a rejected subsidy application is also negatively associated with its average interest rate (Model 2). This again points to the existence of a formation effect, i.e. a beneficial effect of the subsidy application irrespective of the grant decision. For established firms, the rejected variable is not significant (Model 4).
Insert Table 8 here
---Table 9 shows the results of the regressions that make a distinction between the three different subsidy schemes. For young firms, the negative impact on cost of debt is driven significantly by grants for basic research projects. As information asymmetries between the firm and the external financier are typically larger for research projects compared to development, the signal from research grants, but also the “preparation premium”, can be higher. Hence, the cost of debt can be reduced by providing information on the quality of the young firm’s research to an external investor. For older firms, all three subsidy types have a negative impact on cost of debt, but the coefficient is only significant for mixed grants. This suggest that older firms not only seem to benefit less from the grant preparation process, but also that the certification effect is potentially weaker and the significant main effects (Tables 6 and 7) were driven by the younger firms in the sample.
--- Insert Table 9 here ---
4.4 Robustness Tests
4.4.1 Substitution Effect
An alternative interpretation of the possible impact of R&D subsidies on cost of debt could be that subsidies are a substitute for debt, in that way lowering debt charges. To this end, we examine the impact of the subsidy rate (subsidy ratet-1) on the propensity to raise debt (change
18
in debtt)12 by estimating a random effects probit regression. Table 10 shows the impact of the
subsidy rate on the propensity to raise debt. Consistent with previous studies, the results show that firms with a higher subsidy rate are more likely to increase their debt, ruling out the dominance of a substitution effect. The result also supports our finding that the resource effect of public R&D subsidies plays a minor role as regards access to loans and cost of debt. In particular, receiving an R&D subsidy does not necessarily lead to lower debt levels and consequently lower debt charges.
--- Insert Table 10 here --- 4.4.2 Time period-specific events
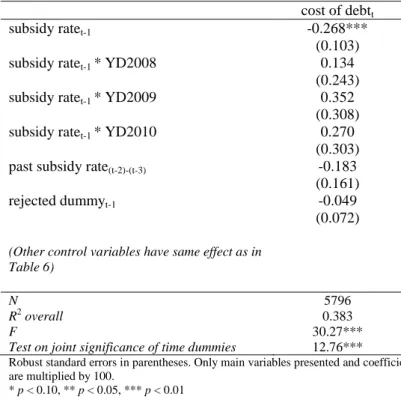
The time span of our panel covers the years before, during, and after the global financial crisis that started in 2008. The financial crisis had a considerable impact on R&D and innovation in many countries (OECD, 2012). In periods of high demand uncertainty and constrained budgets, it becomes more important to selectively allocate available resources to investment options. To examine whether the financial crisis drives or intensifies the effects, we add interaction terms of the years 2008–2010 with the subsidy rate to equation (1). Table 11 displays the results. Adding these interaction terms does not affect the previous results and the interaction terms are insignificant. This indicates that the certification effect was not significantly stronger in any of these years which is consistent with the observation that in Belgium the business enterprise expenditure on R&D remained more or less stable (and even slightly increased) during the crisis years (OECD, 2012).
--- Insert Table 11 here --- 4.4.3 Endogeneity of the subsidy receipt and selection issues
As a final robustness test, we use a non-parametric nearest-neighbor propensity score matching (NNPM) to check whether the fixed effects regression results hold when accounting for possible self-selection or agency-based selection of firms into the subsidy program that could bias the presented estimation results. In other words, we estimate the difference between the cost of debt of R&D subsidy recipients and the counterfactual situation where these firms would not have received a subsidy.13 The advantage of this method is that it does
12 In the model on change in debt, the number of observations decreases, as missing values and outliers of the
lagged debt values have to be removed (contemporaneous debt levels are used in the other regressions).
13
We follow the matching protocol of Gerfin and Lechner (2002). See Hottenrott and Lopes-Bento (2014) for a detailed description of an application of the method.
19
not require assumptions about the error term or functional form. Another way to address selection issues is to implement an instrumental variables estimation. The downside of this method, however, is that one needs valid instruments, a requirement that is challenging and the bias in the case of weak instruments can be severe.
In the selection stage of the matching procedure, we account for factors that likely explain the grant decision of the agency. Thus, in order to obtain the propensity score, we estimate a cross-sectional probit model with clustered standard errors on the likelihood of receiving an R&D subsidy (see Table 12a). To appropriately account for the selection into the subsidy program, we chose those control variables that have been shown to be important in the R&D subsidy application procedure in previous studies using data from the same funding agency (see e.g., Aerts and Czarnitzki, 2006; Czarnitzki and Lopes-Bento, 2013; Hottenrott and Lopes-Bento, 2014). Specifically, we add a past application dummy indicating whether the firm applied for a subsidy in the two years before t-1 to control for application experience. Further, we control for whether the firm was active in an R&D cooperation in year t-1 as this is highly encouraged by the government agency that grants the R&D subsidies and thus may drive the selection. Finally, firm-level control variables such as R&D expenditures, age, size, debt leverage, and other financial indicators, are supposed to capture important factors that may drive both the firms’ decision to apply for a subsidy and the grant decision of the agency.
Insert Table 12a here
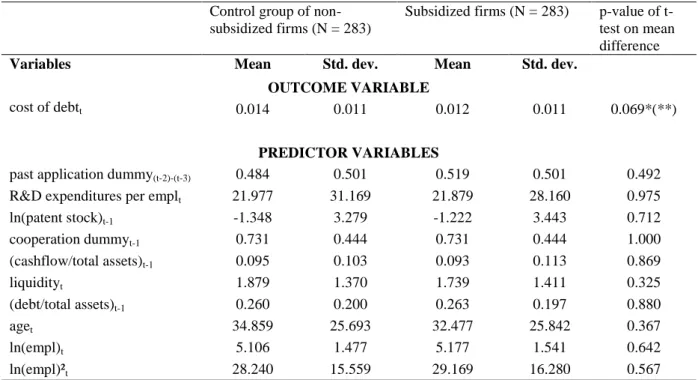
---After estimating the propensity score, we restrict the sample to common support. In other words, we delete all observations on treated firms for which the probabilities are smaller than the minimum or larger than the maximum in the control group. Moreover, we impose the restriction that matched pairs have to be overserved in the same year given the likely fluctuations of interest rates over the years. After implementing the matching procedure, we compare the treated group to the selected control group and find that only the outcome variable is significantly different between both groups. This indicates that for every subsidized firm a good match had been found in the group of non-subsidized firms. The results in Table 12b show that even when accounting for possible self- and agency selection into the subsidy program, the R&D subsidy recipients have a lower cost of debt compared to the non-recipients, providing additional support for the existence of the certification effect.
20
The same matching analysis is executed to test the robustness of the result that subsidized versus non-subsidized firms differ in their access to debt. Here, we impose the restriction that matched pairs are required to operate in the same industry given the fact that banks usually adjust their loan-granting process for each industry. The results are displayed in Table 12c and indicate that subsidized firms are more likely to increase their debt levels compared to non-subsidized firms. In other words, a substitution effect in which subsidies replace debt does not drive the result that subsidized firms face lower cost of debt.
--- Insert Table 12c here ---
5.
Concluding Remarks
Firms’ ability to finance R&D activities is crucial for the innovation potential of these firms and hence for their competitiveness. Previous research stressed the role of R&D subsidies as a major policy tool for supporting R&D activities in the private sector (see e.g., Klette et al., 2000). Recently, studies have pointed to secondary effects of such subsidy schemes. In particular, selective R&D grants may serve as certification devices to firms, improving their access to financing (Lerner, 1999; Feldman and Kelley, 2006; Colombo et al. 2011; Meuleman and De Maeseneire, 2012). The contribution of this study to the existing literature on the certification effect of R&D grants is twofold. First, while prior studies examined whether the receipt of R&D subsidies increases a firm’s ability to raise debt levels, this study is the first to investigate the impact on the cost of debt. Second, scholars generally attribute the effect to quality signaling, albeit only few attempts have been made to identify multiple effects of obtaining public support on external financing. In principle, two other possible mechanisms may explain improved access to financing in addition to a certification effect. On the one hand, resource effects – in the sense that the subsidy serves as a liquidity shock and hence reduces the need to raise debt (or the amount required) and increases lenders’ confidence in a firm’s financial situation – may ease access to and lower the cost of debt. On the other hand, a formation effect – in which applicants learn from the application procedure in terms of preparing a decent R&D project proposal – may affect lenders’ decision to provide funding.
The results show that obtaining a grant is indeed negatively associated with firms’ average debt charges. For young firms, the effect predominantly stems especially from subsidies for basic research, the stage of the R&D process where information asymmetries are typically
21
larger. The magnitude of the received amount, however, does not explain this effect, which points to a minor importance of a resource effect. Thus, we conclude that this result mainly stems from a process of certification in which the subsidy signals the quality of the firms’ R&D to external investors, thereby also reducing the screening costs of the debt provider. In addition, young firms seem to benefit from a ‘formation effect’. For them a grant application is related to lower average debt charges, independent of whether the application was granted or not, whereas for more established firms grant success matters. Application experience may help especially younger firms to prepare better research project plans, e.g., descriptions that lay out the commercialization or valorization potential more convincingly. Thus, experience with evaluations of their R&D plans can generate a “preparation premium” when applying for a loan and when subsequently negotiating the cost of debt.
As R&D-intensive young firms are important for a region’s economic growth, the findings of this paper provide policy makers with an additional rationale for granting R&D subsidies to financially constrained firms with the aim to foster private R&D projects. However, the R&D subsidy assignment policy has to be set up appropriately, in a manner that makes sure that the screening process a firm has to go through when applying for an R&D grant is indeed selective and based on quality criteria and not, for instance, on sector quotas. In this way, subsidies could have a supplementary function on firms’ ability to execute risky but promising research projects by improving their access to external financing and decreasing their external capital cost. In addition, the screening process could also assist young firms in critically reflecting on their own projects, thereby preparing them to apply for funding at other financiers.
Despite the comprehensive analysis, this study is not without limitations. Although banks attach less importance to the entrepreneur compared to other funding providers such as business angels (Mason and Stark, 2004) and we do account for firm performance which has been shown to be strongly related to human capital and managerial competencies (see e.g., Haber and Reichel, 2007), we cannot control for management quality or other entrepreneur-specific factors that are unobserved but time-variant. Second, the data does not allow us to distinguish between the cost of debt of short-term versus long-term loans. If R&D activities were mainly financed through short-term debt due to the risky nature of the projects, it would be interesting to test whether it is mainly short-term or long-term interest rates that are affected by an R&D grant receipt. Finally, we suggest further research on the dynamics between subsidy program participation and firms’ cost of debt using actual loan request data.
22
Linking the grant application or receipt to specific loan requests and decisions would be highly desirable and could serve as a test of our results based on rather aggregate information.
6.
References
Achleitner, A.-K., Braun, R., & Kohn, K. (2011). New venture financing in Germany: Effects of firm and owner characteristics. Zeitschrift für Betriebswirtschaft, 81(3), 263–294.
Aerts, K., & Czarnitzki, D. (2006). The impact of public R&D – funding in Flanders, IWT StudyNo. 54, Brussels.
Aerts, K., & Schmidt, T. (2008). Two for the price of one?: Additionality effects of R&D subsidies: A comparison between Flanders and Germany. Research Policy, 37(5), 806–822. Aghion, P., Howitt, P., & Mayer-Foulkes, D. (2005). The effect of financial development on convergence: Theory and evidence. Quarterly Journal of Economics, 120(1), pp.173–222. Baum, J. A., & Silverman, B. S. (2004). Picking winners or building them? Alliance, intellectual, and human capital as selection criteria in venture financing and performance of biotechnology startups. Journal of Business Venturing, 19(3), 411–436.
Bottazzi, L., & Da Rin, M. (2002). Venture capital in Europe and the financing of innovative companies. Economic Policy, 17(34), 229–270.
Brown, J. R., Fazzari, S. M., & Petersen, B. C. (2009). Financing innovation and growth: Cash flow, external equity, and the 1990s R&D boom. The Journal of Finance, 64(1), 151– 185.
Cardon, M. S., Sudek, R., & Mitteness, C. (2009). The impact of perceived entrepreneurial passion on angel investing. Frontiers of Entrepreneurship Research, 29(2), 1–15.
Carpenter, R. E., & Petersen, B. C. (2002). Is the growth of small firms constrained by internal finance?. Review of Economics and Statistics, 84(2), 298–309.
Chen, X. P., Yao, X., & Kotha, S. (2009). Entrepreneur passion and preparedness in business plan presentations: a persuasion analysis of venture capitalists' funding decisions. Academy of Management Journal, 52(1), 199–214.
23
Clausen, T. H. (2009). Do subsidies have positive impacts on R&D and innovation activities at the firm level?. Structural Change and Economic Dynamics, 20(4), 239–253.
Colombo, M. G., Grilli, L., & Murtinu, S. (2011). R&D subsidies and the performance of high-tech start-ups. Economics Letters, 112(1), 97–99.
Czarnitzki, D. (2006). Research and development in small and medium‐sized enterprises: The role of financial constraints and public funding. Scottish Journal of Political Economy, 53(3), 335–357.
Czarnitzki, D., & Hottenrott, H. (2011a). R&D investment and financing constraints of small and medium-sized firms. Small Business Economics, 2011, 36(1), 65–83.
Czarnitzki, D., & Hottenrott, H. (2011b). Financial constraints: Routine versus cutting edge R&D investment. Journal of Economics & Management Strategy, 20(1), 121–157.
Czarnitzki, D., Hottenrott, H. & Thorwarth, S. (2011). Industrial research versus development investment: the implications of financial constraints. Cambridge Journal of Economics, 35(3), 527–544.
Czarnitzki, D., & Lopes-Bento, C. (2013). Value for money? New microeconometric evidence on public R&D grants in Flanders. Research Policy, 42(1), 76–89.
David, P. A., Hall, B. H., & Toole, A. A. (2000). Is public R&D a complement or substitute for private R&D? A review of the econometric evidence. Research Policy, 29(4), 497–529. Degryse, H., & Van Cayseele, P. (2000). Relationship lending within a bank-based system: Evidence from European small business data. Journal of Financial Intermediation, 9(1), 90– 109.
De la Fuente, A., & Marin, J. (1996). Innovation, bank monitoring, and endogenous financial development. Journal of Monetary Economics, 38(2), 269–301.
Feldman, M. P., & Kelley, M. R. (2006). The ex-ante assessment of knowledge spillovers: Government R&D policy, economic incentives and private firm behavior. Research Policy, 35(10), 1509–1521.
Francis, J. R., Khurana, I. K., & Pereira, R. (2005). Disclosure incentives and effects on cost of capital around the world. The Accounting Review, 80(4), 1125–1162.
24
Gerfin, M., & Lechner, M. (2002). A microeconometric evaluation of the active labour market policy in Switzerland. The Economic Journal, 112(482), 854–893.
Gompers, P., & Lerner, J. (2001). The venture capital revolution. Journal of Economic Perspectives, 15(2), 145–168.
Griliches, Z. and Mairesse, J. (1984). Productivity and R&D at the firm level. In: Griliches, Z. (Ed.), R&D, Patents, and Productivity. University of Chicago Press, Chicago, IL, 339–374. Grilli, L., & Murtinu, S. (2012). Do public subsidies affect the performance of new technology-based firms? The importance of evaluation schemes and agency goals. Prometheus, 30(1), 97–111.
Grilli, L., & Murtinu, S. (2015). Selective subsidies, entrepreneurial founders' human capital, and access to R&D alliances, SSRN Electronic Journal 03/2015; DOI:10.2139/ssrn.2592408.
Haber, S., & Reichel, A. (2007). The cumulative nature of the entrepreneurial process: The contribution of human capital, planning and environment resources to small venture performance. Journal of Business Venturing, 22(1), 119–145.
Hall, J. & Hofer, C. W. (1993), Venture capitalists' decision criteria in new venture evaluation. Journal of Business Venturing, 8(1), 25–41.
Hall, B. H., & Lerner, J. (2010). The financing of R&D and innovation. In: Hall, B. H. & Rosenberg, N. (Ed.), Handbook of the Economics of Innovation (Chapter 14), Elsevier B.V., Amsterdam, 1, 609-639.
Himmelberg, C.P. & Petersen, B.C. (1994). R&D and internal finance: A panel study of small firms in high-tech industries. The Review of Economics and Statistics, 76(1), 38–51.
Hottenrott, H., Hall, B. H., & Czarnitzki, D. (2015a). Patents as quality signals? The implications for financing constraints on R&D. Economics of Innovation and New Technology, forthcoming.
Hottenrott, H., Lins, E. & Lutz, E. (2015b).The effect of subsidies on new ventures’ access to bank loans. Mimeo
Hottenrott, H., & Lopes-Bento, C. (2014). (International) R&D collaboration and SMEs: The effectiveness of targeted public R&D support schemes. Research Policy, 43(6), 1055–1066.