https://doi.org/10.17037/PUBS.04654954
Downloaded from: http://researchonline.lshtm.ac.uk/id/eprint/4654954/ DOI:https://doi.org/10.17037/PUBS.04654954
Usage Guidelines:
Please refer to usage guidelines at https://researchonline.lshtm.ac.uk/policies.html or alternatively contact researchonline@lshtm.ac.uk.
Socioeconomic inequalities in
colorectal cancer survival
in England and Japan
Mari Saito
Thesis submitted in accordance with the requirements for the degree
of
Doctor of Philosophy
of the
University of London
May 2019
Department of Non-Communicable Disease Epidemiology
Faculty of Epidemiology and Population Health
LONDON SCHOOL OF HYGIENE & TROPICAL MEDICINE
No funding received
been derived from other sources, I confirm that this has been indicated in the thesis.
Signed:
Date:
improvement in early diagnosis and treatment. However, inequalities in cancer survival remain, not only between but also within countries; survival varies by gender, age, ethnicity and socioeconomic status. Notably, socioeconomic inequalities in cancer survival were observed in England and part of Japan, despite healthcare systems based on universal health coverage. Particularly, colorectal cancer (CRC) has a wide range of variability in its survival by
deprivation. For example, 3 to 10% difference in 1-year net survival for CRC between the least and the most deprived has been reported in both countries. However, the mechanisms of socioeconomic inequalities in cancer survival are still not fully understood.
I examined whether socioeconomic inequalities in CRC treatment and survival existed in current data, and explored factors associated with the inequalities by investigating data from whole England and Osaka University Hospital in Japan.
Firstly, I examined socioeconomic disparities in receipt of major surgery for the primary lesion and the postoperative mortality. Secondly, I examined the socioeconomic gap in CRC survival using flexible parametric models. Lastly, I proceeded to mediation analysis, a novel technique, to investigate the mechanism of survival inequalities.
In England, socioeconomic inequalities in survival existed for both colon and rectal cancer in the stages of potential for cure. There were socioeconomic inequalities in receipt of surgery for rectal cancer, and in postoperative mortality for colon cancer in England. In Japan, no
socioeconomic inequalities existed in receipt of major surgery and survival.
Results of mediation analyses revealed that, in England, reducing emergency presentation for both colon and rectal cancer and improving postoperative care for colon cancer may reduce the survival inequalities. In Japan, further investigation with a larger population is needed to determine the survival inequalities and understand its mechanism.
suggestions and support over the past four years have always been precious and encouraging for me. I also feel honoured to be awarded a British Council Japan Association (BCJA) scholar.
Secondly, I would like to appreciate members of the Cancer Survival Group at the London School of Hygiene & Tropical Medicine for their technical support. I was always grateful to Yuki and Adrian for their prompt help. I would especially like to thank Manuela for providing data cleaning strategies, and for her kind advice and moral support.
For data acquisition from Japan, I cannot express enough my feelings of appreciation to Professor Tomotaka Sobue and Dr Yuri Kitamura at the Osaka University Hospital (OUH) for their generous support and encouragement, and Dr Yuri Ito and Dr Keisuke Fukui at the Osaka Medical University for preparing the dataset while their busy schedule.
I would like to express my gratitude to patients in England and OUH for their participation to cancer registries.
Lastly, I would like to thank my husband Makoto and other family members for supporting me. Especially, I would like to thank Makoto, for taking time with hours of stimulating
1.1 Global burden of cancer ... 17
1.2 Socioeconomic inequalities in cancer survival in countries with universal health coverage ... 18
1.2.1 Universal health coverage ... 18
1.2.2 Socioeconomic inequalities and terminology ... 18
1.2.3 Study rationale: why focusing on healthcare system to tackle health inequalities? . 20 1.3 Colorectal cancer in England and Japan ... 23
1.3.1 Epidemiology ... 23
1.3.2 Population characteristics ... 24
1.3.3 Governance of healthcare system and cancer policy ... 25
1.3.4 Provider reimbursement and incentives ... 26
1.3.5 Resources and workforce ... 27
1.3.6 Screening, diagnosis and treatment ... 29
1.3.7 Patient pathways for CRC patients ... 32
1.3.8 Potential steps on the patient pathway where inequalities may rise ... 36
1.3.9 Receipt of treatment as a measure of healthcare access ... 36
1.4 Aims and objectives ... 38
1.4.1 Aims... 38
1.4.2 Objectives ... 38
1.5 Thesis structure ... 38
Chapter 2: Literature review ... 39
2.1 Inequalities in receipt of treatment in UHC countries ... 39
2.1.1 Introduction and methods ... 39
2.1.2 Results ... 43
2.1.3 Discussion ... 74
Chapter 3: Data materials and methods ... 77
3.1 Data acquisition and ethics approval ... 77
3.3 Statistical analysis ... 82
3.3.1 Mediation analysis under the causal inference framework ... 83
Chapter 4: Colorectal cancer in England ... 85
4.1. Factors associated with receipt of major surgery and socioeconomic inequalities in receipt of surgery ... 85
4.1.1 Methods ... 85
4.1.2 Results ... 88
4.1.3 Summary of findings ... 110
4.2 Postoperative 30-day mortality by socioeconomic status ... 111
4.2.1 Methods ... 111
4.2.2 Results ... 112
4.2.3 Summary of findings ... 120
4.3 Survival by socioeconomic status ... 121
4.3.1 Methods ... 121
4.3.2 Results ... 123
4.3.3 Summary of findings ... 134
4.4 Factors associated with survival and socioeconomic inequalities in survival ... 135
4.4.1 Methods ... 135 4.4.2 Results ... 137 4.4.3 Summary of findings ... 180 4.5 Mediation analysis ... 181 4.5.1 Methods ... 181 4.5.2 Results ... 185 4.5.3 Summary of findings ... 191 4.6 Discussion ... 192
4.6.1 Socioeconomic inequalities in receipt of surgery and postoperative mortality……… ... 192
Chapter 5: Colorectal cancer in Osaka, Japan ... 199
5.1. Factors associated with receipt of major surgery and socioeconomic inequalities in receipt of surgery ... 199
5.1.1 Methods ... 199
5.1.2 Results ... 201
5.1.3 Summary of findings ... 214
5.2 Survival by socioeconomic status ... 215
5.2.1 Methods ... 215
5.2.2 Results ... 216
5.2.3 Summary of findings ... 220
5.3 Factors associated with survival and socioeconomic inequalities in survival ... 221
5.3.1 Methods ... 221
5.3.2 Results ... 222
5.3.3 Summary of findings ... 228
5.4 Discussion ... 232
5.4.1 Socioeconomic inequalities in receipt of surgery ... 232
5.4.2 Socioeconomic inequalities in survival ... 233
5.4.3 Strengths and limitations ... 234
Chapter 6: Discussion ... 236
6.1 Main findings ... 236
6.2 Strengths and limitations ... 236
6.3 Future studies ... 240
6.4 Recommendations for England and Japan ... 242
6.5 Conclusion ... 245
Appendix 2 Histology grouping……….. 266
Appendix 3 Operation code and name for colon cancer, England……….. 267
Appendix 4 Operation code and name for rectal cancer, England……….. 269
Appendix 5 List of chronic and acute comorbidities……….. 271
Appendix 6 Operation code and name for colorectal cancer, Japan………... 272
Appendix 7 Distribution of imputed variables, England………. 273
Appendix 8 Distribution of time to treatment (days from diagnosis to major surgery) in rectal cancer patients, England………... 274
Table 1.2 Medical resources by England and Japan ... 28
Table 2.1 Search strategies in three search engines ... 41
Table 2.2 Newcastle-Ottawa Scale for cohort or case-control studies ... 42
Table 2.3 Literature identified for variations in cancer care by socioeconomic status ... 48
Table 2.4 Description of socioeconomic variations in mode of presentation ... 50
Table 2.5 Description of socioeconomic variations in place of treatment ... 51
Table 2.6 Description of socioeconomic variations in time to treatment... 52
Table 2.7 Description of socioeconomic variations in receipt of any treatment ... 55
Table 2.8 Description of socioeconomic variations in receipt of surgery ... 56
Table 2.9 Description of socioeconomic variations in type of surgery and others ... 58
Table 2.10 Description of socioeconomic variations in receipt of chemotherapy ... 60
Table 2.11 Description of socioeconomic variations in receipt of radiotherapy ... 62
Table 2.12 Description of socioeconomic differences in postoperative mortality or survival.... 63
Table 2.13 Description of socioeconomic differences in survival ... 65
Table 2.14 Summary of quality of studies by Newcastle-Ottawa Scale (NOS) for case-control and cohort studies ... 67
Table 4.1 Baseline characteristics of patients with colon cancer, England ... 90
Table 4.2 Baseline characteristics of patients with rectal cancer, England ... 92
Table 4.3 Odds ratios of not receiving major surgery for primary lesion using logistic regression for colon cancer, England ... 96
Table 4.4 Odds ratios of not receiving major surgery for primary lesion using logistic regression for rectal cancer, England ... 99
Table 4.5 Stage-specific odds ratios of not receiving major surgery for primary lesion using multivariable logistic regression with interaction between SES and stage for colon and rectal cancer, England ... 101
Table 4.6 Percentage of patients who received major surgery for the primary lesion as elective or emergency (colon and rectal cancer), England ... 102
Table 4.7 Reference number of days from diagnosis to major surgery for primary lesion and ratios using linear regression for colon cancer, England ... 105
Table 4.8 Stage-specific ratios and reference number of days from diagnosis to major surgery for primary lesion using multivariable linear regression with interaction between SES and stage for colon cancer, England ... 109
cancer, England ... 117
Table 4.11 Stage-specific odds ratios of postoperative death within 30 days using multivariable logistic regression with interaction between SES and stage for colon and rectal cancer, England ... 119
Table 4.12 AIC by number and position of knots for colon cancer, England ... 124
Table 4.13 AIC by number and position of knots for rectal cancer, England ... 125
Table 4.14 AIC of FPMs with SES (proportional or TVE), England ... 126
Table 4.15 Hazard ratios of death using Cox regression for colon cancer, England ... 139
Table 4.16 Hazard ratios of death using Cox regression for rectal cancer, England ... 142
Table 4.17 Stage-specific hazard ratios of death using multivariable Cox regression with interaction between SES and stage for colon and rectal cancer, England ... 145
Table 4.18 Hazard ratios (overall survival) and excess hazard ratios (net survival) of death using multivariable FPM with TVCs for colon cancer, England ... 148
Table 4.19 Hazard ratios (overall survival) and excess hazard ratios (net survival) of death using multivariable FPM with TVCs for rectal cancer, England ... 149
Table 4.20 Point estimates of hazard ratios (overall survival) and excess hazard ratios (net survival) of death for time-varying covariates at 90 days, 6 months and 1 year since diagnosis using multivariable FPM with TVCs and interaction between SES and stage for colon cancer, England ... 150
Table 4.21 Point estimates of hazard ratios (overall survival) and excess hazard ratios (net survival) of death for time-varying covariates at 90 days, 6 months and 1 year since diagnosis using FPM with TVCs and interaction between SES and stage for rectal cancer, England ... 152
Table 4.22 Stage-specific hazard ratios (overall survival) and excess hazard ratios (net survival) of death using multivariable FPM with TVCs and interaction between SES and stage for colon and rectal cancer, England ... 153
Table 5.1 Baseline characteristics of patients with colon or rectal cancer at Osaka University Hospital, Japan ... 203
Table 5.2 Odds ratios of not receiving major surgery for primary lesion using logistic regression for colorectal cancer, Osaka University Hospital, Japan ... 207
Table 5.3 Stage-specific oddds ratios of not receiving major surgery for primary lesion using multivariable logistic regression with interaction between SES and stage for colorectal cancer, Osaka University Hospital, Japan ... 209
Table 5.5 AIC by number and position of knots for colorectal cancer, Osaka University
Hospital, Japan ... 217 Table 5.6 AIC of FPMs with SES (proportional or TVE), Osaka University Hospital, Japan . 217 Table 5.7 Hazard ratios of death using Cox regression for colorectal cancer, Osaka University
Hospital, Japan ... 223 Table 5.8 Stage-specific hazard ratios using multivariable Cox regression with interaction
between SES and stage for colorectal cancer, Osaka University Hospital, Japan .. 225 Table 5.9 Hazard ratios of death and point estimates of stage-specific hazard ratios (overall
survival) for time-varying effect at 1 year and 1.5 years since diagnosis using multivariable FPM with TVE and interaction between SES and stage for colorectal cancer, Osaka University Hospital, Japan ... 227
Figure 1.2 Association between socioeconomic status, access to cancer care and survival ... 21
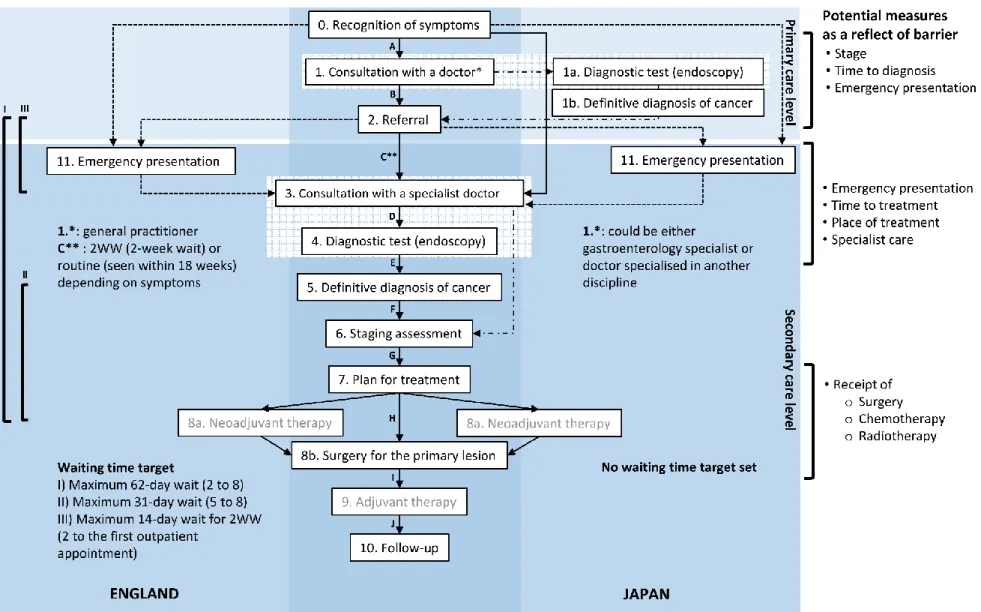
Figure 1.3 Patient pathways for colorectal cancer patients in England and Japan ... 33
Figure 2.1 Flow diagram for literature review ... 43
Figure 3.1 Example of DAG in mediation analysis ... 82
Figure 4.1 Mortality rate curves by different degrees of freedom for colon cancer, England .. 124
Figure 4.2 Excess mortality rate curves by different degrees of freedom for colon cancer, England ... 124
Figure 4.3 Mortality rate curves by different degrees of freedom for rectal cancer, England .. 125
Figure 4.4 Excess mortality rate curves by different degrees of freedom for rectal cancer, England ... 125
Figure 4.5 (a) Overall survival curves by FPM (b) survival curves by Kaplan-Meier method (c) log-cumulative hazards (d) mortality rates by SES group for colon cancer, England (SES set as time-varying effect)... 127
Figure 4.6 (a) Net survival curves by FPM (b) excess mortality rates by SES group for colon cancer, England (SES set as time-varying effect) ... 128
Figure 4.7 (a) Overall survival curves by FPM (b) survival curves by Kaplan-Meier method (c) log-cumulative hazards (d) mortality rates by SES group for rectal cancer, England (SES set as no time-varying effect)... 129
Figure 4.8 (a) Net survival curves by FPM (b) excess mortality rates by SES group for rectal cancer, England (SES set as no time-varying effect) ... 130
Figure 4.9 Upper graphs: overall survival, lower graphs: net survival for colon cancer, England. (a) Hazard ratio of SES 5 (b) difference in (excess) mortality rate per 1000 PYs (c) (overall/net) survival (%) in the most and least deprived groups (d) difference in (overall/net) survival (%) between the most and the least deprived groups ... 132
Figure 4.10 Upper graphs: overall survival, lower graphs: net survival for rectal cancer, England. (a) Difference in (excess) mortality rate per 1000 PYs (b) (overall/net) survival (%) in the most and least deprived groups (c) difference in (overall/net) survival (%) between the most and the least deprived groups ... 133
Figure 4.11 Hazard difference between the least and the most deprived groups for colon cancer, England ... 156
Figure 4.12 Overall survival of the least deprived group (SES 1, solid line) and the most deprived group (SES 5, dotted line) for colon cancer, England ... 158
cancer, England ... 162
Figure 4.15 Net survival of the least deprived group (SES 1, solid line) and the most deprived group (SES 5, dotted line) for colon cancer, England ... 164
Figure 4.16 Difference in net survival between the least and the most deprived groups for colon cancer, England ... 166
Figure 4.17 Hazard difference between the least and the most deprived groups for rectal cancer, England ... 168
Figure 4.18 Overall survival of the least deprived group (SES 1, solid line) and the most deprived group (SES 5, dotted line) for rectal cancer, England ... 170
Figure 4.19 Difference in overall survival between the least and the most deprived groups for rectal cancer, England ... 172
Figure 4.20 Excess hazard difference between the least and the most deprived groups for rectal cancer, England ... 174
Figure 4.21 Net survival of the least deprived group (SES 1, solid line) and the most deprived group (SES 5, dotted line) for rectal cancer, England ... 176
Figure 4.22 Difference in net survival between the least and the most deprived groups for rectal cancer, England ... 178
Figure 4.23 DAG of the first mediation analysis ... 183
Figure 4.24 DAG of the second mediation analysis ... 184
Figure 4.25 DAG of the third mediation analysis ... 184
Figure 4.26 Total causal effect and natural indirect effect in odds ratios of death at 90 days, 6 months, 1 year since diagnosis for colon cancer, England ... 186
Figure 4.27 Total causal effect and natural indirect effect in odds ratios of death at 90 days, 6 months, 1 year since diagnosis for rectal cancer, England ... 188
Figure 4.28 Proportion mediated in three mediation analyses with mediators of stage, stage and emergency presentation, and stage, emergency presentation and surgical treatment for colon (upper graph) and rectal cancer (lower graph), England ... 190
Figure 5.1 Mortality rate for colorectal cancer, Osaka University Hospital, Japan ... 216
Figure 5.2 (a) Overall survival curves by FPM (SES as proportional) (b) survival curves by Kaplan-Meier method (c) survival curves by FPM (SES treated as time-varying effect) for colorectal cancer, Osaka University Hospital, Japan ... 218
Figure 5.3 (a) Difference in mortality rate per 1000 PYs (b) overall survival (%) in the most and least deprived groups (c) difference in overall survival (%) between the most and the least deprived groups for colorectal cancer, Osaka University Hospital, Japan ... 220
group (SES 5, dotted line) for colorectal cancer, Osaka, Japan ... 230 Figure 5.6 Difference in overall survival between the least and the most deprived groups for
colorectal cancer, Osaka, Japan ... 231
5-FU Fluorouracil
95% CI 95% confidence interval A
ADI Area Deprivation Index (Japan) ADL Activities of daily living (Japan) AIC Akaike information criterion
AJCC American Joint Committee on Cancer APER Abdominoperineal excision of the rectum
AR Anterior resection
ASA grade American Society of Anesthesiologists grade C
CRC Colorectal cancer
CRT Chemoradiotherapy
CT Computed tomography
D
DAG Directed acyclic graph
DCH Designated Cancer Hospital (Japan)
df Degrees of freedom
DPC Diagnosis Procedure Combination (Japan) E
EGFR Epidermal Growth Factor Receptor EHR Excess hazard ratio
EMR Endoscopic mucosal resection ERUS Endorectal ultrasound
ESD Endoscopic submucosal dissection F
FFS Fee-for-service
FIT (iFOBT) Faecal immunochemical test (immunochemical faecal occult blood test) FOBT Faecal occult blood test
FOLFOX Folinic acid, 5-FU and oxaliplatin FPM Flexible parametric model G
gFOBT Guaiac-based faecal occult blood test H
HES Hospital Episode Statistics (England)
HR Hazard ratio
I
ICD-10 International Classification of Diseases tenth version ICU Intensive care unit
MAR Missing at random MDT Multidisciplinary team
MHLW Ministry of Health, Labour and Welfare (Japan) MRI Magnetic resonance imaging
N
NBOCA National Bowel Cancer Audit (England) NOS Newcastle-Ottawa Scale
NICE National Institute for Health and Care Excellence (England) NIE Natural indirect effect
NHS National Health Service (England) O
OECD Organisation for Economic Co-operation and Development OPCS-4 Office of Population Censuses and Surveys fourth version
OR Odds ratio
OUH Osaka University Hospital P
P4P Pay for performance
PM Proportion mediated
S
SCPRT Short-course preoperative radiotherapy SES Socioeconomic status
T
TCE Total causal effect
TEM Transanal endoscopic microsurgery TME Total mesorectal excision
TVC Time-varying covariate TVE Time-varying effect U
UHC Universal health coverage
UICC Union for International Cancer Control
UK United Kingdom
W
1.1
Global burden of cancer
Worldwide, cancer is a leading cause of death; in 2018, new cancer cases were estimated to be 18.1 million [1]. The disease has accounted for an estimated 9.5 million deaths in 2018, with the most common cancer sites of the deaths being lung, colorectal, stomach, liver and breast [1]. Significant improvements in cancer survival have been seen in the last two decades. This has been due to improvements in early diagnosis and treatment. However, inequalities in cancer survival remain, not only between but also within countries; survival varies by gender, age, ethnicity and socioeconomic status (SES). Notably, socioeconomic inequalities in cancer survival have been observed in England and a part of Japan, despite the national healthcare systems based on universal health coverage (UHC). In particular, colorectal cancer (CRC) has a wide range of variability in its survival by SES. For example, 3 to 10% difference in the one-year net survival for CRC has been reported between the least and the most deprived groups in both countries [2, 3].
Determinants of cancer survival include tumour (stage), patient (age, comorbidities and awareness [4]) and healthcare system factors (prompt access to specialist investigations, diagnostic assessment and stage-appropriate treatment) [5]. Previous research has examined factors such as perceived barriers to timely presentation [6] and the role of primary care in ensuring timely access to diagnosis [7]. However, the mechanism of how cancer care affects inequalities in cancer survival is not fully understood.
In this thesis, I examine whether the socioeconomic inequalities in survival exist in the current data and explore which factors could explain these inequalities by investigating data from England and Japan. Both countries have well-established UHCs, but England has a history of investigating socioeconomic inequalities, while Japan has only begun to examine them. I use the example of CRC since it is one of the five most common cancers affecting males and females in both countries.
1.2.1
Universal health coverage
Universal health coverage aims to offer quality healthcare services to all people according to their need, removing both financial and non-financial barriers as far as possible [8]. Non-financial barriers can mean acceptable healthcare services, for example in terms of quality of care delivered or distance to these services [8, 9].
Universal health coverage has three dimensions: the breadth, depth and height of coverage. The breadth means the proportion of the population covered, the depth the range of quality services covered, and the height the proportion of healthcare costs covered [10].
Although the extent of each dimension covered is different by UHC countries, basically, UHC should ensure financial protection and equity of access to healthcare. However, even in countries achieving UHC, socioeconomic inequalities in cancer care have been reported [11].
1.2.2
Socioeconomic inequalities and terminology
Kawachi et al. (2002) defined SES as an individual’s social and economic position related to others and consists of education, income and occupation [12]. Deprivation can be defined in two ways: absolute and relative [12-14]. Absolute deprivation is the inability to satisfy basic human needs (food and shelter) [12]. Relative deprivation is the deprivation relative to the standards in a society [12]. Socioeconomic inequalities in health partly reflect the consequence of relative deprivation [12].
Strictly speaking, the term socioeconomic ‘inequalities’ in survival means variations in survival among patients with different socioeconomic backgrounds. Inequalities do not involve any moral judgement [12]. On the other hand, ‘inequity’ implies inequalities which are unfair, unnecessary, systematic and socially produced, so avoidable (amenable) [9, 12, 15].
Equity in healthcare can be seen in two ways. Firstly, horizontal equity is ‘equal treatment for equal need’. The principle is that people with the same level of need should be assured of equal
In this thesis, I defined that the need is the ‘capacity to benefit from treatment’. Thus, the CRC patients, at the same stage and the same general condition should be offered equal treatment, irrespective of their socioeconomic circumstances. I assess how much of the effect of SES on survival could be explained by socioeconomic inequalities in healthcare access.
Inequalities in health can result from various causes. The Lalonde Report in 1974 suggested a conceptual model for the determinants of health [16]. In the ‘health field’ concept, health is determined by genetic predispositions, behaviour and lifestyle, environment, and healthcare systems. Subsequently, Whitehead and Dahlgren reported a framework for broader health determinants. Solving health inequalities not only requires improving access to essential facilities and services (i.e. healthcare systems), strengthening individuals and communities (to be able to make healthier choices) and encouraging macroeconomic and cultural changes, but it also requires equal distribution of these factors [17]. Healthcare systems are considered as ‘down-stream factors’, and other factors are considered as ‘up-stream factors’. For cancer, as shown in Figure 1.1, other than healthcare system factors, a patient’s health-seeking behaviour may have an impact on the timeliness of diagnosis. Lifestyle (e.g. smoking, obesity), age, comorbidities and genetic predispositions can also be potentially associated with survival inequalities.
Figure 1.1 Health field concept for colorectal cancer
primarily defined by education, occupation and income, but is also influenced by country affluence. A country’s affluence influences capacity in healthcare resources and the primary and secondary prevention of CRC, such as lifestyle change and screening [18]. Insufficient
healthcare resources can be one reason for people from different SES groups compete to receive cancer care. The competition may force patients to take responsibility for receiving a timely and appropriate diagnosis by themselves. The corresponding capacity to deal with this situation depends more on up-stream factors such as the ability to perceive, seek and engage [19]. Worse stage distribution may be observed in deprived groups as a consequence, and the competition may continue for receiving treatment. Accordingly, the final outcome, cancer survival can result in an unequal manner.
Figure 1.2 Association between socioeconomic status, access to cancer care and survival Modification from source: Alberto, 2013 [20].
healthcare access is translated into a final health outcome nor the mechanism of how inequities in a health outcome is generated. Nolte and McKee (2004) suggested the concept of ‘amenable mortality’ as an indicator assessing healthcare quality [21, 22]. Some studies have explored the association between inputs (health expenditure) and mortality [5, 23]. However, the relationship is difficult to interpret because of reverse causality [24].
Debates have raged on whether healthcare impacts on health outcomes [22]. So far, studies exploring mechanisms on how socioeconomic inequalities impact on cancer survival are sparse [25]. Cancer care requires high resource inputs and sophisticated coordination of care by multiple levels of healthcare factors [5, 26]. Survival is one of the key measures to assess the quality of cancer care in a country, and it reflects the progress of how people are treated [5]. Thus, evaluating the role of treatment on the effects of SES on survival is essential to tackle inequalities [26].
healthcare system in England and Japan. Next, I detail the diagnosis, treatment and patient pathway for CRC patients to highlight where socioeconomic inequalities in CRC survival may arise in each country.
1.3.1
Epidemiology
Colorectal cancer was estimated to be the third commonest diagnosed cancer in the world in 2018 [1]. Of cancer deaths worldwide, CRC accounted for 9.2%, with approximately 880,792 estimated deaths in 2018 [1]. CRC is also a growing public health burden in both England and Japan. England had 34,952 new CRC cases (age-standardised incidence rate 84.4 in males and 55.4 in females per 100,000 population), which made it the fourth most prevalent cancer in 2016 [27]. The total number of deaths from CRC in England was 13,417 in 2016, which accounted for 10% of all cancer deaths [28]. Japan had 158,127 new CRC cases (excluding carcinoma in situ, age-standardised incidence rate 77.5 in males and 47.3 in females per 100,000 population) in 2016, which was the third commonest cancer diagnosed in male and the second in female [29]. The total number of CRC deaths in Japan was 50,681 in Japan in 2017, which was the second largest cause of cancer deaths of all neoplasms [30].
Both countries have suffered socioeconomic inequalities in CRC survival. In England in 2006, the deprivation gap (i.e. a simple difference in survival estimates between the most and the least deprived groups) in one-year survival from colon and rectal cancer was approximately 7% in males and 10.6% in females [3]. In Osaka Prefecture, Japan in 2001–2004, the deprivation gap in one-year net survival from CRC was 6.3% in males and 2.9% in females [2].
in the United Kingdom [UK]), with 18% aged 65 years and over [31]. In 2016, life expectancy at birth in the UK was 81.0 [32]. The large gap in life expectancy between different local areas in England has been reported continuously [33, 34]. The Gini coefficient (income inequality) was 0.35 in the UK in 2016 [35]. The poverty rate (a ratio of the number of people whose income is under poverty line: defined as half the median of the household income in the total population) was 0.11 in 2016 [36]. In 2017, cancer was the most common cause of death at 28%, followed by cardiovascular diseases (heart diseases and strokes at 25%) in England and Wales [37]. Expenditure spent on cancer was £6.7 billion (United States [US]$ 9.6 billion) in 2012–2013 [38].
Japan has an estimated population of 126.8 million in 2017, with 27% aged 65 years and over. Japan’s life expectancy at birth was 84.0 years in 2016 [32]. Cancer was the leading cause of death at 30%, followed by heart disease (16%) and cerebrovascular disease (11%) in 2010 [39]. Of the total health expenditure at ¥ (Japanese Yen) 42 trillion (US$ 383 billion), 10.1% was spent on cancer care in 2016 [40]. The Osaka Prefecture, which is the site of this study in Japan, sits on the west side of the main island. The prefecture had an estimated population of 8.8 million in 2017, being the third most populated prefecture in Japan [41]. Japan has a relatively homogenous ethnic composition; however, health inequalities have begun to be reported, alongside a rising relative poverty rate since the economic recession in the 1990s [42, 43]. The Gini coefficient was 0.34 [35], and the poverty rate was 0.16 in 2015 [36]. The number of people in Osaka Prefecture, who receive public assistance because of their income falling below the minimum living standard, is by far the highest among the 47 prefectures in Japan.
Approximately 54‰ (permil, per 1,000 inhabitants) and 33‰ of the population in Osaka City and Osaka Prefecture, respectively, received the assistance, whereas at the national level, this figure was 16.9‰ in 2016 [44]. Population characteristics and cancer risk factors in England and Japan are shown in Table 1.1.
Abbreviations: GDP, Gross domestic product; UK, United Kingdom; US $, United States dollars. *Figures of the UK. All figures for Japan are of Japan as a country but not of Osaka Prefecture unless stated.
Data source: Ministry of Health, Labour and Welfare (Japan), National Audit Office (UK), OECD data (Japan, UK), Office for National Statistics (UK), Osaka Prefectural Government (Japan) and The World Bank Data (Japan, UK).
1.3.3
Governance of healthcare system and cancer policy
The healthcare in both countries is publicly funded (tax-based in England and social health insurance in Japan); however, provision of care is public-based in England and private-based in Japan with more of self-regulation by providers. The National Health Service (NHS) in England maintains a free-of-charge principle in the public healthcare system; thus, patients have equal access to cancer care in terms of direct costs. On the other hand, irrespective of public or private care, patients in Japan pay co-payment depending on their insurance plans, but it is at a
relatively low cost at 10–30% of their total health expenditure. To save catastrophic payment, a threshold of monthly co-payment is set, depending on age and income. For extremely poor households, a public assistance system exists with exemption from co-payment [45].
In England, cancer care is provided within networks of hospitals, each organised as what are termed Trusts, semi-autonomous organisations within the NHS. While this system enables the care of some rare cancers to be centralised, common cancers such as CRC are managed in most general hospitals, where care is based on the national guidelines and subject to a variety of national regulators that monitor aspects of care such as quality. All hospitals providing cancer
132.9 thousand (England) 1899 (Osaka Prefecture)
Estimated total population (2017) 66.0 million (UK) 126.8 million (Japan)
55.6 million (England) 8.8 million (Osaka Prefecture)
Aged 65 or more (2017) 18.2%* 27.0%
Country of birth different from the country of residence (2017)
14%* 2.0%
Poverty rate ratio 0.111 (2016)* 0.157 (2015)
Life expectancy at birth (years, 2016) 81.0* 84.0
Total health expenditure (% GDP, 2015) 9.9* 10.9
Health spending per capita (US $, 2016) 3833* 4513
Expenditure spent on cancer service (US $) £6.7 billion (US $9.6 billion) (England, 2012–2013)
¥4.2 billion (US $38.3 billion) (2016)
Gini coefficient 0.35 (2016)* 0.34 (2015)
Smoking prevalence (2016) 22.3%* 22.1%
Obesity in adults (measured, 2016) 26.2%* 4.2%
Total alcohol consumption (litters per capita, 2016)
theory, inequities persist [46].
In Japan, the Ministry of Health, Labour and Welfare (MHLW) initiated an accreditation system for what it termed Designated Cancer Hospitals (DCHs) in 2001; however, CRC is also treated in non-DCHs [47]. In 2016, 80% of all CRC cases in Osaka Prefecture were treated in DCHs in Osaka (data not shown). Hospitals are so designated if they fulfil certain requirements,
including the presence of MDTs, sufficient volumes of cancer surgery or chemotherapy, and the employment of specialists in a range of aspects of cancer care. In 2019, there are 392 DCHs in Japan, and Osaka Prefecture had one prefectural and 16 regional DCHs in 2018 [48, 49]. However, even in DCHs, wide variations in surgical volumes and the use of chemotherapy or radiotherapy have been reported [50, 51].
1.3.4
Provider reimbursement and incentives
In both countries, individual doctors, who work in secondary care are paid by salary, whereas doctors working at the primary care level are paid by different systems. Eighty percent of primary care doctors, so-called general practitioners (GPs) in England, are paid mainly by capitation, but also with a combination of fee-for-service (FFS) and pay-for-performance (P4P) [52]. P4P incentives are used in primary care to achieve targeted performances set by the Quality and Outcomes Framework (e.g. immunisation uptake) [52, 53]. Regarding cancer, P4P incentives are used for the uptake of cervical cancer screening [54], but not for the early detection of CRC.
In Japan, historically, there is little distinction between doctors working in primary care and hospitals. Japan does not have physicians that correspond precisely with the GPs in England [55]. The speciality of ‘general internal medicine’ is relatively minor in Japan, and most doctors have another sub-speciality, such as gastroenterology. There are no performance or waiting time targets set for the doctors working at the primary care level; we may call them primary care physicians (PCPs), and they are paid by FFS for the outpatient services. The benefit for cancer diagnosis is that there is no disincentive for doctors to conduct diagnostic tests. Rather, PCPs
Since the function of primary and secondary care duplicates in the general healthcare system in Japan, MHLW promotes distinct role-sharing and coordination in cancer care. For DCHs in Japan, the government provides subsidies for hospitals to achieve requirements for the accreditation. Both clinics and DCHs are incentivised when they provide coordinated cancer care (e.g. referrals from and follow-up at PCPs). An additional fee is set for patients who are treated in these accredited DCHs.
1.3.5
Resources and workforce
While resources are controlled by the government in England, they are not centrally controlled in Japan. England has a higher density of doctors per population; however, the proportion of CRC specialists is assumed to be higher in Japan due to the nature of speciality composition.
Regarding medical technology resources, the total number of CT scans in Japan was by far the highest among all the Organisation for Economic Co-operation and Development (OECD) countries (107 per 1,000,000 inhabitants in Japan, 9 per 1,000,000 inhabitants in the UK in 2014) [56]. In Japan, colonoscopy is widely available at both the primary and secondary healthcare levels [57] (Table 1.2). Geographical variations (by prefectures or medical area) in terms of density of medical resources or number of colonoscopies conducted have not been studied and are not known.
In England, the NHS Cancer Plan (2000) and the NHS Improvement Plan (2004) proposed the increases in equipment procurement [58, 59]. The Plan in 2000 also stated to increase the number of specialists (e.g. gastroenterologists and radiotherapists). A significant increase in the cancer workforce was reported in the Cancer Reform Strategy in 2007 [60]. However, the density in secondary care facilities, such as medical devices and hospital beds, is still much lower than that of Japan and other European countries (MRI with 51.7 per 1,000,000 inhabitants in Japan, 7.2 per 1,000,000 inhabitants in the UK in 2014, hospital beds with 13.1 per 1,000 inhabitants in Japan, 3.6 per 1,000 inhabitants in the UK in 2016) [56, 61, 62] (Table 1.2).
Japan; persistent shortages of doctors occur in rural areas where doctors have no additional monetary incentives.
Table 1.2 Medical resources by England and Japan
Source: ‡ OECD data [56, 61, 62, 69],§ Ministry of Health, Labour and Welfare (Japan) [57]. ǁ Rounded to the nearest 1000. # MDCT (multi-detector CT); ## other CT (single-detector CT. Excluding PET CT). † Derived by dividing the annual figure in the reference by 12 (months).
UK Japan
Number of doctors per 1,000‡ (2016) 2.78 2.43
Number of nurses per 1,000‡ (2016) 7.88 11.34
Hospital beds per 1,000‡ (2017) 2.5 13.1
Length of hospital stay‡
(acute care in days, 2017)
5.9 16.2
Number of hospitals (2017) 1,920 (estimate)‡
7,361 (GP practices in England) [64]
8,412 (hospitals)‡ 101,471(clinics)§
Number of hospitals per 1,000,000‡ (2017) 29.06 (estimate) 66.39
Adult ICU beds per 100,000 (2005) 3.5 [65] 4.3 [65-67]
Number of institutions with colonoscopy
Upper: hospitals (number of beds≥20),
lower: clinics (number of beds<20) (Japan)§
484 [68] 4,091
6,647
Total number of colonoscopies conducted/monthǁ
Upper: hospitals, lower: clinics (Japan)§
119,000 [68]† 258,000
137,000
Number of CT scans per 1,000,000‡ (2014) 9 107
CRC. These symptoms are very common and non-specific, making a decision to provide diagnostic tests for CRC sometimes challenging especially at early stages.
Diagnostic tests used are faecal occult blood testing (FOBT), barium enema and endoscopy (flexible sigmoidoscopy and colonoscopy). National screening programmes for CRC are available in both England and Japan. FOBT, flexible sigmoidoscopy, colonoscopy, computed tomography (CT) colonography and barium enemas are the main tests used for the screening worldwide. The choice of screening tests varies by countries [70], depending on sensitivity, specificity and cost-effectiveness. For symptomatic patients, endoscopy is the initial diagnostic procedure.
In England, biannual Guaiac-based FOBT (gFOBT) was introduced as a population-based screening programme in 2006, i.e. before the study period covered in this thesis in England (2010 to 2013). The screening is performed at approximately 100 local screening centres for the eligible population (age 60–74, from 2010 onwards) [71]. Participants with an abnormal test result are arranged to attend specialist screening practitioner (SPP) clinics for colonoscopy [71]. In 1993, a pilot study commenced using flexible sigmoidoscopy; this procedure was only introduced in 2013 for screening in aged 55, in addition to gFOBT [72], and therefore cannot affect the analysis and results of the present study in England. In 2012–2015, the screening uptake was 57.9% among the target population in England [73, 74].
In Japan, annual iFOBT (immunochemical faecal occult blood test, same as FIT: faecal immunochemical test) has been performed on 40 years old and over (no upper limit for the eligible age), since 1992, i.e. covering the study period in Japan (2012 to 2015) in this thesis. Apart from the population screening, opportunistic screening (iFOBT, barium or flexible sigmoidoscopy) is also offered to applicants. Among the population aged 40 to 69 in Japan, the screening uptake (including opportunistic screening) was 29.8% in 2013 [75].
by imaging (CT scan). Although sensitivity is around 60 to 70% depending on the type of CT [76], lymph node metastasis is also assessed by the routine use of multi-detector CT (MDCT) in Japan [77]. Endorectal ultrasound (ERUS) for early T stage or MRI (magnetic resonance imaging) for intermediate/advanced T stage is used to identify the depth of invasion in rectal cancer, which has a higher local recurrence risk than colon cancer.
Treatment decisions depend mostly on the clinical stage, but age, comorbidities and performance status are also taken into consideration. In Japan, for purely localised tumours (cTis and carcinoma with slight submucosal invasion), endoscopic resection, such as endoscopic mucosal resection (EMR) or endoscopic submucosal dissection (ESD) without node dissection, is the first choice of treatment [78-81].
Tumour resection, by major surgery, is performed with curative intent for CRC clinically diagnosed as T1 (submucosal cancer) and over. In the past, APER (abdominoperineal excision of rectum) with permanent stoma was performed for rectal cancer. Although APER is the only option for rectal cancer which is located very close to the anal canal, as surgical techniques improve, APER became less preferable compared with anterior resection (AR) combined with anastomosis (connection of the intestine by staplers). In emergency or aged cases, Hartmann’s operation is performed; the operation resects cancer without removing the distal rectal stump; thus, it is less invasive.
For stage II (high risk) and III patients, adjuvant (postoperative) chemotherapy is added to the R0 (no residual) resection. Combination chemotherapy of FOLFOX (folinic acid, 5-FU and oxaliplatin) or capecitabine monotherapy are the recommended options in England [82]. In Japan, in addition to these regimens, the use of 5-FU plus folinic acid, UFT (tegafur-uracil) plus folinic acid, capecitabine plus oxaliplatin, or S-1 (tegafur gimeracil oteracil) are covered by insurance; the chemotherapy is recommended to start within four to eight weeks after curative resection, with in principle a duration of six months in Japan [80, 81]. Chemotherapy may also be performed for stage IV patients with unresectable tumour aiming to prolong their survival if
operation could be offered (called ‘conversion therapy’) [83, 84]. Biologic targeted agents (e.g. bevacizumab, panitumumab, cetuximab and regorafenib) have been developed in recent years; however, the indication of the use is only for stage IV patients, depending on individual’s molecular pathological types.
Radiotherapy is performed for either curative or palliative intent. In European countries, neoadjuvant (preoperative) radiotherapy, either chemoradiotherapy (CRT) or short-course preoperative radiotherapy (SCPRT), is recommended for the locally advanced rectal cancer (>cT3b) to reduce recurrence at the local site [85-87]. In Japan, neoadjuvant radiotherapy is rarely used. Instead, aiming an improvement in overall survival and a reduction in local recurrence, lateral lymph node dissection is performed for lower rectal cancer of which the lower margin locates below the peritoneal reflection [78-80]. Pathologically proven T3 (pT3 invading deeper than subserosa or more) or node extension (N positive) are the indications for adjuvant radiotherapy [80]. Although local recurrence is decreased by adjuvant radiotherapy, there is no evidence that this therapy improves survival [88].
Japan. The map identifies steps in the care that might influence survival in each context, from the recognition of symptoms to the end of the initial definitive treatment. Screening was removed from the patient pathway map because, for the study period, it is considered as secondary preventative measure: less than 10% of all CRC cases were detected through screening in England [89], while in Japan, this proportion was likely to be low too because of the relatively small screening uptake [90].
Ten principal events were identified in the care process (in the centre) that are common to the pathways in both countries, starting from consultation with a primary care doctor through the end of the first definitive treatment. Each event is connected by a path, drawn as an arrow A to J in the centre of the figure. The left-hand side of the figure describes those elements and
processes that are specific to England, while the right-hand side describes those specific to Japan. In the following sections, I describe the CRC patient journey from the steps of presentation, diagnosis to treatment.
specialised services (Figure 1.3, box 1). The only exceptions are emergencies, such as intestinal bleeding or obstruction, when patients access the hospital emergency department directly (box 0 to box 11 on the left side). In England, 85% of all-site cancer cases are diagnosed with
symptoms, and 26% of the CRC cases are diagnosed after an emergency admission [7, 89, 91]. The GP will assess the patient’s history and physical signs and, possibly, undertake basic blood tests such as a full blood count. Then the GP decides whether to refer the patient on for further diagnostic tests (e.g. endoscopy) and specialist consultations. Those with suspected cancer should have a consultation of a cancer specialist with a maximum two-week-wait (2WW) from the GP’s referral (‘fast-track’ or urgent referral) if they have certain red flag symptoms or signs (Figure 1.3, path C).
Borderless access and free movement among any medical institutions are the essential characteristics of the healthcare system in Japan [55]. Patients can directly access a specialist either in a clinic at primary care level (Figure 1.3 path A) or most hospitals. The majority of patients use a clinic as the first contact.
Diagnosis
In England, all colonoscopies are conducted at the secondary care level in principle. There is evidence of variations in the use of colonoscopy and flexible sigmoidoscopy across CCGs [46].
In Japan, there is evidence of socioeconomic differences in the utilisation of outpatient services, and delays in obtaining care among older people due to co-payment (barrier at Figure 1.3, path A) [42, 92-94]. However, the horizontal inequity and delays in the elderly population did not differentiate the speciality of healthcare (PCP or specialist service); thus, it is not known
whether those figures influence the rates of emergency presentation (Figure 1.3, box 0 to box 11 on the right side), timeliness of diagnosis, or the place for cancer treatment.
Although co-payment is necessary, patients have access to diagnostic tests including endoscopy performed by gastroenterology specialists at both primary and secondary care levels (box 1 to
Treatment
In England, at the planning phase (Figure 1.3, box 7), NICE (National Institute for Health and Care Excellence) (2004) used to recommend all newly diagnosed CRC patients to be cared by MDT [96, 97].
In Japan, MDT meetings are not necessary for all cases but are usually held only for the patients who are out of indication for treatment recommended in the guidelines. In DCHs, radiotherapy is available at the same institution where surgical treatment is provided. A specialised colorectal surgeon would contact a radiotherapist directly when radiotherapy is needed. For lower rectal cancer in Japan, neoadjuvant radiotherapy is rarely used; the first definitive treatment for most of the advanced cases is surgical resection with lateral lymph node dissection (Figure 1.3, path H) [78-80, 98]. Usually, in contrast to England, the CRC specialist surgeon who operated (box 8b) is fully responsible for the postoperative care (including urgent re-operation), planning of the adjuvant therapy and follow-up (path I and J).
Apart from patients’ health-seeking behaviour or preferences, late-stage presentation, delays in diagnosis or emergency presentation may partly originate from barriers in primary care. Delays in treatment, differences in place of treatment (e.g. reference cancer care centre or non-cancer hospitals, high-volume hospital or low-volume hospital, hospital with specialist or non-specialist) or receipt of treatment may mean barriers in secondary care.
1.3.9
Receipt of treatment as a measure of healthcare access
Over the last decades, various indicators have been developed to assess cancer care. What elements ‘quality of care’ consists of depends firstly on the cancer site. In the specific context of CRC, early detection, accurate diagnosis and staging, prompt and stage-appropriate treatment, management of complications after surgery, regular follow-up by specialist and palliative care may imply good quality of care [5]; however, it does not necessarily mean that all these elements contribute to better survival.
According to Donabedian model, quality indicators can be categorised into three groups: structure, process and outcome measures [99]. Achieving a longer survival is a self-explanatory outcome goal, and receipt of treatment (i.e. process measure), particularly surgical treatment, remains a crucial step to survive for CRC patients. Receipt of surgical treatment can also be a composite measure of accessibility of care, as shown in the patient pathway.
Additional measures have also been suggested for assessing the quality of the provided care or postoperative management [100]. Regarding quality of surgery, one example of quality
indicators is the number of lymph nodes yield [100, 101]. For postoperative management, some indicators incorporate postoperative complications such as anastomotic leakage [102],
reoperation [103], failure to rescue [104, 105] and short-term postoperative mortality [106-108]. Postoperative complications and failure to rescue can be challenging to capture within
My focus here is to gather evidence on the differential access to care by SES and how such inequalities in access to care may influence the survival of CRC. In this thesis, I employ receipt of surgery for the primary lesion as a measure of access to CRC care, and postoperative 30-day mortality as the quality indicator of surgery as well as the short-term outcome measure. Because the detailed information is not available in the population-level database as described above, building indicators to assess the quality of care is beyond the aim of this thesis.
treatment (intermediate outcome) to explain inequalities in survival.
1.4.1
Aims
This study aims to understand the mechanisms by which the socioeconomic inequalities in CRC survival can be explained by patient, tumour and treatment factors.
1.4.2
Objectives
1. To examine whether socioeconomic inequalities in CRC care exist in each country of England and Japan, in recent years (England: 2010–2013, Japan: 2012–2015).
2. To examine whether socioeconomic inequalities in CRC survival exist in each country of England and Japan, in recent years (England: 2010–2013, Japan: 2012–2015). 3. To estimate how much of the socioeconomic inequalities in CRC survival are affected
by socioeconomic inequalities in receipt of treatment.
1.5
Thesis structure
Chapter 2 reviews the literature on inequalities in receipt of treatment in UHC countries. Chapter 3 explains the data materials used in Chapters 4 and 5, and the methodology used in Chapter 4.5.
Chapter 4 and Chapter 5 explore the socioeconomic inequalities in CRC care and survival in England and Osaka, Japan.
2.1
Inequalities in receipt of treatment in UHC countries
2.1.1
Introduction and methods
This literature review aims to explore evidence on the socioeconomic inequalities in access or utilisation of CRC care, especially focusing on the receipt of treatment in UHC countries.
Socioeconomic inequalities in cancer survival can be caused by patient, tumour (stage) or healthcare system factors [111]. Reports have suggested evidence for socioeconomic inequalities in survival in countries with UHC [3, 112, 113]; however, how cancer care is accessed or utilised by different SES groups, the consequences of the differential treatment in relation to the survival inequalities, are poorly understood. As described in Chapter 1.2.1, in theory, in countries with UHC, equity of access to the acceptable quality of care should be ensured. Therefore, differential cancer care should not be observed by SES.
OECD high-income countries with public health coverage were defined as UHC countries and included in the review [114, 115]; therefore, the United States, where private health coverage has been dominant (54%), was excluded from this review.
In this thesis, I defined that cancer care refers to diagnosis and treatment but not the first and second prevention measures such as screening. Of the cancer care defined and the potential care measures identified in Figure 1.3, I further confined this review to the receipt of treatment (surgery, chemotherapy or radiotherapy) or type of treatment to explore evidence on the socioeconomic inequalities in access or utilisation of cancer care at the secondary care level. Measures of treatment receipt that do not necessarily affect survival (e.g. receipt of palliative care, stoma reversal, use of outpatient service or length of hospitalisation) were excluded.
‘Socioeconomic status’ contains complex concepts; for this review, I defined disadvantaged groups as those with low incomes, in low occupation classes, or categorised as deprived groups defined by a multiple index. Reports defining disparities by age, sex, ethnicity, race, educational years, marital status, insurance status, geographical distance or rurality were therefore excluded.
and Web of Science. Research papers, which were identified in the references of the original articles reviewed, were also manually assessed and added. Reports published in the 1990s or earlier were excluded as CRC treatment had changed dramatically since the 1990s. Non-English documents, non-Japanese documents, conference abstracts, review papers (e.g. literature review and meta-analysis), letters and qualitative reports were also excluded. Search strategies
comprised the follows and are further detailed in Table 2.1.
The aim of this review is to assess differential receipt of treatment; therefore, regarding socioeconomic variations in mode of presentation and outcomes (both postoperative mortality and survival from diagnosis), the articles that do not report disparities in treatment receipt, were excluded from this review, even if variations in presentation or mortality/survival are used as final outcomes.
1. (bowel OR colon* OR rectum or rectal OR colorectal) AND (adenocarcinoma OR cancer) (as title)
2. socioeconomic OR socio-economic OR deprivation OR income (as keyword) 3. inequalit* OR inequit* OR differen* OR variation OR disparit* (as title) 4. inequalit* OR inequit* OR disparit* (as keyword)
5. treatment OR management OR care OR operation OR surgery OR resection OR specialty OR specialist OR time OR delay OR therapy OR chemotherapy OR radiotherapy OR chemoradiotherapy (as keyword)
OR cancer[Title])) AND ((inequalit*[Title] OR inequit*[Title] OR differen*[Title] OR variation[Title] OR disparit*[Title]) OR (inequalit*[Abstract] OR inequit*[Abstract] OR
disparit*[Abstract])) AND (socioeconomic OR socio-economic OR deprivation OR income) AND (treatment OR management OR care OR operation OR surgery OR resection OR specialty OR specialist OR time OR delay OR therapy OR chemotherapy OR radiotherapy OR chemoradiotherapy)
Ovid system Embase Global Health Econlit
Social Policy and Practice
1 (bowel or colon* or rectum or rectal or colorectal).m_titl. 2 (adenocarcinoma or cancer).m_titl.
3 1 and 2
4 (socioeconomic or socio-economic or deprivation or
income).mp. [mp=ab, ti, ot, bt, hw, id, cc, tx, ct, sh, tn, dm, mf, dv, kw, fx, dq, nm, kf, ox, px, rx, an, ui, sy, pt]
5 (inequalit* or inequit* or differen* or variation or disparit*).m_titl.
6 (inequalit* or inequit* or disparit*).mp. [mp=ab, ti, ot, bt, hw, id, cc, tx, ct, sh, tn, dm, mf, dv, kw, fx, dq, nm, kf, ox, px, rx, an, ui, sy, pt]
7 (treatment or management or care or operation or surgery or resection or specialty or specialist or time or delay or therapy or chemotherapy or radiotherapy or chemoradiotherapy).mp. [mp=ab, ti, ot, bt, hw, id, cc, tx, ct, sh, tn, dm, mf, dv, kw, fx, dq, nm, kf, ox, px, rx, an, ui, sy, pt]
8 5 or 6
9 3 and 4 and 8 and 7
10 limit 9 to yr="2000 -Current" 11 remove duplicates from 10
12 (America* or United States or USA).m_titl. 13 11 not 12
Web of Science #1 TI=(bowel OR colon* OR rectum OR rectal OR colorectal) AND TI=(adenocarcinoma OR cancer)
#2 ALL=(inequalit* OR inequit* OR disparit*)
#3 TI=(inequalit* OR inequit* OR differen* OR variation OR disparit*)
#4 ALL=(socioeconomic OR socio-economic OR deprivation OR income)
#5 ALL=(treatment OR management OR care OR operation OR surgery OR resection OR specialty OR specialist OR time OR delay OR therapy OR chemotherapy OR radiotherapy OR chemoradiotherapy)
main components: for cohort studies, (i) selection, (ii) comparability of cohorts and (iii) assessment of outcome: for case-control studies, (i) selection, (ii) comparability of cases and controls and (iii) ascertainment of exposure. Each outcome in a study was assessed and allotted a star if the study design or description fulfils a requirement in each of the nine questions. The maximum total a study can obtain is nine stars. Regarding the comparability, I assigned one star if a study outcome is derived controlling for stage. I also allotted an additional star if a study outcome is derived controlling for comorbidities or ASA (American Society of
Anesthesiologists)grade.
The aim of this literature review is to summarise the available evidence on socioeconomic inequalities in access to cancer care for my analyses in the later chapters, but not to develop or assess quality indicators for cancer care. As the definitions and measurement of outcomes vary among studies, the outcomes were not pooled and this review is thus descriptive.
Table 2.2 Newcastle-Ottawa Scale for cohort or case-control studies
Cohort studies Selection (4 stars)
1. Representativeness of cohort members: truly or somewhat representative of the community
2. Selection of non-exposed cohort members: coming from the same community as the exposed members
3. Ascertainment of exposure: secure record (e.g. surgical records) or structured interview
4. Demonstration that outcome was not known at the start of study: yes or no
Comparability (2 stars)
1. a) Outcome controlled for stage
b) Outcome controlled for comorbidities or ASA grade
Outcome (3 stars)
1. Assessment of outcome: independent blind assessment or record linkage 2. Adequate length of follow-up for observing outcome to occur: yes or no 3. Adequacy of follow-up: complete follow-up or small proportion of lost to
follow-up (less than 30%) or description of the lost to follow-up
Total 9 stars Case-control studies Selection
(4 stars)
1. Adequacy of case definition: yes (ICD codes, record linkage, self-reports) or no (no description)
2. Representativeness of cases: obviously representative 3. Selection of controls: community controls
4. Definition of controls: no history of endpoint/disease
Comparability (2 stars)
1. a) Outcome controlled for stage
b) Outcome controlled for comorbidities or ASA grade
Exposure (3 stars)
1. Ascertainment of exposure: secure record or structured interview (blind to case or control status)
2. Same method of ascertainment for case and control: yes or no 3. Non-response rate: same rate for both groups
and Practice) and Web of Science identified 922 and 477 articles, respectively. After removing duplications and irrelevant studies by screening titles and abstracts, 101 full-text articles were assessed for the eligibility. From the initially identified articles, further 28 articles were deemed as relevant (Figure 2.1).
A total of 60 articles from seven UHC countries were identified as having descriptions on socioeconomic variations in receipt of treatment. The UK reported the most, followed by France. From other European countries, the Netherlands and Sweden reported some socioeconomic variations in cancer care. From Asia, one article from Korea reported
socioeconomic variations. There was no article reporting disparities in receipt of treatment from Japan.
of any treatment, receipt of surgical treatment, type of surgical treatment, receipt of
chemotherapy and receipt of radiotherapy. The identified studies are listed by group in Table 2.3.
Of the 60 studies, nine studies had reported socioeconomic differences in mode of presentations, and 26 had assessed the postoperative mortality or long-term survival, in addition to the report of differential receipt of treatment. Eight studies assessed differences in places of treatment (e.g. referral cancer care centres or not, high-volume or low-volume hospitals). Fifteen studies reported time to treatment by SES. Six studies reported on receipt of any treatment, 14 on receipt of surgery, 18 on type of surgery, 20 on receipt of chemotherapy, and ten on receipt of radiotherapy.
Treatment and survival can be determined by stage, comorbidities, urgency of presentation or operation and speciality/volume of surgeon or hospital [111, 117]. Thus, I extracted information on whether an analysis was adjusted for those factors. For all outcomes, important factors, which were adjusted in each multivariable model, are shown in italics after adjusted odds ratios (ORs) or hazard ratios (HRs).
Results of the quality assessment of the studies by NOS for cohort or case-control studies are shown in Table 2.14.
disparities in mode of presentations (Table 2.4). In most studies, the unadjusted odds of emergency presentation were higher in the most deprived group than the least deprived group. Because mode of presentation was not the final outcome in the reviewed studies, all studies except two [118, 119] did not control for stage and comorbidities (Table 2.4 and Table 2.14). For these two studies, the adjusted odds of emergency presentation did not differ by SES. The definition of emergency presentation varied also by country. All three studies, which reported urgency of treatment, was from England, comparing elective versus emergency surgery [120-122]. The OR of receiving emergency treatment in the most deprived group varied between 1.15 and 1.30 in these three studies.
Place and time to treatment
In the eight studies on place of treatment, the OR of the most deprived group being treated in a reference cancer care centre or a high-volume hospital ranged from 0.32 to 1.22 (Table 2.5). Regarding the time to treatment, although there were 15 studies, there was mixed evidence for deprived groups with longer time to treatment. Not only the definitions for starting dates, but outcomes varied among the studies (Table 2.6).
Regarding the quality of the studies, studies reporting place of treatment pointed generally higher than seven stars in NOS. On the contrary, two studies on time to treatment [123, 124] were poor in the description of selection of the study population (Table 2.14).
Receipt of any treatment, surgery and type of surgery
Of the six studies on the receipt of any treatment, two studies from England [125, 126] found that deprived groups were less likely to receive treatment than the least deprived group (Table 2.7). In other studies, socioeconomic trends favouring affluent patients were less clear.
Receipt of surgery was reported to be generally low in deprived patients. The OR of receiving surgery in the most deprived group varied between 0.52 and 1.13 (Table 2.8). In most studies
Four studies assessed socioeconomic variation in receipt of liver resection for stage IV CRC. Three studies specified liver-limited metastasis to synchronous cancer [128-130], whereas one [131] did not.
Of the 18 studies on the type of surgery, there were two studies on curative vs palliative surgery, one on total vs partial pelvic exenteration, nine on non-restorative surgery, two on laparoscopic surgery, six on the number of lymph node yields and two on the speciality of a surgeon (Table 2.9). Generally, deprived patients were likely to receive non-restorative surgery, such as APER, rather than restorative surgery such as AR. Laparoscopic surgery was also less received by the deprived group. Lymph node yield 12 or more was relatively equally achieved among different SES groups. Access to a specialised surgeon was also consistent among the SES groups.
Almost all studies scored eight or nine stars in quality assessment by NOS regarding receipt of surgery. When type of surgery was the outcome, some studies scored seven or lower stars because not controlling for stage or comorbidities (Table 2.14).
Receipt of chemotherapy
Of the 20 studies, four studies specified the study population to patients with stage IV [125, 132-134] (Table 2.10). Other studies, except for one [135], specified the use to adjuvant therapy or controlled stage information. One study evaluated access to KRAS testing [132]. Access to adjuvant chemotherapy was generally low for the deprived groups; the OR of receiving chemotherapy in the most deprived group ranged from 0.31 to 0.99.
Regarding the quality of the studies, most studies scored seven or higher stars in NOS; however, some studies were unclear in terms of follow-up period to observe receipt of chemotherapy (Table 2.14, no star for the question Outcome 2. for cohort studies).
cancer patients (Table 2.11). The OR in receiving radiotherapy varied between 0.62 and 1.39. One study from Sweden reported strong evidence for socioeconomic inequalities in the use of radiotherapy, even stratified by several factors [136]. All studies scored seven or higher stars in NOS (Table 2.14).
Postoperative mortality and long-term survival
Table 2.12 represents those studies which reported postoperative mortality or survival. Table 2.13 shows survival reports of which the entry is the diagnosis. Nine studies measured postoperative short-term mortality (Table 2.12). Eight studies extended the analysis to overall (i.e. all-cause) survival, of which the end point was more than one year from the entry. Three studies [137-139] assessed cancer-specific survival, one [140] assessed relative survival, and two [120, 141] assessed net survival. Most studies adjusted disease stage or showed results by stratified stage. ASA grades were adjusted in two studies [120, 122]. Comorbidities were adjusted in four studies [138, 139, 142, 143], and the urgency of presentation or surgery
(emergency or elective) were adjusted in six studies [120, 122, 137, 141-143]. In all studies, the odds of postoperative short-term death in the most deprived group exceeded one.
Eleven studies measured long-term survival since diagnosis (Table 2.13). Even after adjusting for the effects of stage and treatment factors, the hazard of death in the most deprived group was generally higher than that of the least deprived group; the HR ranged between 0.83 and 1.54.
![Figure 1.2 Association between socioeconomic status, access to cancer care and survival Modification from source: Alberto, 2013 [20]](https://thumb-us.123doks.com/thumbv2/123dok_us/9907742.2483973/22.892.173.792.533.780/figure-association-socioeconomic-status-access-survival-modification-alberto.webp)