WORKING PAPERS Publio Eoonomic
Country Economics Department The World Bank
October 1988 WPS 125
The Effects
of Financial Liberalization
on Thailand, Indonesia,
and the Philippines
A
Quantitative Evaluation
Christophe Chamley
and
Qaizar Husain
Removal of financial regulations was successful and had a
powerful impact on the level of financial assests in Thailand and
Indonesia but failed in the Philippines because taxes imposed on
financial institutions interacted with high inflation rates.
The PLcy. Manning, and Reseach Cmplez distributes PPR Woiking Papers to dissnate the finding of work in progess and to encourage the exchange of idea among Bank taff and ll other interested in development issues. These papers cay te nanem of ihe authas, reflect only thdr views, and should be used and cited accordingly. The findings, intptaatioun, nd conchisions are the authoe own.They should not beattributed tothe World Bank, its Board of Direto, itsmarageanent, or nyof its meanbercountries.
Public Disclosure Authorized
Public Disclosure Authorized
Public Disclosure Authorized
Plc,Planning, and Reaearch Pubic¢ 'aconomlc*
In the early 1980s, interest rate ceilirngs and removed. Similar reform failed in the
Philip-other regulations affecting financial assets were pines, where taxes on the financial sector
lifted in Thailand, Indonesia, and the Philip- interacted with high rates of inflation.
pines.
As the quantitative evaluation in this paper
Did financial liberalization work equaly shows, the efficiency gains in Thailand and
well in all thiee countries? The topic is impor- Indonesia were small compared with GDP but
tant because the heavy burden many countries large compared with the levels of transfers
put on tinancial institutions falls mainly on the (explicit or implicit) induced by policies of
holders of financial assets. regulation.
The answer is that liberalization of interest The chief lesson to be drawn from these
rates significantly increased the real return on experiences - particularly in the
Philippines-financial assets in Thailand and Indonesia, is that reallocating resources by manipulating
because all interest and credit constraints were the financial system may be less efficient than
other fiscal policies.
This paper is a product of the Public Economics Division, Country Economics De-partment. Copies are available free from the World Bank, 1818 H Street NW, Washington DC 20433. Please contactAnn Bhalla, room N10-077, extension 60359.
The PPR Working Paper Series disseminatis the findings of work under way in the Bank's Policy, Planning, and Research Complex. An objective of the series is to get these findings out quickly, even if presentations are less than fully polished. The ftmnings, interpretations, and conclusions in these papers do not necessarily represent official policy of the Bank.
THE REMOVAL OF INTEREST CEILINGS AND OTHER REGULATIONS ON FINANCIAL ASSETS IN THAILAND. INDONESIA AND THE PHILIPPINES:
A QUANTITATIVE EVALUATION
I. INTRODUCTION AND SUMMARY ... 1
Summary ... 3
II. THAILAND ... 5
A. Interest Rates Policy before 1980. 6
B. The Openness of the Financial System. 8
C. The Interest Rate Liberalization of 1980 .13
D. The Impact of the Reform .13
III. INDONESIA .. 17
A. The Regime Before June 1983 .18
The Policy Context .18
Financial Institutions and Policy ... 18 Interest Rates: A Two-Sector Banking System .20
Rediscounting by the Central Bank ... 21
B. The Open Economy .22 C. The 1983 Reform .22
The Context: Pressures of the International Markets .22
Policy Measures ... 27
D. The Impact of the Reform ... 27
IV. PHILIPPINES ... , . ... 3030.,
A. The Openness of Capital Markets ... ,,.,,,,,.31
B. Explicit and Implicit Taxes on Banks ... 36
Explicit Taxes ...,,.,,,,,,,,. 36 Implicit Taxes ...,,,.,,,.,.,,... 36
The Interaction of Inflation and Taxes on Financial
Institutions ... ,,,,,,,,,.,... 37
C. The Impact of Interest Rates on Deposits ... 39
V. THE EFFICIENCY GAINS OF INTEREST LIBERALIZATION ... ,,. 39
VI. CONCLUSIONS ... 47
REFERENCES ...,,,,.,... 48
We are grateful to Javad Khalilzadeh-Shirazi for discussions and support and to Ajay Chhibber for particularly useful comments.
I. INTRODUCTION AND SUMNARY
The taxation of financial assets is determined by a numoer of policy instruments which can be divided into two groups that belong to the tax code and to other financial policies, respectively.
This paper will deal mostly with the second set of policies. The list of these instruments includes reserve requirements, rules for the investments of financial institutions, ceilings on borrowing and lending
rates, and credit ceilings. They have been used either when the tax administration or standard taxes have been inadequate for raising the desired revenue (an example is seignorage), or when policymakers have preferred to affect the allocation of resources through nontax instruments
(such as interest ceilings or credit targets). It is noteworthy that nontax financial policies may have an impact on the real rate of return of
financial assets tha;. dwarfs that of the standard tax instruments. For example, a direct tax on interest income has an effective rate smaller than
one hundred percent in an economy with no inflation. But the combination of an inflation policy with ceilings on interest rates can easily lower the
net raal rate to negative values.
In developing economies, the bulk of financial assets consists of
bank deposits. This institutional setting is explained by the embryonic
nature of the capital markets and other financial institutions. Indeed,
the role of banks ir. the mobilization of resources has been emphasized by
several authors in the seventies (Shaw [197J], McKinnon [1973]), and has been mentioned previously for other countries such as Germany in the nineteenth century. These authors have stressed that the removal of taxation of financial assets would generate a large expansion of the
financial sector, a higher rate of saving and of output growth. The
removal of the so-called "financial repression" has even been called the
'linchpin" theory of economic development.
One of the most commonly observed forms of implicit taxes that
falls on financial assets is the implementation of interest ceilings for
loans made by financial institutions. The purpose of this tax is to lower
the borrowing cost for borrowers (private or public). In most cases it has
a direct impact on the real rate of return of financial assets. Indeed
some financial institutions may be able to circumvent the ceilings or loans
with fees and compensating balances. But in doing so they merely
appropriate some of the rents generated by the rationing of funds. They
are rarely in a position to pass on this rent to the depositors who have to
be content with the regulated loan rate minus a "fair" margin for banking
costs. This paper will concentrate mainly on the removal of interest
ceilings (and some other regulations) that occurred in the early eighties,
in a group of three countries in South East Asia, Thailand, Indonesia and
the Philippines. It has two motivations. First, the liberalization of
interest rates has led to significant increases of the real return of
financial assets and may provide interesting policy lessons. Second, the
topic is important because a number of countries are maintaining a heavy
tax burden on financial institutions that falls to a large extent on the
holders of financial assets.
We have chosen three countries in Southeast Asia because their
similarities enable an observer to make meaningful comparisons and their
differences provide some variety in the policy experiments. These
countries belong to a common area, they are fairly open to the same foreign
capital markets, they may even share some cultural features, and they have
3
-also offer a variety of institutional settings, natural resources and
macro-economic policies.
The liberalization of the financial sector in these countries has
already been described in other studies (Ilang-Sheng Chen, ed., [1984]).
However, a new evaluation is useful at this stage because there has been
more time to acquire a better perspective and more information.
Furthermore, this paper will put a special emphasis on a comparative
approach for the three countries.
-Summarv
The main lessons for policy are the following:
1. Because of the openness of all the three economies, the
domestic interest rates are affected by foreign rates.
The rise of the international rates in the early
eighties was a decisive factor in the breakdown of long
standing interest ceilings in all three countries.
2. The removal of interest ceilings and other regulations
on credit has led to a spectacular growth of deposits in
Thailand and Indonesia. In the Philippines a
significant relation between the real rate of deposit
and the M2 to GDP ratios was found. However, the
positive effect of intsrest liberalization was offset by
the interaction of inflation and taxes on financial
institutions and the N2 to GDP ratio did not change
after the liberalization of interest rates.
3. The growth of M2 was much higher than that of income in
Thailand and Indonesia, but it did not result in higher
inflation. The large response of financial assets to
degree of substitutability with other assets. These
other assets are presumably traded in informal or foreign markets. The lack of available data on informal
markets has precluded an examination of the effect of
interest liberalization in this market. Its importance
is nevertheless well established (the Bank of Thailand
estimates its size to be of the same order of magnitude as that of the formal market). The high
substitutability with foreign markets is documented here
t&rough a comparison of the domestic and foreign rates
of return.
4. The large response of deposits to the net real rate of
return shows that the intra-temporal efficiency cost of
the taxation of financial assets is large in economies
that have opportunities for substitution with foreign or
informal capital markets. We found that this cost is
low as a fraction of GDP but high in terms of revenues
(explicit or implicit). It was probably greater tharn 40
and 100 percent of revenues in Thailand and Indonesia,
respectively. These numbers are much larger than the commonly accepted values of the efficiency cost of the
labor tax.
~.5.
The high degree of substitutability between financial assets and other assets implies that the increase of deposit real rates had a minimal impact on the overall rate of return of savings. This eviderce is therefore in agreement with the results of other studies thatfound no relation between the rates of return on deposits and the saving rate (Giovanini, [1983],
- 5
-empirical work that was done as a background to the present paper. They were omitted because a complete analysis that takes into account country specific factors would require another study.
6. The large financi' deepening (as measured by the increase of the M2 of GDP ratio), occurred in a period
of lower growth for Thailand and Indonesia. A proper test of the "linchpin" theory of development is beyond
the scope of the paper, but the current evident does not
support this theory.
The paper is organized as follows. Each of the next three sections is devoted to one of the three countries with a special emphasis on the main policy issues. In the last section we turn to a more general analysis of the intratemporal efficiency cost of the taxation of financial
assets which draws on the empirical evidence of the previous sections.
11. THAIILAND
Before 1980, the government of Thailand had conducted an active
policy on interest rates and credit targets that had a significant impact
on the implicit taxation of the system and that induced a substitution of
financial assets towards the informal and foreign markets. This policy was
motivated by a long tradition of low interest rates and usury laws rather
than by the need to lower the cost of domestic public borrowing
Two lessons can be drawn from the experience of Thailand:
(i) The competition of foreign markets severely restricts the capacity of the government to regulate interest rates (and indirectly tax the domestic system of financial intermediation), and
(ii) The raising of interest ceilings has a powerful effect
on the expansion of the financial system.
The arguments are developed in this section in the following sequence. First, we describe briefly the policy before 1980. Second, we
provide empirical evidence of the linkage between domestic and foreign capital markets. Third, we show how the raising of international rates led
to the removal of interest ceilings. Fourth, we analyze quantitatively the
impact of interest rates on the level of bank deposits which represent the
bulk of financial assets in the domestic formal sector.
A. Interest Rates PolicE before 1980
Ceilings on interest rates came from a long tradition in Thailand.
Since the government did not use inflationary finance, prices have been by
and large stable and real rates have been positive. The ceilings on interest rates have at times contributed to a lower cost of the public
debt, but the amount of this subsidy has remained relatively modest. Table
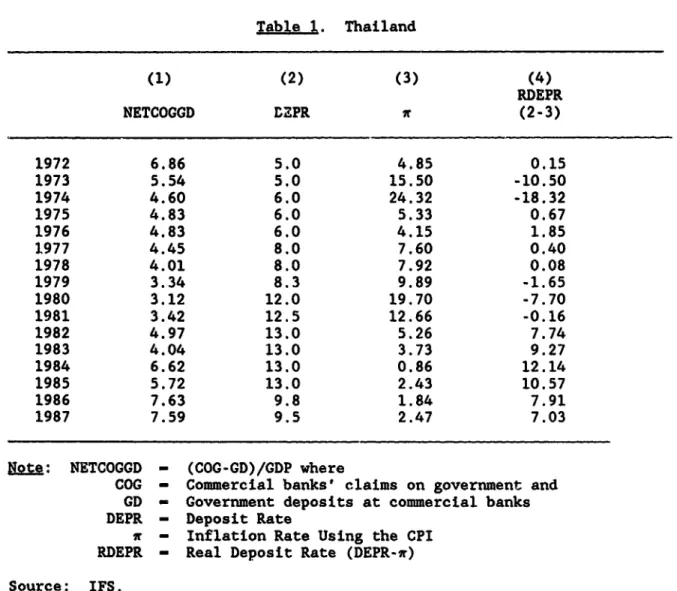
1 presents the ratios between net government borrowings from commercial banks and GDP, the nominal interest rates on deposits and the real rate.
The system of rigid rates experienced its first jolt in 1973-1974 with the
inflationary shock that was due to the first oil crisis. Real interest rates became negative and the money (M2) to GDP ratio began to decline. This period did not last long, and real interest rates regained a positive
level after prices were stabilized in 1975.
The second oil shock and the U.S. policy of high interest rates brought the system to an end. The ceilings on interest rates were not
compatible with a regime of open capital markets, stable exchange rates in
an environment which provided ample opportunities for substitution with
markets in neighbor countries (Singapore, Hong Kong, which are linked to
other markets). We now turn to a quantitative analysis of the competition
Table 1. Thailand (1) (2) (3) (4) RDEPR NETCOGGD LEPR (2-3) 1972 6.86 5.0 4.85 0.15 1973 5.54 5.0 15.50 -10.50 1974 4.60 6.0 24.32 -18.32 1975 4.83 6.0 5.33 0.67 1976 4.83 6.0 4.15 1.85 1977 4.45 8.0 7.60 0.40 1978 4.01 8.0 7.92 0.08 1979 3.34 8.3 9.89 -1.65 1980 3.12 12.0 19.70 -7.70 1981 3.42 12.5 12.66 -0.16 1982 4.97 13.0 5.26 7.74 1983 4.04 13.0 3.73 9.27 1984 6.62 13.0 0.86 12.14 1985 5.72 13.0 2.43 10.57 1986 7.63 9.8 1.84 7.91 1987 7.59 9.5 2.47 7.03
Note: NETCOGGD - (COG-GD)/GDP where
COG - Commercial banks' claims on government and GD - Government deposits at commercial banks DEPR - Deposit Rate
i - Inflation Rate Using the CPI RDEPR - Real Deposit Rate (DEPR-ir)
B. The Openneas of the Financial System
The formal financial system faces two competitors. The first is
the domestic informal market that is well developed. Its size is
notoriously difficult to estimate, but some authors think that it almost
matches the size of bank deposits (Vorgpradhip, [1986]). The interest
rates observed in this market are higher than in the formal market. This
differential was probably due both to the higher risks and to the rationing
in the formal market.
The other competitor for banks is the foreign market. . . the
sixties, the exchange policy of Thailand has been a stable exchange rate
and an open capital account. This regime and the proximity of active
financial centers such as Singapore or Hong Kong, which act also as
intermediaries with world capital markets, generates an environment that is
suitable for a high degree of substitutability between domestic fin&ncial
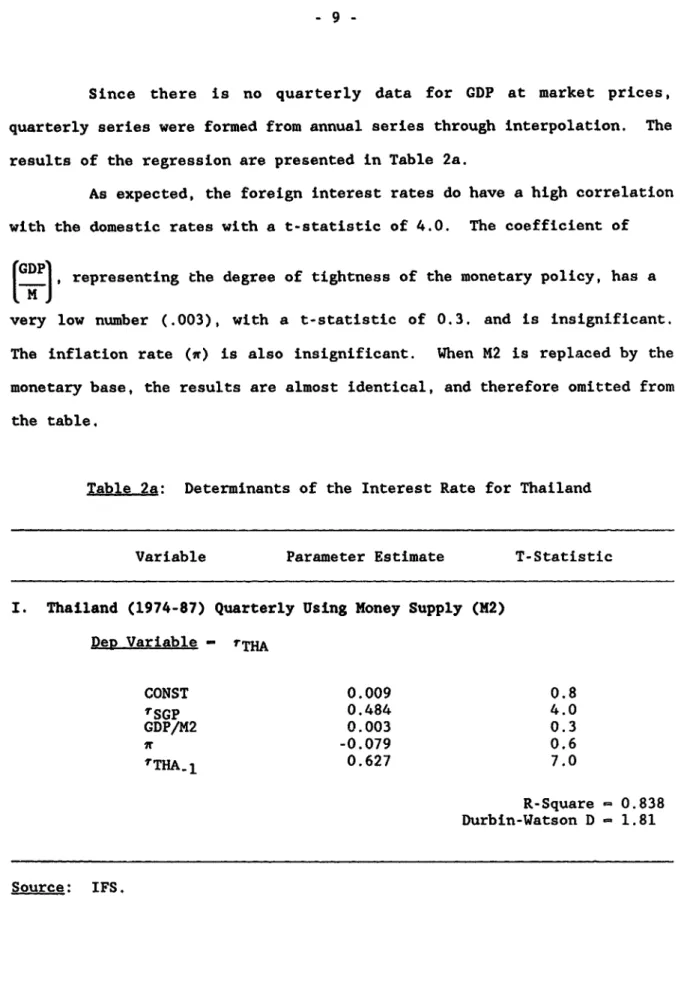
assets and foreign assets. In order to test the hypothesis that the
domestic rates are influenced by foreign rates, Thailand's quarterly money
market rate was regressed on Singapore's money market rate and other
independent variables. The time period used is 1974-1987 and the equation
is of the form:
rTHA - CONST + plTSGP + 2[GDPI + P3 ' +
P4
(rTHA)_1 9where rTHA is the money market rate for Thailand,
rSGp is the money market rate for Singapore,
GDP is the ratio of nominal GDP to Ml in logarithms,
M
r is the inflation rate for Thailand,
9
-Since there is no quarterly data for GDP at market prices,
quarterly series were formed from annual series through interpolation. The
results of the regression are presented in Table 2a.
As expected, the foreign interest rates do have a high correlation
with the domestic rates with a t-statistic of 4.0. The coefficient of
[GDP) representing the degree of tightness of the monetary policy, has a
very low number (.003), with a t-statistic of 0.3. and is insignificant.
The inflation rate (Xt) is also insignificant. When M2 is replaced by the monetary base, the results are almost identical, and therefore omitted from
the table.
Table 2a: Determinants of the Interest Rate for Thailand
Variable Parameter Estimate T-Statistic
I. Thailand (1974-87) Quarterly Using Money Supply (M2)
DeR Variable - rTHA
CONST 0.009 0.8 rSGP 0.484 4.0 GDP/M2 0.003 0.3 iX -0.079 0.6 rFTHA_1 0.627 7.0 R-Square - 0.838 Durbin-Watson D - 1.81 Source: IFS.
The estimation equation does not include the rate of change of the
exchange rate because the exchange rate was stable except for in two
devaluations that occurred (by 11.5 percent) in 1981 and (by 18.0 percent)
in 1984. The determination of a proxy for the expected rate of devaluation
when devaluations are discrete, is a delicate issue. We have preferred to
assume that this expectation is represented by a Poisson process and that
it is contained in the constant term of the equation. This procedure is
not very satisfactory and may be improved in subsequent work.
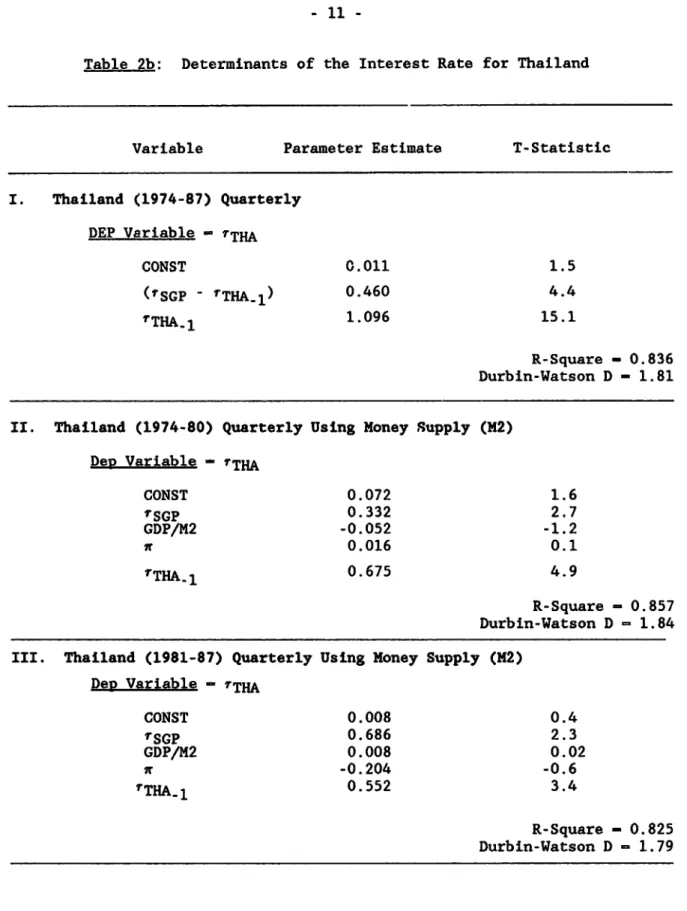
The equation was reestimated without the significant variables and
under the form:
rTHA - CONST + xl rSGp + (1 - xl + P)(rTHA)_
The results (line I of Table 2b) show that the coefficient 6 is not significantly different from zero and that an increase of the Singapore
rate by one point implies an equal increase of the Thai rate, in the
long-run.
Since a visual comparison of the rates in Thailand and in the
euro-dollar markets may indicate a exchange of regime after 1980 (see also
Figure 1), the equation was estimated separately for the two subperiods
(74-80) and (81-87). The results in line II and ITI of Table 2b show that
there is no econometric evidence for such a shift. A Chow test did not
infirm the stability of the estimated coefficients.
Another indication of the close relation between domestic and
foreign rates of interest is given by the Figure 1 which represents the
money market rates in Thailand and Singapore. From the previous regression
we expect to observe a close relation between the two rates, but the
diagram shows also that the domestic rate is never smaller than the foreign
- 11
-Table 2b: Determinants of the Interest Rate for Thailand
Variable Parameter Estimate T-Statistic
I. Thailand (1974-87) Quarterly
DEP Variable - TTHA
CONST 0.011 1.5 (TSGP - TTHA-1) 0.460 4.4 T THA-1 1.096 15.1 R-Square - 0.836 Durbin-Watson D - 1.81
II. Thailand (1974-80) Quarterly Using Money Supply (M2)
DeR Variable - TTHA
CONST 0.072 1.6 TSGP 0.332 2.7 GDP/M2 -0.052 -1.2 0.016 0.1 0.675 4.9 R-Square - 0.857 Durbin-Watson D 1.84
III. Thailand (1981-87) Quarterly Using Money Supply (M2)
DeR Variable - rTHAL
CONST 0.008 0.4 7SGP 0.686 2.3 GDP/M2 0.008 0.02 X -0.204 -0.6 T THA-1 0.552 3.4 R-Square - 0.825 Durbin-Watson D 1.79
Figure 1. Money Market Rates and Three-Month Euro-Dollar Rates
If
iS.0~~~~~~~~~~~~~~~~~~. Ia
.'
;NZ (z~ II : 12.: M m rteER = Eurodollc9 1r80 1981 1982 198a i 18e
MR" Monev muarket race ER Eurodollar rate
- 13
-to speculative attacks on the baht). Foreign rates provide a floor on
domestic rates: if the domestic rate is lower than foreign rates, then
capital moves abroad.
C. The Interest Rate Liberalization of 19 ')
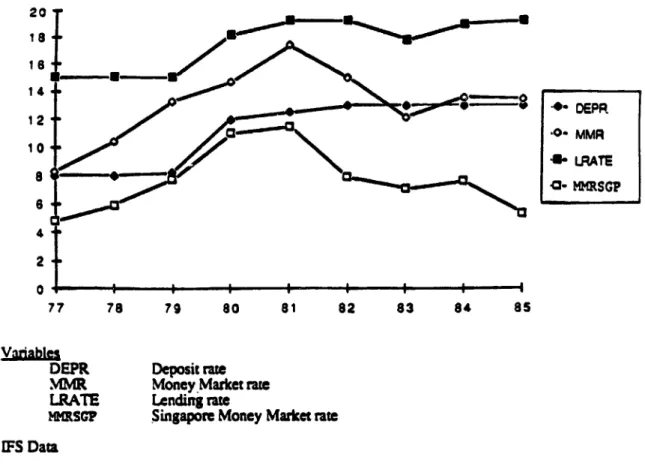
The liberalization of interest rates in Thailand was forced by the
increase of international rates in 1980 and the policy of open capital
markets with a stable currency. The sequence of events is illustrated in
Figure 2. Until 1979, the lending and the deposit rates (represented by
the schedules LRATE and DEPR in the figure) were constant. The money
market rate in Thailand (MHR) evolved in the interval between these two
rates. It increased gradually in the late seventies under the pressure of
the international rates (represented by the money market rate in Singapore,
MMRSGP). In 1980, the continuation of fixed rates for loans and deposits
became infeasible and the values of the ceilings were raised.
D. The Impact of the Reform
The impact of the interest liberalization was impressive, as can
be seen in Figure 3. The quantity of money M2 increased at the average
annual rate of 18 percent between 1980 and 1986. This large increase
occurred with no effect on the price level; during the same period the
average inflation rate was equal to 4 percent.
The response of deposits to the rate of return is supported by
estimations of the demand for money (M2). Various specifications are
presented in Table 3. All the coefficients have the right sign and the
opportunity cost of money is significant and negative. The sum of the
coefficients of the deposit rate, the inflation rate, and the money market
rate is zero, which is as it should be: the demand for money depends on
the differences between the return of money and the returns of other
Figure 2. Interest Rate in Thailand Around the Time of the Reform
20-12 i_ DEP I8 4 2-'M Moncy0Market mmt
LRATE Lending rate
;-RSGP Singapore Money Marcet rate
Figure 3. The Expansion of Bank Deposits in Thailand 0.7 . 0.6 -0.5
[ j
0.4 Z-_- 0 o K-MIZ 0. 3 VW* M2Z 1 *-~~~~~~~~~~~~~~~~~~~~~~INF
0.2*o.1 9-0-t
-2-3-4-5-B-7-6-9-0-1-2-3-4-5-6-7
MIZ %II/GDP
.M'2Z M2GD;INF lnflaton rate (CPl)
Table 3. Results of Money Demand Equations for Thailand
I. Dependent
Variable Constant LM2Z(-l) MMR DEPR irDEF
DIFLM2Z -0.05 -0.131 -0.338 0.799 -0.413
(1974-86) (2.8) (3.8) (3.4) (6.1) (10.8)
R2 0.945
DW - 2.48
II. Dependent
Variable Constant LMlZ(-l) DEPR wDEF
DIFLM1Z -0.30 -0.312 -0.730 -0.108
(1972-87) (2.7) (2.9) (3.2) (1.3)
R- - 0.710 DW - 1.35
Note: LM2Z - log (M2/GDP)
DEPR - Deposit Rate
LMIZ - log (Ml/GDP)
MMR - Money Market Rate
iwDEF - InflatP,n Rate using the GDP Deflator DIFLM2Z - (LM2Z - (LM2Z (-1))
DIFLMlZ - (LMlZ - (IMIZ (-1))
- 17
-Figure 3 shows that MI has been less responsive than M2 to changes
of the rate of return. This is confirmed by the estimates of demand for MI
(second equation in Table 3). The rate of return on deposits has a
significant value with a negative sign. As expected the response of Ml to
rates of return are weaker than for M2.
III. INDONESIA
Before 1983, the financial system was constrained by ceilings on
interest rates and on the expansion of credit. This policy generated a low
rate of return for financial savings. As a consequence, the degree of
monetization was low; the M2 to GDP ratio was stationary during the
seventies at a level of 18 percent, and time deposits represented about 20
percent of M2. As in Thailand, the openness of the economy to foreign
markets and the increase of world interest rates imposed the liberalization
of the interest rates.
This liberalization occurred in June 1983, therefore a little
later than in Thailand, and the delay may be explained by the second oil
boom that lasted until 1982. Its lessons are similar to those of the
Thailand experience.
(i) The removal of the ceilings on the rates and the volume of
credit was followed by a expansion of the financial sector that was large,
but smaller than in Thailand. The M2 to GDP ratio grew from 22 percent to
30 percent between 1982 and 1986.
(ii) The expansion of financial assets came from a substitution
with foreign assets and the informal market. The rapid growth of financial
assets after 1983 shows that the taxation of financial assets implies
The purpose of this section is to provide a quantitative
evaluation of the interest liberalization in Indonesia, which can be
compared with the similar experiences in Thailand and the Philippines. The
description of the experience will be kept short since an excellent account
of the financial policy has been given by Balifto et al. (1985, 1987).
A. The Resime Before June 1983
The Policy Context
The context .'or the policy on financial assets before and after
the reform has the following elements:
- The government is prevented from borrowing domestically by a balanced budget law (which does not apply to
foreign borrowing).
- Oil is an important resource for the government which
has produced well known windfall gains in 73-74 and
again in 79-80.
- The economy is open: there is no restriction on foreign trade or capital transactions. The exchange rate is
managed with periodically large devaluations by 50.6
percent in 1978, 43.5 percent in 1983 and 45.9 percent
in 1986.
- Interest rates and credit have been regulated until 1983.
Financial Institutions and Policy
The main financial institutions are:
- The Central Bank (43 percent of assets in 1982) that
plays an important role in financial markets through its
large rediscounts of banks' loans to the preferred
- 19
-- The state commercial banks (79.6 percent of assets in
1982) that were constrained by ceilings on deposit rates,
loan rates and level of credit.
- 1v private banks (16.8 percent of assets in 1982) that
consist of sixty nine national banks (with 9.9 percent of
total assets in 1982), and eleven foreign banks which were not subject to ceilings on interest rates credit levels but faced other constraints on their activities
(such as lending) to to enterprises basad in the Jakarta
area).
The two main elements of the financial policy were therefore the
ceilings on interest rates and credit, and the rediscounts of the Central
Bank. Two preliminary two remarks can be made about these policies.
- The interest rates ceilings were not motivated by a need for cheap public borrowing since a balanced budget law
prevented the government from borrowing domestically, and the debt of public enterprises was relatively low;
less than 2 percent of GDP. The ceilings applied to state banks, which dominate the financial sector institutions.
- The rediscountings by the Central Bank at low rates reached a level that was almost half of the banks' credit to the private sector. Resources were available for these loans. They were financed by seignorage. Resources were available to BI because the government
Interest Rates: A Two-Sector Banking System
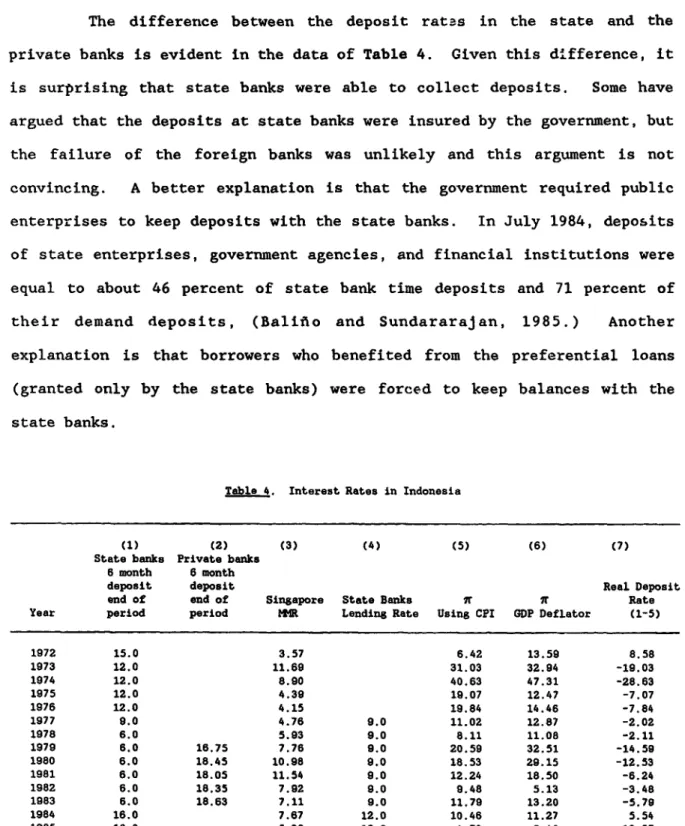
The difference between the deposit ratas in the state and the private banks is evident in the data of Table 4. Given this d'fference, it
is surprising that state banks were able to collect deposits. Some have
argued that the deposits at state banks were insured by the government, but
the failure of the foreign banks was unlikely and this argument is not convincing. A better explanation is that the government required public
enterprises to keep deposits with the state banks. In July 1984, deposits
of state enterprises, government agencies, and financial institutions were
equal to about 46 percent of state bank time deposits and 71 percent of their demand deposits, (Balifio and Sundararajan, 1985.) Another
explanation is that borrowers who benefited from the preferential loans
(granted only by the state banks) were forced to keep balances with the
state banks.
Table 4. Interest Rates in Indonesia
(1) (2) (3) (4) (5) (6) (7)
State banks Private banks 6 month 6 month
deposit deposit Real Deposit
end of end of Singapore State Banks If X Rate
Year period period MMR Lending Rate Using CPI GDP Deflator (1-5)
1972 15.0 3.57 6.42 13.59 8.58 1973 12.0 11.69 31.03 32.94 -19.03 1974 12.0 8.90 40.63 47.31 -28.63 1975 12.0 4.39 19.07 12.47 -7.07 1976 12.0 4.15 19.84 14.46 -7.84 1977 9.0 4.76 9.0 11.02 12.87 -2.02 1978 6.0 5.93 9.0 8.11 11.08 -2.11 1979 6.0 16.75 7.76 9.0 20.59 32.51 -14.59 1980 6.0 18.45 10.98 9.0 18.53 29.15 -12.53 1981 6.0 18.05 11.54 9.0 12.24 18.50 -6.24 1982 6.0 18.35 7.92 9.0 9.48 5.13 -3.48 1983 6.0 18.63 7.11 9.0 11.79 13.20 -5.79 1984 16.0 7.67 12.0 10.46 11.27 5.54 1985 18.0 5.38 12.0 4.73 6.49 13.27 1986 16.0 4.27 5.83 1987 3.89 9.28 Source: IFS.
- 21
-Rediscounting by the Central Bank
Loans by the Central Bank are either direct loans or rediscounts
of loans made by the commercial banks. The direct loans have bqen made
essentially to the public sector (mainly to PERTAMINA). BI's rediscounts,
called liquidity credits, were made for preferential sectors. In most
cases, the lending rate charged by the commercial banks was fixed at 12
percent, and BI rediscounted between 70 and 100 percent of the loan at the
rate of 3 percent. The commercial bank's share in a loan was therefore at
most 30 percent.
These rediscounts required large resources of the Central Bank
that come essentially from seignorage and the net deposits of the
government in equal parts. Since these resourc.es are fungible, a direct
relation between seignorage or government deposits and BI rediscounts
cannot be established. Nevertheless, the Central Bank has maintained an
approximate balance between the levels of liquidity credits and that of the
monetary base or the government net deposits. Whether this policy was
deliberate is not clear at this point.
The liquidity credits were very important resources for the DMBs,
(with a level equal to about half of that of deposits). Their share of the
loans (at most 30 percent) to the preferential sector was financed by
deposits that paid a low interest rate because of BI regulation. The
rediscounting mechanism was therefore fairly profitable to state banks.
Furthermore, the state banks could benefit from the requirement that public
enterprises kept deposits with the state banks. This policy was similar to
an official requirement that borrowers (or potential borrowers) should keep
compensating balances with the banks. It may have increased the effective
B. The Open Economy
As in Thailand, the mobility of capital between Indonesia and
foreign markets presented a constraint on the interest policy that ultimately led to the removal of interest ceilings. Since this market
structure plays an important role in the political economy of financial
reforms and is a factor that contributes to the large expansion of domestic
financial assets after the reform, it is interesting to examine the
empirical evidence.
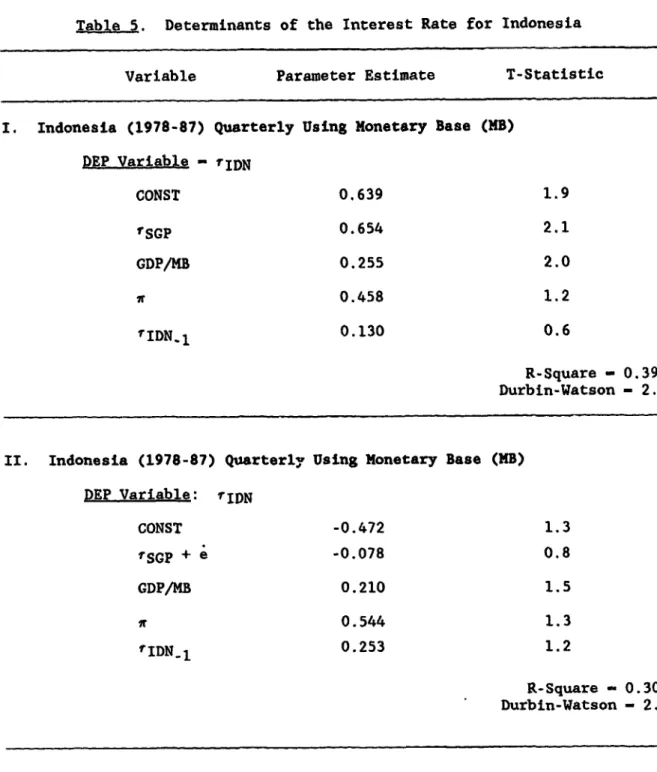
We have therefore investigated the determinants of the domestic
money market interest rate by the same method as for Thailand. The results
are presented in Table 5. Two measures of the foreign rate are used; the
first is the Singapore money market rate; the second uses the same rate
corrected by the actual variation of the exchange rate. We can observe
that the second measure performs poorly, for the same reasons as in
Thailand. Periods of a crawling exchange rate were interrupted by
maxi-devaluations in 1979 and 1983. In this context the proxy for the expected
value of the depreciation of the exchange rate can be taken as a constant
which implies a premium of the domestic rate over the foreign rate.
The results support the hypothesis of a link between the foreign
and *:he domestic rate. There is also some evidence that the domestic
mon6rary policy in Indonesia may have affected the domestic money market
rate.
C. The 1983 Reform
The Context: Pressures of the International Markets
The financial policy of interest and credit ceilings became
unsustainable in the early eighties when foreign interest rates rose. The
level of net foreign assets of banks, as a fraction of deposits, had been
23
-Table 5. Determinants of the Interest Rate for Indonesia
Variable Parameter Estimate T-Statistic
I. Indonesia (1978-87) Quarterly Using Monetary Base (MB)
DEP Variable - rIDN
CONST 0.639 1.9 rISp 0.654 2.1 GDP/MB 0.255 2.0 7r 0.458 1.2 7IDN. 1 0.130 0.6 R-Square - 0.395 Durbin-Watson - 2.0
II. Indonesia (1978-87) Quarterly Using Monetary Base (MB)
DEP Variable: rIDN
CONST -0.472 1.3 fSGP + e -0.078 0.8 GDP/MB 0.210 1.5 ir 0.544 1.3 nIDN-1 0.253 1.2 R-Square - 0.308 Durbin-Watson - 2.0
Note: e is the change of the exchange rate between the home country's
currency and the Singapore Pound.
Table 6. Financial Ratios of the Deposit Money Bank in Indonesia
RES NFA TRES CPS NETCG K OT LIABIL CCB
1972 0.286 -0.225 0.061 1.191 -0.055 0.148 0.275 1.423 0.479 1973 0.281 -0.451 -0.17 1.433 0.12 0.178 0.656 1.834 0.393 1974 0.42 -0.444 -0.02 1.328 0.192 0.174 0.766 1.94 0.373 1975 0.38 -0.221 -0.159 0.477 0.227 0.211 -0.127 1.084 0.461 1976 0.36 -0.145 0.215 0.458 0.252 0.188 -0.118 1.07 0.397 1977 0.36 -0.126 0.234 1.093 0.228 0.216 0.464 1.68 0.333 1978 0.274 -0.087 0.187 0.584 0.205 0.229 -0.166 1.064 0.383 1979 0.313 0.001 0.314 0.604 0.189 0.178 -0.071 1.106 0.409 1980 -0.295 0.19 0.486 0.612 0.152 0.188 -0.128 1.06 0.383 1981 0.243 0.24 0.483 0.569 0.161 0.172 -0.199 0.973 0.442 1982 0.3 0.034 0.334 0.636 0.283 0.191 0.028 1.219 0.587 1983 0.205 0.115 0.32 0.702 0.26 0.184 -0.017 1.166 0.481 1984 0.203 0.106 0.308 0.628 0.318 0.197 -0.049 1.149 0.629 1985 0.194 0.132 0.326 0.675 0.239 0.168 -0.059 1.108 0.464 1986 0.168 0.153 0.321 0.802 0.234 0.175 0.029 1.204 0.444 1987 0.149 0.085 0.235 0.866' 0.178 0.159 0.035 1.194 0.352 Variables
All variables are expressed as a fraction of total deposits (demand and time).
RES -serves
NFA Ne6 foreign assets TRES Sum of RES and NFA
cPS Net banks' credit to the private sector (the difference between the banks' credit to the private sector and the BI rediscounting).
NETCG Sum of credit to the government and to public enterprises minus the government's deposits.
K Banks' capital
OT Net other liabilities minus loans to other financial institutions LIABIL Total liabilities (equal to total assets)
CCG BI loans to DNBs (rediscounting)
The variable NETCG does not represent the net liability of the public sector since it does not include the deposits of the public enterprises. (The net position of the government with DMBs has been always positive).
The level of total liabilities (of assets) exceed that of deposits. Therefore the value of LIABIL is greater than one.
- 25
-this growth BI started to pay interest on excess-reserves in 1978. The
liquidity ratio of banks (the sum of net foreign assets and reserves divided by total deposits), continued to increase after 1978 (Figure 4).
This growth of the liquidity ratio had two causes. Banks were facing a
constraint on the expansion of credit and domestic lending rates were low
with respect to foreign rates. Both of these factors contributed to the
high liquidity ratios. One could argue that since the credit constraint
was binding it may have been the sole explanation of the high liquidity.
eilings on loan rates, the enforcement of the credit constraint might have
proven to be impossible, and that therefore both factors had an effect. In
other terms, it seems doubtful that a relaxation of the credit constraint
would have led to a significant expansion of the banks' credit to the
private sector and interest ceilings may have been the main constraint on
the expansion of domestic financial assets. (Such a hypothesis is
difficult to test, however).
The differential between domestic and foreign rates induced an
outflow of capital. The second oil boom of 1979-1981 provided a temporary
counterweight to this outflow. But, in 1982, the net foreign assets of the
financial system began to fall. Furthermore, the real exchange rate had
decreased during the boom period because of domestic inflation. The nominal exchange rate was allowed to depreciate at the cumulative rate of
12 percent between 1980 and the March of 1983, when a maxi-devaluation of
39 percent was effected. The new exchange rate created an environment
where the financial markets could be liberalized without a severe disruption due to speculation against the rupiah.
Figure 4. Liquidity Ratio of the DMBs (Reserves Plus Net Foreign Assets)/
Total Deposits TRESRAT
0.45
0.4 / 0.35 -0.3i 0.25 0.2__ 0.1s ,__ 0..05 _ 76 77 78 79 so 8 82 83 84 as 86 87 Source: IFS.- 27
-Policy Measures
The main effect of the reform was to eliminate in June 1983 the
- bank credit ceilings
- state banks' interest rates on deposits and loans (except for the remaining priority loans)
Simultaneously with this change of regime, a process to reform of
the credit policy of the Central Bank towards commercial banks was initiated with the
- Phased removal of a wide range of loan categories from access to the Central Bank liquidity credits
- Introduction of rediscount facilities and the BI certificate (SBI) as new tools of monetary control
(February 1984)
- Introduction of new money market instruments (February 1985).
D. The Im2act of the Reform
The main impact of the reform has been the large increase of bank
deposits. As can be expected, the growth of interest bearing time deposits
has been the dominant component of this growth (Figure 5). The response of
the demanu for money to the interest rate is apparent in the estimates of
the demand for money that are presented in Table 7. The deposit rate was
also found to be significant for the sub-period 1972-1982 during which
public enterprises were required to hold deposits at the state banks.
Both the nominal rate and the inflation rate are significant variables, but they can be replaced by their difference, i.e., the real deposit rate, without loss of explanatory power. In order to determine the
Figure 5. Financial Deepening and the Real Interest Rate in Indonesia 0
~
~5
76 08 8 .7 .87 48 68 0.4;-MIZ
Ml/GDP~~~~~~~~~~~~~I
Daw: I_ dS °_0_r°\°- °7a=0o-° M2Z ° ' *1- =~~~~~~~~~~~~~~~~C- RRAT 73 74 75 76 77 78 79 80 81 82 83 84 83 86 87 ',IZ -MI/GDPIN5F Inflation rate (CPI)
RRATE Oppomtuniy cost of money- INF - Deposit rate Data:[FS
- 29
-Table i. Results of Money Demand Equations for Indonesia (Annual Data)
I. Dependent
Variable Constant LM2Z(-l) DEPR irDEF
LM2Z -0.172 0.747 0.297 -0.244
(1972-85) (1.6) (5.7) (2.0) (4.9)
R2- 0.939 DW - 1.86
II. Dependent
Variable Constant LM2Z(-l) RDEPRDEF
DIFLN2Z -0.13 -0.206 0.240
(1972-85) (1.9) (2.4) (6.2)
RZ - 0.778 DW - 1.66
Note: LM2Z - Log(M2/GDP)
DEPR - Deposit rate
DIFLM2Z - :4M2Z - LU2Z(-l))
wDEF - Inflation rate using the GDP deflator
RDEPRDEF - Real deposit rate or (DEPR - xDEF)
Log M2 _ 0.13 - 0.206 ([log M2 ]-I - 1.17 (RDEPR))
GDP (0.07) (0.08) GDP (0.45)
R2 - 0.778 DW - 1.66
The coefficients in the equation imply that an increase of the
real rate by 20 percentage points (which is the variation between 1980 and
1986) generates an increase of the money to GDP ratio of 23 percent. This
value is obviously very sensitive to the estimated coefficient of lagged
money, which is subject to a significant uncertainty. The range within two
standard deviations is between 5 and 40 percent. Note that the actual
increase of the M2 to GDP ratio was about 50 percent between 1982 and 1987,
which is beyond the range within two standard deviations. Some exogenous
financial deepening cannot be ruled out.
This higher than predicted growth must be due to either a change
of the demand for money (that may have been involved by the switch of
regime) or to exogenous factors. The reliance share of these factors
cannot be determined in the framework of this study.
IV. PHILIPPINES
Before 1980, nominal interest rates were constrained by ceilings as in
Thailand and Indonesia. This policy depressed the level of financial deepening; the M2 to GDP ratio stayed at a stable level in the seventies,
below 22 percent. As in Thailand and Indonesia, the rise of the
differential between domestic and foreign rates stimulated a gradual and
eventually complete liberalization of domestic interest rates which was
implemented between 1981 and 1983. However, in contrast to the results in
- 31
-generate an increase of the bank deposits. In 1987, the M2 to GDP ratio
was the same as in 1981.
During the eighties, there were two important differences between
the financial policies in the Philippines and those of Thailand and Indonesia. The first was a high inflation rate, which was the consequence
of macroeconomic policies. The effect of inflation on deposits was
amplified by the taxation of financial institutions through reserve
requirements and a loan tax. These policies had a powerful impact on the
financial system because they had conjugated effects.
As the inflation rate increased during the second oil shock, the
level of the real deposit rate declined (Table 8). In the years 1980 to 1982, the various restrictions on rates were lifted gradually, and interest
rates were completely free by the end of 1982. Nevertheless, real rates
were negative again during the inflationary episode of 1984-1985. The fall
of the real rates induced a decrease of the money to GDP ratio. The question here is why was the real deposit rate negative after the
liberalization?
A. The Openness of Cagital Markets
Before 1983, the regulations on capital movements with the foreign
markets could be circumvented by well-known methods. Since the complete
interest rate liberalization of 1983, there are no restrictions on the
holdings of foreign exchange.
The representative interest rate for the money market in the
Philippines is the Treasury bill rate. The T-bill market plays a vital
role in the finance sector in Philippines by its sheer size. A large
Table 8. Interest Rates in Philippines
(1) (2) (3) (4) (5) (6) (7)
w Using (Deposit
Deposit T-Bill Lending Singapore r Using GDP Rate-w)
Rate Rate Rate MMR CPI Deflator (1-5)
1972 8.0 3.57 8.20 6.79 -0.20 1973 8.0 11.69 16.58 18.08 -8.58 1974 9.25 8.90 34.16 31.02 -24.91 1975 11.0 4.39 6.76 8.33 4.24 1976 12.0 10.19 12,0 4.15 9.20 9.19 2.80 1977 12.66 10.89 12.0 4.76 9.90 7.41 2.76 1978 10.77 10.88 12.0 5.93 7.33 9.19 3.44 1979 12.72 12.26 14.0 7.76 17.53 15.24 -4.81 1980 13.2 12.14 14.0 10.98 18.20 15.60 -5.0 1981 15.51 12.55 15.34 11.54 13.08 10.98 2.43 1982 15.5 13.78 18.12 7.92 10.22 8.43 5.28 1983 15.68 14.23 19.24 7.11 10.03 11.73 5.65 1984 24.7 28.53 28.20 7.67 50.34 49.69 -25.64 1985 21.8 26.72 28.61 5.38 23.10 7.66 -1.30 1986 13.0 16.08 17.53 4.27 0.75 11.80 12.25 1987 8.0 11.51 13.34 3.89 3.79 7.07 4.21 Source: IFS.
- 33
-billion in June 1987 (Honohan, 1988). Because the authorities can withdraw
bills from the auction if the price is too low (and the rate too high),
some have speculated that the T-bill rate may be regulated. This is of
course not a proof that the authorities can control the T-bill rate over an
extended period, given the constraints of government borrowing and of the
foreign market.
The relation between offshore and markets and the domestic
Treasury bills market is tested in Table 9. Two values for the foreign
interest have been considered. The first is the money market rate in
Singapore. The second is the MMR in Singapore corrected for the
depreciation of the peso with respect to the Singapore dollar. Note that
the second variable is significant. For Thailand and Indonesia, only the
first index of foreign rates was significant. This difference is easily
explained: the currencies of Thailand and Indonesia were allowed to crawl
in a narrow band between maxi-devaluations. But in the Philippines, the
variations of the domestic price level and of the e. change rate were more
frequent and of greater magnitude. The actual variation of the exchange
rate was therefore anticipated to some extent. The results of the table
show that the domestic interest rate was influenced by the foreign rate as in the two other countries of our study.
The level of Treasury bill rate has always been greater than the
time deposit rate. This difference is due to the combination of burden of
taxation on the intermediation margin and the access of non bank agents to
the market for T-bills. The taxation of the financial institutions raise
two issues here. First, the burden was significant in the years with
"normal" inflation because the interest rates on reserve and loan
Iable 9. Determinants of the T-Bill Rate in Philippines
Variable Parameter Estimate T-Statistic
I. Philippines (1976-87) Quarterly Using Monetary Base (MB) DEP Variable r 'PHL* CONST 0.027 0.3 TSGP + 0.205 2.3 GDP/MB -0.014 0.4 ff 0.421 2.8 'PHL-1 0.860 13.6 R-Square - 0.846 Durbin-Watson - 2.1
II. Philippines (1976-87) Quarterly Using Money Supply (M2) DEP Variable - TPHL _%,> I ai. ., -U.J 1.4 TSGP + 0.252 2.7 GDP/M2 0.091 1.3 if 0.428 2.9 T PHL-1 0.857 13.8 R-Square - 0.851 Durbin-Watson - 2.1
- 35
-Table 9: (Cont'd.) Determinants of the T-Bill Rates in the Philippines
Variable Parameter Estimate T-Statistic
III. Philippines (1976-87) Quarterly Using Monetary Base (M2)
DEP Vaxiable - rPHL CONST -0.063 0.5 TSGP 0.137 0.6 e 0.004 1.3 GDP/M2 0.032 0.4 -n 0.573 3.9 TPHL-1 0.766 9.0 R-Square - 0.833 Durbin Watson - 2.2
*Note TPHL here is the Treasury Bill Rate as opposed to rTHA and rIDN which are the Money Market Rates.
Also note that e is the exchange rate between the home country's currency and the Singapore Pound.
Second, the values of the regulated rates were not adjusted during the
years of high inflation, thus widening the gap between lending and deposit
rates. The wedge between the lending and the deposit rates is explained by
the explicit and implicit taxes on banks which are now discussed in greater
detail.
B. Explicit and Impllcit Taxes on Banks
Explicit Taxes
In contrast to Thailand and Indonesia, where there are no special
types of taxes, the Philippines have two types of taxes on the banking
industry.
(a) The Gross Receigt Tax (GRT) is levied on all bank
receipts (including both interest and capital gains).
GRT is imposed on a sliding scale, with a lower rate
applied to income from instruments of longer-term
maturity (with a maximum rate being 5 percent). During
1983-86, the GRT added between 73 and 99 basis points
to the average intermediation cost.
(b) Withholding Tax of 20 Percent is levied on all but
overnight deposits (Financial Sector Study, p. v).
This tax is a tax on savers which does not result in
double taxation and is not very important for our study
since it is not a direct tax on financial institutions.
Implicit Taxes
The instruments of implicit taxation are the requirements for
reserves and for specialized loans at low interest rates. Reserves paid
only an interest rate of 4 percent and represented an average of 18 percent
- 37
-d The requirements of special loans are that banks have to allocate
25 percent of net loanable funds for agricultural credit with 15 percer.
for general agriculture and 10 percent for beneficiaries of the agrarian
Deform program (they have been practically abolished now). Banks have also
the option to purchase specified securities at 9.0 percent coupon rate
instead of providing "riskier" loans to agriculture to comply with the
regulations. This program has not been as successful as intended since
most banks, which are based in urban areas, have little expertise in agricultural lending. Urban-based banks perceive the loans to agriculture
as being quite "risky". In the past the yield on these agri-agra
securities has been lower than the yield on secured loans. As a
consequence, the agri-agra requirements imposed on all commercial banks
have further contributed to the increase in intermediation costs. This
higher cost is passed on to the depositors through higher spreads.
The Interaction of Inflation and Taxes on Financial Institutions
The difference between the lending and the deposit rates increased
sharply in 1984 and 1985. The values of the time deposit rate and of the lending rate are presented in Figure 6. One can observe that after the complete liberalization of interest rates in 1982, the values of the two
rates move on a line. The slope of this line is about 0.7. When the loan
rate increases by one point, the deposit rate can increase only by (l-k)(l-a)(l-t) point, where k, a and t represent the rates of the reserve requirement, of the requirement for agri/agra loans and of the GRT. When
inflation increased in 1984-1985, the nominal lending rate increased (albeit by an amount smaller t;an the inflation rate increase). The
(1980-87)
20~~~~~~~~~~~~~~~~~~~~~~~~~~~~~~~~~~~~~~~~~~
1.1
O.1
so0
Il loO/3SOI
6 f?o
A
.
t2
Sore
/Fs
Lenin
a-I~
~
~ ~ ~ ~
~
~
~
~
~
~~~~~~~~~~~~~~Rt
.s
II} so. A
8.L
- 39
-deposit rate increased only by about 70 percent of the same amount. The
effective tax rate increased by .3 points for every point increase of the
nominal lending rate.
C. The Imr.act of Interest Rates on Deposits
The impact of the high level of taxation on financial institutions
can be observed in Figure 7. The M2 to GDP ratio increased after the
liberalization of interest rates, but fell in the inflation years of 1984
and 1985.
Th_ response of the demand for money to the opportunity cost is
measured in the estimations that are presented in Table 10. The coefficients of the explanatory variab'.es are significant and have the
right sign.
These equations imply that the long-run response of the level of
deposits to the real rate of return is at least as high as in Indonesia.
The degree of financial deepening is now at about the same stage as in
Indonesia before the interest liberalization. One can therefore expect
that the efficiency of removing taxes on the financial intermediation in
the Philippines will be of the same order of magnitude as they have been in
Indonesia over the last four years. We now turn to the analysis of the efficiency gains of the successful reforms in Thailand and Indonesia.
V. THE EFFICIENCY GAINS OF INTEREST LIBERALIZATION
The results of the previous sections show that the taxation of financial assets involves an important reallocation of the stock of savings
Figure 7. Financial Deepening and the Real Rate in the Philippines 0.6*. 0.5 , a 0.4 0.3 -- 2 0.21 \ 0.1 1g6197¶97197197197197¶97197197197¶gSlgSl9819lgeglgelgs¶98 9 0 2 3 4 5 6 7 8 9 0 1 2 3 4 5 6 7 Source: IFS.
- 41
-Table 10. Results of Money Demand Equations for Philippines
I. Dependent
Variable Constant L12Z(-1) DEPR w
LM2Z 0.370 0.837 0.349 -0.294
(1972-87) (1.2) (6.2) (2.5) (5.2)
R2 - 0.879
DW - 1.87
II. Dependent
Variable Constant LM2Z(-1) RDEPR
LM2Z 0.350 0.849 0.288
(1972-87) (1.2) (6.6) (6.4)
-R - 0.879 DW - 1.85
III. Dependent
Variable Constant LM2Z(-l) DEPR TBRATE 7rDEF
LM2Z 0.848 0.643 0.235 -0.218 -0.179
(1976-87) (1.2) (2.1) (0.6) (0.8) (1.8)
R' 0.508
DW - 1.59
Note: LM2Z - Log(M2/GDP)
DEPR - Deposit rate
i - Inflation rate using the CPI
RDEPR - Real deposit rate or (DEPR-w) TBRATE - Treasury Bill Rate
ffDEF - Inflation Rate using the GDP deflator
Figure 8. The schedule (S) is the supply of deposits at banks by the
private sector. It represents the private opportunity cost of funds whizh
is equal to the net rate of return on deposits. The schedule (D)
represents the demand for loans from banks by the private sector, which
depends on the lending rate. For simplicity, the banks's intermediation
costs can be assumed to be equal to zero. The equilibrium with no taxation
is represented by the point E.
In the analysis of the efficiency cost of financial taxation we
have to ignore the cross effects in other markets. These effects depend on
the values of the tax rates for other goods and on the impacts of financial
taxation on the levels of tcansactions in these goods. Unfortunately, we
do not have any evidence eixher on the values of the tax rates or on the
magnitude of these cross-effects, and we have to restrict ourselves to the
partial analysis of the Figure 8.
The wedge of deposits is represented by the segment AB. This
wedge may be created by an explicit tax (on loans, or reserves) such as in
the Philippines after 1980, or by a ceiling on the deposit rate that is
fixed at iD, as in the case of Thailand, Indonesia, or the Philippines
before 1980. In the latter case, the loans are rationed and the tax wedge
AB is implicit: borrowers who are lucky to get a loan pay the same rate iD
since the bank cost is netted out), and the total rent of borrowers is
equal to the implicit tax revenues, which is measured by the area ABCD.
There are several problems that arise in the analysis of the
efficiency cost of interest ceilings.
(i) The social opportunity cost that is represented by the
schedule (S) depends on the alternate use of funds (in
- 43
-FiRure 8. The Efficiency Cost of Taxation
i
i
C
B
/(S)
X.
.
(D)D 77
A
0
MA
ME
M
(ii) The demand (D) for bank funds is affected by the supply (S)
of the depositors who shift their assets between the formal
and informal markets and borrowers rely on the formal and
informal credit markets.
(iii) When the tax is explicit, a possible measure of the
efficiency cost is equal to the area of the triangle AEB.
(iv) When there is an interest rate ceiling with rationing, this
afficiency cost should include also the amount of resources
used by borrowers to capture at least some of the rent. The
maximum amount of the resources devoted to rent seeking is
equal to to the area ABCD.
The efficiency cost depends on the slopes of the two schedules (S)
and (D). The slope of the supply (S) can be computed from the empirical data of the previous sections. Unfortunately there is no evidence on t*e
slope of the demand schedule (D). Its value depends on the possibiliti,es of substitution for borrowing by the private sector and on the production
technology.
In this paper we measure only the area AHE. A detailed analyswis
of the efficiency cost that takes into account all the aspects listed above
((i) to (iv)) would provide a value that is greater than the area AHE which
is therefore a lower bound estimate of the true value. This area is equal
to:
W - - (iE - iA) (ME -
MA)-2
This formula is very simple, but there are measurement problems
for each of the terms in the formula. Both problems arise because the interest liberalization takes time to have an effect. The empirical evidence shows that the time lag may be about four or five years. During
- 45
-this interval of time, the market rate iE may change and this variation affects the measurement of the interest change iE-iA.
The measurement of the increase of money is affected by a similar
problem, since some growth of the money to GDP ratio may be due to exogenous factors. However, the case of the Philippines serves as a reminder that the expansion of the financial system is not an inevitable
fact and may be completely stalled by policy.
Table 11 presents estimates of the changes. of interest and bank deposits (in terms of GDP) for Thailand and Indonesia that conducted a successful interest liberalization. The values of the efficiency gains are
about 3 percent and 1 percent of GDP for Thailand and Indonesia, respectively.
We have seen that these values may underestimate the efficiency kain. An important source of bias may come from the omitted area of the producer surplus ABE. In order to assess its magnitude one can also ask
what would have been the market lending rate iB in these two countries; if a tax on financial institutions had introduced a wedge AB. This is in fact
the present situation in the Philippines. It seems that the difference between the lending rate and no tax on financial institutions iE, is not very large, i.e., much smaller than the difference of between the deposit wates iE - iA. This would indicate that the downward ,Aas of the estimates
in Table 11 is fairly small.
The efficiency gain of the interest liberalization are small in
terms of GDP, but they are large in terms of tax revenues (explicit or implicit). In the framework of the Figure 8, the tax revenues are measured
by the area ABCD. The measurement problems are the same as for the
Table 11. The Efficiency Gain of reform
Efficiency Gains in
Increase of the Initial Level Increase of Efficiency Gain Terms of
Rate of Return of Deposit Deposit In Terms of GDP Revenue
(1) (2) (3) (4) (5)
Thailand .05 .( 26 .3 0.075 0.58
Indonesia .13 b/ 0.04 c/ 0.12 d/ 0.062 1.19
Notes:
a/ This value is equal to the difference between the average real rates before and after the reform.
_/ The increase is equal to the difference between the rates of unrestricted banks just before the reform (see Table ).
c/ This value is smaller than the ratio between all time deposits and GDP because only a fraction of these deposits was taxed (see Section II).
A/ This is a fraotion that represents the total increase of money end quasi-money. This fraction is equal to ,8 to be compatible with the estimated demand for money.
From the empirical evidence of the previous sections, we have
assumed that most of the increase of deposits came from assets that were
outside the financial sector (in informal or foreign markets). The levels
of time and saving deposits at the time of the reform are reported in
column (2) of the table. The tax revenues are therefore equal to the
products of the numbers in the first two columns. The efficiency cost
computed as a fraction of tax revenues in column 5. We now observe that it
is very high. In Indonesia the efficiency cost of the interest ceiling was
- 47
-VI. CONCLUSIONS
This study has shown that the removal of constraints (interest rate ceilings, credit targets) has a very powerful impact on the level of
financial assets in the domestic sector. The reforms were successful in
Thailand and Indonesia because all interest and credit constraints were
removed. A similar reform failed in the Philippines because taxes were
monitored on the financial sector and interacted with the inflation rates.
The efficiency gains of the successful reforms were small when
compared to GDP, but very large when compared to the levels of transfers
(explicit or implicit) that were induced by the policies of regulation.
The lesson of the experience is that a reallocation of resources through
the manipulation of the financial system may be very inefficient relative
to other fiscal policies. This hypothesis that was verified for Thailand
and Indonesia, most certainly applies to the Philippines, and remains to be
REFERENCES
Balino, T.J.T., and V. Sundararajan, "Finan.ial Reform in Indonesia: Causes, Consequences, and Prospects, in Hang-Sheng Cheng, ed., 1984, 191-219.
Edwards, S. and M. Khan, "Interest Determination in Developing Countries, A Conceptual Framework, IMF Staff Papers, 1985, 377-403.
Fry, M., "Financial Structure, Financial Regulation, and Financial Reform in the Philippines and Thailand, 1960-1984, Chapter 12 in Hang-Sheng Cheng, ed., 1984, 161-184.
Fry, M., Money. Interest and Banking in Economic Development, The John Hopkins University Press, Baltimore, 1988.
Giovannini, A., "The Interest Elasticity of Savings in Developing Countries: The Existing Efficienco," World Development, 11(7), July 1983, 601-607.
---, (1985), "Saving and the Real Interest Rate in LDC,"
Hang-Sheng Cheng, ed., "Firancial Policy and Reform in Pacific Basin Countries", Lexington Books, 1984.
McKinnon, R. (1973). "Money and Capital in Economic Development", Washington, D.C.: The Brookings Institution
Honohan, P, "Philippines: Interest Rate and Credit Conditions", Draft Chapter for Report on Financial Sector Study. Washington, D.C., The World Bank, January 8, 1988.
McKinnon, R. (1986), "Financial Liberalization in Retrospect: Interest Rate Policies in LDCs", mimeo, Stanford University, March 1986.
Newbery, D. and N. Stern, (1986), "The Theory of Taxation for Developing Countries", Washington, D.C., The World Bank.
Philippines: Financial Sector Study, Vol. I, The Main Report, Washington, D.C. The World Bank, May 6, 1988.
Shaw, E. (1973). "Financial Deepening and Economic Development", Washington, D.C.: The Brookings Institution,
Vorgpradhip, D. "Urban Unorganized Markets in Thailand", Ouarterly Bulletin of the Bank of Thailand, June 1986, 27-45.
PPR Working Paper Series
Title Author Date Contact
104 Economic Effects of Financial Crises Manuel Hinds October 1988 L. Horsepian 32979
105 Securing International Market Access Richard H. Snape October 1988 J. Sweeney 31021
4PS106 Energy Issues in the Developing World Mohan Munasinghe Robert J. Saunders
MPS107 A Review of World Bank Lending for
Electric Power Mohan Munasinghe Joseph Gilling Melody Mason
WPS1O8 Some Considerations In Collecting Data
on Household Energy Consumption L. Leltmann
WPS109 Improving Power System Efficiency in the Developing Countries Through
Performance Contracting Philip Yates
WPS110 Impact of Lower Oil Prices on
Renewable Energy Technologies E. Terrado M. Mendis K. Fitzgerald
e111 Recent World Bank Activities in Energy Industry and Energy Department
WPS112 A Visual Overview of the World Oil
Markets Kay McKeough
Jose Escay Sompheap Sem
WPS113 Public Sector Pay and Employment
Reform Barbara Nunberg October 1988 J. Cheeseman 61703
WPS114 Africa Region Population Projections
1988-89 edition My T. Vu October 1988 S. Ainsworth
Eduard Bos 31091
Rodolfo A. Bulatao
WPS115 Asia Region Population Projections
1988-89 edition My T. Vu October 1988 S. Ainsworth
Eduard Bos 31091
Title Author Date Contact
WPS116 Latin America and the Caribbean Region Population Projections
1988-89 edition My T. Vu October 1988 S. Ainsworth
Eduard Bos 31091
Rodolfo A. Bulatao
WPS117 Europe, Middle East, and Morth Africa (EMN) Region Population Projections
1988-89 editlon My T. Vu October 1988 S. Ainsworth
Eduard Bos 31091
Rodolfo A. Bulatao
WPS118 Contract-Plans and Public
Enterprise Performance John Nellis October 1988 R. Malcolm 61707
WPSI19 Recent Developments in Commodity
Modeling: A World Bank Focus Walter C. Labys October 1988 A. Daruwala 33716
WPS120 Public Policy and Private investment
In Turkey Ajay Chhibber October 1988 A. Bhalla Sweder van Wijnbergen 60359
WPS121 Commercial Bank Provisioning Against
Claims on Developing Countries Graham Bird October 1988 1. Holloman-Will 33729
WPS122 Import Demand In Less Developed
Countries Riccardo Faini Lant Pritchett Fernando Clavijo
WPS123 Export Supply, Capacity and Relative
Prices Riccardo Faini
WPS124 International Macroeconomic
Adjustment. 1987-92 Robert King Helena Tang
.PS125 The Effects of Financial Liberaliza-tlion on Thailand, Indonesia and
the Philippines Christophe Chamley October 1988 A. Bhalia Qaizar Husain 60359