Monitoring of Power System Topology in Real-Time
Mladen Kezunovic
Texas A&M University
Email: kezunov@ee.tamu.edu
Abstract
Power system topology is defined by the connectivity among power system components such as generators, power transformers, transmission lines, loads, etc. The knowledge about topology is important for correct execution of many monitoring, control and protection actions. This paper introduces an approach that assures accurate determination of the topology in real-time. To be able to justify why this approach is important, the paper gives a background of the topology determination problem and discusses the impact on various application functions. An implementation of the proposed approach consisting of hardware and software modules is outlined. Examples of the functional improvements due to the increased accuracy of topology determination at both the substation and system-wide level are presented at the end.
.
1. Introduction
Topology of power systems is defined by interconnections among power system components such as generators, power transformers, busbars, transmission lines and loads. The interconnected infrastructure is called power system network. The topology of the network is obtained by determining status of the switching components responsible for maintaining the connectivity status within the network. Such components are called circuit breakers (CBs), and they are used to connect or disconnect any power system component to/from the rest of the network. In addition, some of the applications require knowledge about the power system model where the values of the parameters for all the components in the network need to be defined.
The most common way of determining power system topology is through monitoring of the (CB) status. Real-time monitoring is typically done through Remote Terminal Units (RTUs) of a Supervisory Control and Data Acquisition (SCADA)
system. The RTUs are wired to the CB contacts in the substation switchyard, and the detected changes in the CB status are reported to the operators through a SCADA interface.
Today’s practice for determining CB status is to monitor the control circuit contacts “a” and “b”. Those contacts are designed to be in a complementing position so that an opening or closing of the CB can be easily determined by verifying the opposite status of the “a” and “b” contact positions. While this approach has been used for some time, the reliability of the contact “a” and “b” indication has always been a concern due to relatively frequent errors in the readings of the contacts, that may malfunction, or the errors in the SCADA communications, that may fail. As a result, alternative ways of making sure the CB position is determined more reliably are explored in the literature.
The published literature focuses on two general issues associated with determination of the topology, namely the system wide attempt to improve overall network topology determination and the local attempt to improve status determination of a single CB. The network topology issues discussed so far include an ability to dynamically determine the status [1] and possibility for more precise topology determination [2]. The local topology issues, addressed at the substation level, included discussion of the automated analysis of CB status based on signal measurements from the CB control circuitry [3], and discussion of the topology consistency check based on measurements from substation intelligent Electronic Devices (IEDs) [4].
This paper focuses on an extension of the local breaker monitoring concepts to the problem of monitoring the topology of the entire network. After discussing the background of the monitoring tasks and the relevance of the real-time monitoring, the paper outlines an implementation and benefits of the new approach. Future needs are given at the end.
Copyright 2005 IEEE. To appear in the proceedings of the Hawai'i International Conference on System Sciences, HICSS 39, Kauai, Hawaii, Symposium on Electric Power Systems Reliability,January 4-5, 2006
2. Monitoring background
Monitoring of power system operating status may include measurements of analog signals, as well as measurements of CB contact status. This section discusses how the monitoring may be performed for local vs system-wide applications.
2.1. Monitoring of local events
The local events associated with operation of a substation include operation of digital relays in the event of a fault or simple switching of a circuit breaker as a consequence of operator action performed through SCADA. As a part of the monitoring of local events, the required measurements may be either local or system-wide.
2.1.1. Use of local measurements. Typical
situation where local measurements are used for local monitoring function is the case where a Digital Fault Recorder (DFR) is wired to monitor substation analog measurements and contacts from circuit breakers. In this case the sampling of all the measurements (signals) is synchronous across the entire substation. Detailed analysis of protective relay operations can be performed to accurately determine the fault type and the timing in the switching sequences that include multiple circuit breaker operations [5].
2.1.2. Use of system-wide measurements.
System-wide measurements may be of interest in analyzing local events when the information about system topology and sparse measurements across the network are used to make conclusion about local events. The case in point is a new fault location algorithm that relies on a fitting procedure where the signals obtained from short circuit studies are compared to the signals recorded in the field [6]. A fault is placed in the system model and simulations are performed to generate fault signals at the points in the system where field measurements with DFRs are made. By comparing the field-recorded and simulated signals, an optimization of the match is performed while moving the fault location in the model. An optimal match is obtained by minimizing the error between the field and simulated signals. The fault location in the model that leads to the minimum of the cost function is then taken as the actual fault location. Obviously, this method requires that both the network topology and system-wide measurements are determined for the same time instant.
2.2. Monitoring of system-wide events
Another monitoring situation is when the system-wide events require the knowledge of individual control actions performed at local substations. The case in point is an analysis of a cascading event leading to a blackout. In this case, the impact of local events causes broader impact at the system level.
2.2.1. Use of local measurements. Local
measurements of analog signals and contact status can contribute to the understanding of system-wide events. An example is when the measurements are helping in understanding actions from several protective relays. This is particularly important in the case when N-2 contingency happens in the system. This type of contingency, while still considered a local event, may significantly affect the operation of theentire power system [7].
2.2.2. Use of system-wide measurements. This
case is very common in any of the energy management system (EMS) functions. Most of the EMS functions are system-wide and hence the measurements required to execute the function are system-wide. Examples of such situations are the state estimation and system stability monitoring functions [8].
As a summary of the discussion related to the monitoring background, Table I gives set of examples where local and system-wide events may be monitored using either local or system-wide measurements. While the mentioned examples are well known applications in the power system, the specific use of the measurements given in Table 1 is a special case of the application implementation that is not commonly used today but has distinct benefits as described in the mentioned references.
Table 1. Monitoring and Measurements Events Measurements Target
Local Relay operation
Local System-wide Fault Location
Local N-2 contingency
assessment System-
wide System-wide a)State Estimation b)System Stability
3. Monitoring in real-time
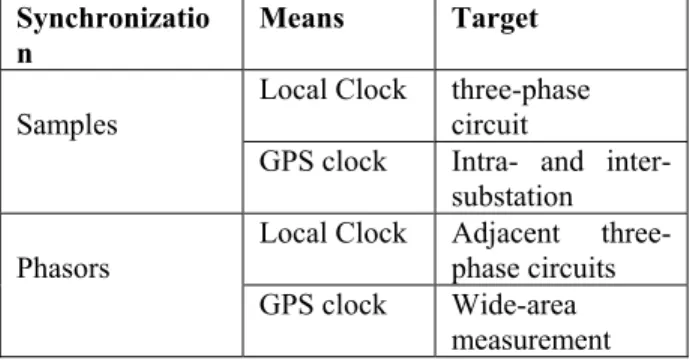
This type of monitoring requires that both the analog measurements of current and voltages, as well as measurements of CB status are taken. Depending on the events of interest, different type of measurements may be required as summarized in Table 2 and discussed in detail in the following text.
3.1. Measurements of currents and voltages
Currents and voltages may be measured to determine time-domain representation or to reconstruct a phasor. Various applications require different forms of current and voltages. In order to perform the measurements, samples of current and voltages need to be taken. Two distinctly different approaches in sampling synchronization may be implemented: a) synchronized sampling and b) unsynchronized sampling commonly called signal scanning. Further discussion is focused on synchronized sampling, which is less common but yet more desirable from the applications stand-point.
3.1.1. Sampling synchronization. When trying to
implement synchronized sampling, two basic implementation requirements are considered: a) location of the signals to be sampled and b) source of the synchronization clock. Regarding the signal location, several options are possible: single three phase circuit, circuits in the same substation, circuits in the adjacent substations, or any circuits system-wide. In this case the three phase circuit consists of three currents and three voltage signals. As a source of synchronization, two types of sampling synchronization clocks may be used, namely the local (relative) and system-wide (absolute). The local clock may be derived from the data acquisition system and may be used to strobe the sample and hold (S/H) circuits located on each signal that is being sampled. If the sampling synchronization is to be performed on a wider basis than just the single three-phase circuit, than a more effective way of synchronizing the sampling is to use a reference clock that may be received from the Global Positioning System (GPS) of satellites. The GPS synchronization signal may be transferred to the data acquisition system located anywhere in the power system through a GPS receiver, which is a low cost device that may serve several data acquisition systems in a given substation. This is done through a special arrangement for the GPS clock distribution offered by some vendors [9].
3.1.2. Phasor synchronization. Many monitoring
applications in power systems are based on tracking the phasor measurements of currents and voltages. Phasor-based models of power systems are commonly used to perform load-flow, short-circuit, and stability studies. In order to track the phasors, quite often it is important to compare the phasors at different points in the system. This leads to a need to measure phasors synchronously across the power system, which is accomplished with commonly known Wide Area Measurement Systems (WAMS) implemented using Phasor Measurement Units (PMUs) [10].
3.2. Equipment switching status
While the measurements of analog signals are used by many power system applications, it is inherently assumed that measurements of the equipment switching status is also available since the analysis based on analog signals without knowing the system topology is not feasible in many instances.
3.2.1. Status of single circuit breaker. Many events in power systems, such as a fault, start on a single power system element i.e. a transmission line, transformer, generator, etc. As a result, protective relays, that are designed to disconnect the faulted power system components, will operate the corresponding CB to disconnect the faulted element. In such cases, knowing the status of the switching element during the switching sequence is a crucial part of the monitoring task.
3.2.2. Topology status. In many other applications,
the switching status of the entire power system needs to be know, which places a requirement for monitoring the network topology with very accurate time synchronization.
Table 2. Monitoring location and time synchronization
Synchronizatio n
Means Target
Local Clock three-phase circuit Samples
GPS clock Intra- and inter- substation Local Clock Adjacent
three-phase circuits Phasors
GPS clock Wide-area measurement
4. Monitoring of Circuit Breaker Status
System wide real-time monitoring of circuit breaker operation and statuses currently is implemented using RTUs of SCADA system. Based on detected voltage levels on circuit breaker contacts, these units are providing information on final status of the circuit breakers such as “OPEN” or “CLOSE”. The transitions in time of control signals, such as Trip or Close Initiate, X and Y coil currents, Control and Yard DC voltages, Closing Coil and others, used by protection and maintenance engineers for evaluation of CB performance cannot be monitored using RTU and SCADA approach. Table 3 lists the CB control circuit signals that an alternative approach, proposed in this paper, aims to monitor.4.1. Architecture
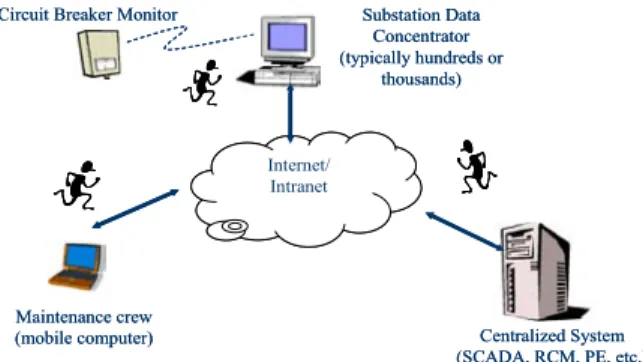
The proposed solution is based on a new CB Monitor (CBM) which would be permanently connected to the substation CBs [11]. CBM captures detailed information about each CB operation in real-time, regardless of whether the operation is initiated manually by the operator or automatically by the protection and control equipment and stores them in COMTRADE file format . As shown in Fig.1, the relevant CB control circuit signals are recorded and transmitted by wireless link to the concentrator PC, which automatically performs the analysis.
Table 3. Signals of circuit breaker control circuit monitored by CBMA
Group Signal name
Trip Initiate Close Initiate X Coil signal Digital signals Y Coil signal “A” Contact Contacts “B” Contact Control DC Voltage Yard DC Voltage DC Voltages Light Wire
Trip Coil (TC) Current 1 Trip Coil (TC) Current 2 Coil Currents
Closing Coil (CC) Current Phase Current A Phase Current B Phase Currents Phase Current C Internet/ Intranet Centralized System (SCADA, RCM, PE, etc.) Maintenance crew (mobile computer) Substation Data Concentrator (typically hundreds or thousands) Circuit Breaker Monitor
Internet/ Intranet
Centralized System (SCADA, RCM, PE, etc.) Maintenance crew (mobile computer) Substation Data Concentrator (typically hundreds or thousands) Circuit Breaker Monitor
Figure 1. CB monitoring system architecture
4.1.1. Multiple uses of CB Status. The CB status
information can be used at the local substation level as well as the system level. At the substation level, the monitored signals can provide information about the state of circuit breaker and whether it needs maintenance. At the system level, the status information can be used to verify network topology and make topology data more robust. As a result, different groups of utility staff may be involved in accessing the information and analyzing it, as suggested in Figure 1. In order to make the information accessible to a wide range of users, an automated system for analysis of data coming from the CB called Circuit Breaker Monitoring Analysis System. (CBMAS) has been developed. Such system uses Data Acquisition Unit (DAU) to collect data from various CBs. After the data is collected it is automatically processed to extract the information of interest, which is then distributed to various users.
4.1.2. Client Server Solution. The CBMA system
supports client/server architecture. The client part resides in substation. It consists of the DAUs attached to the CBs and software running on concentrator PC, both permanently installed in the substation, as shown in Figure 2.
When breaker operates, recorded files are wirelessly transmitted to the concentrator PC. The client application automatically performs the analysis of recorded signals. For more efficient data manipulation, IEEE file naming convention is used for naming the recordings files [12]. The signal processing module of the analysis software extracts various parameters from recorded signal samples and expert system evaluates them against empirically obtained values and tolerances selected for specific type of circuit breaker.
The resulting report describes detected abnormalities and possible causes of the problem. If discovered problem presents serious threat to the reliability of future circuit breaker operation, programmable notification is sent to the server located in the central office. The notification is then processed and a warning is sent via email or pager to the maintenance and protection personal. Reporting is provided for both local and geographically dislocated users through implementation of local database and web server supporting information exchange through dynamic HTML pages.
Recorded files and reports can be downloaded to the server via Ethernet network relying on standard, fast and reliable TCP/IP protocol. In the central office or control center, the server part of CBMAS consisting of the analysis module, a central database and master web server is running. The central database allows for easy archiving and retrieving of the records and analysis reports from all system substations. Master web application allows remote users to search for the records and/or analysis reports from anywhere on the corporate network (Intranet).
4.2. Hardware, software and communications
The system hardware in substation consists of DAUs located on each breaker in the switch yard and a concentrator PC, used for gathering data, placed in the control room.
4.2.1. DAU for CB monitoring. The data acquisition
unit (DAU) has three main tasks:
• Perform data acquisition of signals from the CB control circuit and record sequences of tripping and closing
• Convert captured signals into files according to COMTRADE file specifications [13]
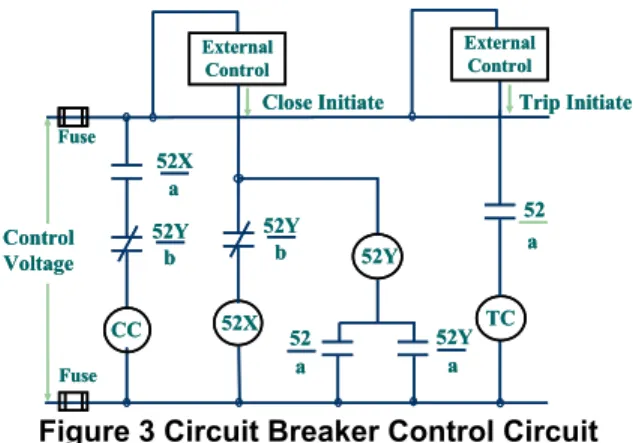
• Transmit files wirelessly to the concentrator device. 52Y 52X 52 52 52Y 52X 52Y CC TC Control Voltage a a b a a Close Initiate Fuse Fuse External Control Trip Initiate 52Y b External Control 52Y 52X 52 52 52Y 52X 52Y CC TC Control Voltage a a b a a Close Initiate Fuse Fuse External Control Trip Initiate 52Y b External Control
Figure 3 Circuit Breaker Control Circuit The DAU captures 15 electrical signals, listed earlier, from the circuit breaker control circuit shown in Figure 3. The signals are generated during either tripping or closing of the breaker. Of these 15 signals, 11 are analog and four are status signals. The system is shown in Figure 4. It consists of:
Signal conditioning. The signal conditioning boards provide conditioning, galvanic isolation and convert the signals to appropriate voltage levels for data acquisition. The voltage levels of signals at circuit breaker are either 130VDC or 1 VDC. The signal conditioning module scales the input signals to be in the [-5V, +5V] range as required at the input of the A/D converter module.
Analog to digital converter. The A/D converter takes the input from signal conditioning board and converts it to digital form. All signals are sampled synchronously to get accurate signal reproduction.
Microprocessor. A microprocessor is used for controlling the data acquisition and running the communication protocols.
Wireless Transmitter. A wireless transmission system, which employs commonly available Frequency Hopping Spread Spectrum technology, is capable of transmitting data to distances over 300m is used for transmitting the recorded data to the concentrator PC. Signal conditioning and galvanic isolation Data acquisition COMTRADE files Concentrator Circuit breaker Wireless data transfer Signal conditioning and galvanic isolation Data acquisition COMTRADE files COMTRADE files Concentrator Circuit breaker Wireless data transfer
4.2.2. Master-Slave data transfer
.
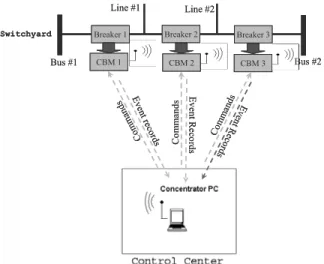
The master unit communicates with the slave units using a wireless link. When an event occurs, the slave unit records the electrical signals and upon completion of recording sends a request to master unit for accepting data. If the master unit is ready to accept data it sends a begin transfer message to slave. The slave then transmits the header, configuration and data files in COMTRADE format to the master. A protocol for data transfer is established and the receiving software is set up appropriately. The master unit receives the COMTRADE files and stores them in a database. Figure 5 shows the master-slave system diagram.C om m an ds Eve nt rec ords Com m an ds Ev en t R ec ord s Com man ds
Breaker 1 Breaker 2 Breaker 3
CBM 1 CBM 2 CBM 3 E ve nt R ec or ds Bus #1 Bus #2 Switchyard Line #1 Line #2 C om m an ds Eve nt rec ords Com m an ds Ev en t R ec ord s Com man ds
Breaker 1 Breaker 2 Breaker 3
CBM 1 CBM 2 CBM 3 E ve nt R ec or ds Bus #1 Bus #2 Switchyard Line #1 Line #2
Figure 5 Master-slave communication
5. Application benefits
The ability to closely monitor CB status has multiple benefits. They relate to different application functions that involve information about combined analog signal and contact status measurements where the status is either taken from a single CB or from the entire population of CBs in the network topology. To illustrate the benefits, two important applications, namely fault analysis and state estimation, are described next. In each case, due to a close monitoring of CBs, together with accurate measurements of analog signals, new implementation algorithms for the mentioned functions are feasible.
5.1. Fault Analysis
Fault analysis includes an accurate determination of fault clearing sequence, as well as calculation of the fault location. The applications are improved with better CB monitoring and better measurements of analog signals.
5.1.1. Sequence of events. One aspect of fault
analysis is to determine, as precisely as possible, a detailed sequence of events involved in a fault clearing sequence. This involves fault detection, fault classification, relay communication channel actions, relay trip decision, circuit breaker operation, interruption of fault currents, autoreclosing sequence, etc. An automated analysis of field recordings of currents and voltages, as well as contact statuses from circuit breakers and communication channels is possible if synchronous sampling of all the mentioned signals is performed across the substation [5]. This is typically available if all the signals are wired to a single instrument such as DFR. If recordings from Digital Protective Relays (DPRs) are used to implement the automated analysis, then there may be some difficulty in performing an automated analysis if some of the signals needed in the analysis come from multiple relays. The problem is the signal sampling synchronization, which would only be provided for the signals related to one relay but will not in general be available for the signals that involve multiple relays since the sampling synchronization across the relays is not readily available today.
The analysis capabilities coming from CB monitoring improvements are multiple. The existing analysis depends on the reliability of CB “a” and “b” contacts, while the new CB monitoring expands the number of signals to verify the opening and closing sequence for CB. In addition, the new monitoring scheme monitors CB currents allowing for confirmation of the final status of the CB by verifying the existence of the CB currents. Finally, if the signal sampling for CB monitoring is synchronized with the sampling of other signals available for other IEDs, a powerful correlation between signals coming from different IEDs observing the same event, such as DFRs, DPRs and CBMs, can be performed to enhance the analysis of the switching sequence [14].
5.1.2. Fault location. It is well known that fault
location can be quite accurate if phasors of voltages and currents area available from both ends of the transmission line, and if both phasor sets are synchronized [15]. What is not as widely known is that fault location can be significantly improved for two extreme cases of signals measurements: a) if the measurements at both transmission line ends (and all ends in the case of multi-terminal lines) are taken synchronously [16], and b) if phasor measurements are not available at both transmission line ends, but multiple sparse phasor measurements are available at several points in the power system network [6].
The CB monitoring approach explained in this paper significantly affects the second case. Since fault location in the second case can be treated as an optimization problem where the cost function is the minimum of the sum of the difference between the measured and simulated phasors, it is important to make sure that the measurements are taken for the same system topology used to perform the simulations. Having CB monitored across the network with a common signal sampling synchronization enables a common time reference for determining the network switching status that corresponds to the moment of the fault. Adding a common time reference for sampling synchronization allows determination of current phasors, which also needs to be available for an accurate comparison between the measured and simulated signals. Overall, the new CB monitoring has both properties and can be used as a source of field data for improved fault location.
5.2 State estimation
Improved CB monitoring can create benefits for two implementations of the state estimation algorithm, namely the topology processor part. In both cases, the ability to recognize exact state of CBs across the entire system or a substation is what makes the room for improvements.
5.2.1. Topology processor. The topology processor
for a state estimator has to be accurate in order for the estimator to produce reliable results. If the topology changes quickly due to a series of switching events, it may happen that the refresh rate of the analog measurements does not capture correctly the dynamic changes in the network topology. Besides, due to a switching event, the observability for the system may be violated since some of the measurements may be lost as certain parts of the substation circuit are disconnected.
The new CB monitoring system enables precise indication of the switching state of a CB. If signal sampling of all the CB DAUs are synchronized using GPS, it will be possible to determine the switching state of the entire network very accurately, which in turn would provide a state estimator with a topology processor that is indeed reliable. This feature is not presently available for any state estimator implementation, but can be easily added by performing the topology analysis at the substation level and uploading the information to the SCADA database [17].
5.2.2. Two-stage estimator. This approach requires a
the estimator indicates an error at a suspect substation. Since it is not easy to determine if the error is caused by a wrong topology or measurement, this approach allows expansion of the system model to include a precise topology of the substation [18]. By doing this a possible cause of error associated with the topology is eliminated and further analysis may be focused on the measurement errors.
Determining the substation topology and maintaining dynamic changes is a task that can significantly be improved through the new CB monitoring system. If signal sampling on all the CBM DAUs is synchronized through GPS receiver, than the topology analysis is much easier to perform.
6. Future needs
Based on the discussion of the real time approach for CB monitoring, changes in the present practice will be desirable. The changes bring significant benefits, the implementation requirements for the changes are rather simple and the involved cost is reasonable. Further discussion is focused on some of the immediate needs for the improvements that may be met by development of the new approach.
6.1. Change in measurement architecture
The architecture for making measurements of analog current and voltage signals, as well as digital contact statuses is quite inadequate today if one wants to make the improvements discussed in this paper. If one relies on SCADA to perform the measurements, the analog signals are scanned and reported by exception if the values of RMS exceed a threshold. The contact signals are also scanned and reported by exception where the entire conclusion about the CB status depends on how reliable the “a” and “b” contacts and related communications are. Further discussion indicates how the measurements may be improved through introduction of the CBMAS and an expansion of the measurement points through the use of other substation IEDs. The focus of the improvements are the introduction of synchronized sampling through the use of GPS receivers and the ability to correlate measurements from the Circuit Breaker Monitoring Analysis System (CBMAS) and a Wide Area Measurement System (WAMS) that uses Phasor Measurement Units (PMUs).
6.1.1. Synchronized sampling. While many different
techniques were used in the past to synchronize signal sampling across different IEDs, the prevailing method
in use today is to perform the synchronization using a reference time signal from the Global Positioning System (GPS) of satellites [19]. The systems that are designed to perform precise measurement of voltage phasors are the WAMS systems that rely on the use of PMUs. The problem that we are addressing in this paper, namely the topology determination in real time, does not seem to be related to the WAMS system when in fact a close correlation between the measurements from the two systems can indeed be beneficial. To make sure the correlation is meaningful, both systems need to be synchronized through a common or separate GPS receiver. The CBM system may be synchronized to GPS time reference signal by introducing a GPS synchronization input at the DAU level. Once the CBM system is GPS synchronized, further benefits of correlating changes in the voltage phasors detecting by the WAMS to the to the changes in the status signal and corresponding current signals detected by the CBM system can be explored.
6.1.2. Correlation between analog and status
measurements. One obvious benefit of the
correlation between the analog and CB status signals is an ability to precisely define the sequence of events related to fault clearing. This is not only improving the analysis of operation of a single breaker, but enables analysis of operation of multiple breakers, including the case when two breakers need to be operated to clear a fault on a transmission line terminating in a substation with a breaker and a half bus arrangement.
Another situation where the correlation helps is when a dynamic change in the substation topology needs to be verified using analog measurements. This can be significantly facilitated if both the CB contact changes and phasor changes are measured with a common time reference, which assures that a given measurement scan is “aligned” in time avoiding possible confusions about the sequence of events.
Some techniques for fault location mentioned earlier can also benefit from the alignment between the phasor and status measurements across the entire power system network. The measurements are used to match simulations in the system, which can be accomplished if all the measurements are taken using the same time reference.
6.2 Change in data processing
To achieve the correlation between the analog and status measurements across different measurement infrastructures, a new approach to data integration and information exchange is needed [8]. Further
discussion concentrates on the data integration at the substation level where the data from different IEDs is collected in a common database and process to extract the relevant information, which can be then shared among a variety of applications.
6.2.1. Data integration
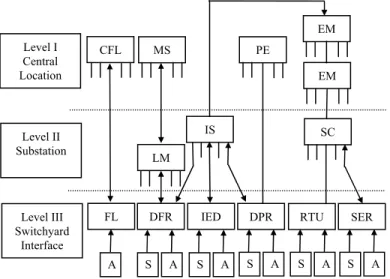
To perform data integration, one has to design a corresponding substation database which will be interfaced to different substation IEDs. The data base may reside on a separate substation PC or may be integrated in an expanded RTU. Creation of the database enables merger of the data coming from different infrastructures such as WAMS and CBM system. Through such integration, correlation between accurate measurements of phasors and CB contact statuses may be achieved. To illustrate this concept, Figure 6 and Figure 7 are showing an existing and future monitoring infrastructure respectively.
A- Analogue inputs S- Status (contact) inputs SC-substation computer MS-master station CFL-centralized fault loc. EM-energy management PE-protection engineer IS- integrated systems DFR-Digital fault recorder FL-Fault locator IED-Intelligent Electronic Device
RTU-Remote terminal unit SER-Sequence of events recorder DPR-Digital protective relay
Figure 6 Legacy infrastructure Level I Central Location Level II Substation Level III Switchyard Interface CFL MS PE EM LM IS SC
DFR IED DPR RTU SER
FL
A S A S A S A S A S A
DDR- Digital Disturbance Recorder
Note: The rest of the notation given in Fig. 6
Figure 7 Future infrastructure 6.2.2 Information exchange
Once the mentioned data integration infrastructure is available, it becomes straight forward to process the data to extract information of interest. As the information about local substation events is extracted, the next step is to share the information with the appropriate users, including EMS. This may be represented with the functional diagram shown in Figure
8. The information exchange concept allows
the information about substation topology to be exchanged among different applications that may reside at other substations or at the centralized level. The utility groups that may be interest in the topology status are, besides operations, protection, substation control, maintenance and planning.7. Conclusion
This paper outlines the approach to precise monitoring of power system topology, which leads to the following benefits, some of which have also been recognized by others [20,21]:
PLC-Programmable logic controller PQM-Power Quality Monitor CBM-Circuit Breaker Monitor
Note: The rest of the notation given in Fig. 6
Figure 8 Information Exchange Concept
• Sequence of fault clearing, including occurrence of a fault, reaction of relays,
transmission of relay blocking/tripping signals in a communication scheme, and opening of corresponding CBs can be analyzed with a great precision
• Fault location, for the cases when field measurements of transient signals caused by a fault are sparse, can significantly be improved when both the phasors and topology changes can be tracked in a correlated way
• Topology processor, used for the state estimation function, becomes much more reliable, and consequently the state estimator becomes more robust, when a precise determination of the CB status is available and synchronized with the analog measurements of the state
• State estimation, which is important for execution of many other EMS functions, can be implemented in a two stage process where the local substation topology is used to eliminate any suspect errors due to an imprecise topology assumption
• Other monitoring, control, protection, maintenance and planning applications can significantly be improved if analog signal measurements and corresponding topology changes are tracked with a GPS precision
DPRs PQM RTU SER PLCs Substation Database Information Exchange Applications and User Interfaces
CBM Email, Fax, Hosting,
WWW, Pager
Intranet, Internet
Wide-area networks (hubs, router, gateways)
System wide analysis System wide control Mobile Agent Server
Substation Analysis and
DDR IED RTU GPS DFR SER DPR
Substation Analysis and DDR IED RTU GPS DFR SER DPR COMTRADE IEC 61850
8. Acknowledgements
The reported research was coordinated by the Consortium for Electric Reliability Technology Solutions, and funded by the Office of Electric Transmission and Distribution, Transmission Reliability Program of the U.S. Department of Energy under Interagency Agreement No.DE-AI-99EE35075 with the National Science Foundation. The support for the project also comes from CenterPoint Energy in Houston, Texas and American Electric Power Service Corporation in Columbus, Ohio. The following graduate students and research staff at Texas A&M University have contributed to the development of the CBMS: N. Ved, Z. Ren, C. Nail, and G. Latisko.
9. References
[1] M. Kezunovic, T. Djokic, T. Kostic, C. Frei, “ Robust Topology Determination Based on Additional Substation Data from IEDs,” Power Tech 05’, St. Petersburg, Russia, June 2005.
[2] A. Abur, H. Kim, and M.K. Celik, "Identifying the unknown circuit breaker statuses in power networks," IEEE Trans. Power Systems, vol.10, no.4, pp. 2029-2037, Nov. 1995.
[3] M. Kezunović, Z. Ren, G. Latiško, D. R. Sevcik, J. Lucey, W. Cook, E. Koch, “Automated Monitoring and Analysis of Circuit Breaker Operation,” IEEE Transactions on Power Delivery, accepted for publication.
[4] M. Kezunović, T. Djokic, T. Kostic, “Automated Monitoring and Control Using New Data Integration Paradigm,” Hawaii Int’l. Conference on System Sciences, HICCS-38, Waikoloa, Hawaii, January 2005.
[5] M. Kezunovic, B. Lunsford, J. Lucy, D.R. Sevcik, M. Bruckner, T. Popovic, Automated Analysis Using IED-Recorded Data: Implementation and Integration,” Fault and Disturbance Analysis Conference, Atlanta, May 2005. [6] S. Luo, M. Kezunovic, D.R. Sevcik, “Locating Faults in the Transmission Network Using Sparse Field Measurements, Simulation Data and Genetic Algorithms,” Electric Power Systems Research, Vol. 71, No. 2, October 2004.
[7] N. Zhang, M. Kezunovic, “Improving Real-time Fault Analysis and validating Relay Operations to Prevent or Mitigate Cascading Blackouts,” IEEE T&D Conference, New Orleans, October 2005.
[8] M. Kezunović, A. Abur, A. Edris, D. Šobajić, “Data Integration/Exchange Part II: Future Technical and Business Opportunities,” IEEE Power & Energy Magazine, pp 24-29, May/June 2004.
[9] A. Phadke, M. Kezunović, B. Pickett, M. Adamiak, M. Begovic, G. Benmouyal, R. Burnett, Jr., T. Cease, J. Goossens, D. Hansen, L. Mankoff, P. McLaren, G. Michel, R. Murphy, J. Nordstrom, M. Sachdev, H. Smith, J. Thorp, M. Trotignon, T. Wang, M. Xavier, “Synchronized Sampling and Phasor Measurements for Relaying and
Control,” IEEE Transactions on Power Delivery, Vol. 9, No. 1, pp 442-452, January 1994.
[10]Macrodyne, inc. ,”Phasor measurement Unit-Model 1690,” Application/Performance Data Sheet, 1993
[11]M. Kezunović, N. A. Ved, “Circuit Breaker On-Line Monitoring Using Wireless Communications,” Wireless Technologies in the Power Industry, Toronto, Canada, May 2005.
[12]File Naming Convention for Time Sequence Data,
Final Report of IEEE Power System Relaying Committee Working Group H8, USA, 2001.
[13]EC Std. 60255-24, “Common format for transient data exchange (COMTRADE) for power systems”, First Edition 2001-05, International Electrotechnical Commission, 2001. [14]M. Kezunović, “Integrating Data and Sharing Information from Various IEDs to Improve Monitoring, Condition-Based Diagnostic, Maintenance, Asset Management, and Operation Tasks,” EPRI Substation Equipment Disturbance Conference, New Orleans, February 2004.
[15]M. Kezunović, B. Peruničić, “Fault Location,” Wiley Encyclopedia of Electrical and Electronics Terminology, Vol. 7, pp 276-285, John Wiley, 1999.
[16]A. Gopalakrishnan, M. Kezunović, S.M. McKenna, D.M. Hamai, “Fault Location Using Distributed Parameter Transmission Line Model,” IEEE Transactions on Power Delivery, Vol. 15, No. 4, pp 1169-1174, October 2000. [17]M. Kezunović, G. Latisko, N. Ved, “Real-Time Monitoring and Assessment of Circuit Breaker Operations for Diagnostics and Control Applications,” EPRI Substation Equipment Diagnostics Conference XIII, New Orleans, Louisiana, March, 2005.
[18]S. Zhong and A. Abur, "Implementation of a modified state estimator for topology error identification," in Proc. IEEE PES Annual Meeting, Toronto, Canada, July 2003. [19]R.E. Wilson, “Methods and Uses of precise Time in Power Systems,” IEEE Transactions on Power delivery, Vol. 7, No. 1, January 1992.
[20]S. Massoud Amin, B. F. Wollenberg, “Toward a Smart Grid”, IEEE Power&Energy, Vol. 3, No. 5, September, October 2005
[21]D.E. Allen. A. Apostolov, D. Kreiss, “Automated Analysis of Power System Events”, IEEE Power&Energy, Vol. 3, No. 5, September, October 2005
Mladen Kezunovic (S’77–M’80– SM’85–F’99) received the Dipl. Ing. Degree in electrical engineering from the University of Sarajevo,
Bosnia-Herzegovina, in 1974, and the M.S. and Ph.D. degrees in electrical engineering from the University of Kansas, Lawrence, in 1977 and 1980, respectively.
Currently, he is the Eugene E.Webb Professor and Director of Electric Power and Power Electronics Institute at Texas A&M University. His main research interests are digital simulators and simulation methods for relay testing as well as application of intelligent methods to power system monitoring, control, and protection. Dr. Kezunovic is also a Fellow of IEEE and a member of CIGRE-Paris.