LBNL-5803E
The Future of Utility
Customer-Funded Energy Efficiency Programs
in the United States: Projected
Spending and Savings to 2025
Galen L. Barbose, Charles A. Goldman, Ian M.
Hoffman, Megan Billingsley
Environmental Energy
Technologies Division
January 2013
This work was supported by the National Electricity Delivery Division of the U.S. Department of Energy’s Office of Electricity Delivery and Energy Reliability under Lawrence Berkeley National Laboratory Contract No. DE-AC02-05CH11231.
E
RNEST
O
RLANDO
L
AWRENCE
Disclaimer
This document was prepared as an account of work sponsored by the United States Government. While this document is believed to contain correct information, neither the United States Government nor any agency thereof, nor The Regents of the University of California, nor any of their employees, makes any warranty, express or implied, or assumes any legal responsibility for the accuracy, completeness, or usefulness of any information, apparatus, product, or process disclosed, or represents that its use would not infringe privately owned rights. Reference herein to any specific commercial product, process, or service by its trade name, trademark, manufacturer, or otherwise, does not necessarily constitute or imply its endorsement, recommendation, or favoring by the United States Government or any agency thereof, or The Regents of the University of California. The views and opinions of authors expressed herein do not necessarily state or reflect those of the United States Government or any agency thereof, or The Regents of the University of California.
Ernest Orlando Lawrence Berkeley National Laboratory is an equal opportunity employer.
LBNL-5803E
The Future of Utility Customer-Funded Energy Efficiency
Programs in the United States:
Projected Spending and Savings to 2025
Prepared for the
Office of Electricity Delivery and Energy Reliability National Electricity Delivery Division
U.S. Department of Energy
Principal Authors
Galen L. Barbose, Charles A. Goldman, Ian M. Hoffman, Megan Billingsley
Ernest Orlando Lawrence Berkeley National Laboratory 1 Cyclotron Road, MS 90R4000
Berkeley CA 94720-8136
January 2013
The work described in this study was funded by the National Electricity Delivery Division of the U.S. Department of Energy’s Office of Electricity Delivery and Energy Reliability under
2
Acknowledgements
The work described in this study was funded by the National Electricity Delivery Division of the U.S. Department of Energy’s Office of Electricity Delivery and Energy Reliability under
Lawrence Berkeley National Laboratory Contract No. DE-AC02-05CH11231. We would particularly like to thank Larry Mansueti of the U.S. Department of Energy for his support of this work. For providing comments on an earlier draft and/or providing information that was used in the analysis, the authors would like to thank Sheryl Carter (NRDC), Rich Sedano (RAP), Lara Ettenson (NRDC), Anthony Star (Illinois Commerce Commission), Brian Granahan
(Illinois Commerce Commission), Sam Gomberg (formerly with SACE), Jay Zarnikau (Frontier Associates), Amy Martin (Frontier Associates), Steve Schiller (Schiller & Associates), Hale Powell (Hale Powell Energy), Dian Grueneich (Dian Grueneich Consulting, LLC), Joe Bryson (EPA), David Walker (MI LARA), Howard Geller (SWEEP), Elizabeth Noll (AGA), Mariam Arnaout (AGA), Wayne Williams (Pennsylvania PUC), Chrissy Godfrey (MD PSC), Kara Rodgers (CEE), Mandy Mahoney (SEEA), Mike Ambrosio (Applied Energy Group), Cheryl Roberto (Ohio PUC), Tom Larson (SACE), John Wilson (SACE), Ken Smith (SACE), Jill Tauber (SACE), Shawn Carraher (La Capra Associates), Josh Craft (NEEP), Jim O'Reilly (NEEP), Tom Eckman (NPCC), Jeff Harris (NEEA), Greg Ehrendreich (MEEA), Marcus Preston (NiSource), Jeff Schlegel (SWEEP), Holly Meyer (NW Natural Gas), Bill Edmonds (NW Natural Gas), Teri Van Sumeren (Consumers Energy), Steve Bateson (Questar Gas). We also thank Anthony Ma for assistance with formatting and production. Of course, any
3
Table of Contents
Abstract ... 5
1. Introduction ... 6
2. Recent Policy Developments and Trends ... 7
2.1. Policy Drivers for Utility Customer-Funded Energy Efficiency Programs ... 8
2.2. Current and Historical Spending on Utility Customer-Funded Energy Efficiency Programs ... 10
3. Analytical Approach ... 12
3.1. Electric Energy Efficiency Program Spending and Savings Projections ... 12
3.2. Gas Energy Efficiency Program Spending Projections ... 15
4. Results ... 17
4.1. Combined Electric and Gas Energy Efficiency Program Spending Projections ... 17
4.2. Electric Energy Efficiency Program Spending Projections ... 18
4.3. Electric Energy Efficiency Program Savings Projections ... 21
4.4. Gas Energy Efficiency Program Spending Projections ... 23
5. Discussion of Key Issues and Uncertainties ... 25
5.1. Broader Market and Policy Context ... 25
5.2. Energy Efficiency Program Implementation and Regulatory Oversight ... 27
6. Conclusions ... 30
7. References ... 31
Technical Appendix A: Methodology and Assumptions Used to Develop Energy Efficiency Spending and Savings Projections ... 33
4
List of Figures and Tables
Figure 1. Projected Electric and Gas Energy Efficiency Program Spending ... 18
Figure 2. Policy Drivers for Projected Electric Energy Efficiency Spending in the Medium Case (2025) ... 19
Figure 3. Projected Electric Energy Efficiency Spending by Census Region ... 20
Figure 4. Regional Distribution of Electric Energy Efficiency Program Spending (Medium Case) ... 21
Figure 5. Electric Energy Efficiency Program Spending as a Percent of Utility Revenues (Medium Case) ... 21
Figure 6. Projected Electricity Savings from Utility Customer-Funded Efficiency Programs ... 22
Figure 7. Projected Gas Energy Efficiency Program Spending ... 24
Figure 8. Projected Gas Energy Efficiency Program Spending as a Percentage of Gas Distribution Utility Revenues ... 24
Figure A - 1. U.S. Census Regions Used for Scenario Development ... 36
Figure A - 2. Generic Program Cost Function ... 43
Table 1: Policy Drivers for Customer-Funded Energy Efficiency Program Activity ... 9
Table 2. 2010 Expenditures for Utility Customer-Funded Energy Efficiency (EE) Programs .... 11
Table 3. Scenario Assumptions for Electric Energy Efficiency Projections ... 14
Table 4. Scenario Assumptions for Gas Energy Efficiency Projections ... 15
Table 5. Projected Electric Energy Efficiency Spending ... 19
Table 6. Projected Incremental Annual Electricity Savings from Utility Customer-Funded Programs (TWh) ... 22
Table A - 1. AEO Projected Growth Rates in Retail Electricity Sales and Prices ... 34
Table A - 2. Estimate Customer-Funded Energy Efficiency Program Savings Embedded in AEO Forecasts by EMM Region ... 35
Table A - 3. Scenario Descriptions for States in the Northeast ... 36
Table A - 4. Scenario Descriptions for States in the South ... 38
Table A - 5. Scenario Descriptions for States in the Midwest ... 39
Table A - 6. Scenario Descriptions for States in the West ... 40
Table A - 7. Energy Efficiency Spending Assumed for “Uncommitted” States ... 42
Table A - 8. Analysis Framework for Natural Gas Energy Efficiency Programs ... 44
Table A - 9. Gas Energy Efficiency Program Scenario Descriptions: Tier I States ... 45
Table A - 10. Gas Energy Efficiency Program Spending: Tier II States ... 47
Table B - 1. Electric Efficiency Program Spending Projections by State ($M, nominal) ... 49
Table B - 2. Electric Efficiency Program Savings Projections by State (First-Year GWh) ... 50
5
Abstract
We develop projections of future spending on, and savings from, energy efficiency programs funded by electric and gas utility customers in the United States, under three scenarios through 2025. Our analysis, which updates a previous LBNL study, relies on detailed bottom-up modeling of current state energy efficiency policies, regulatory decisions, and demand-side management and utility resource plans. The three scenarios are intended to represent a range of potential outcomes under the current policy environment (i.e., without considering possible major new policy developments).
Key findings from the analysis are as follows:
• By 2025, spending on electric and gas efficiency programs (excluding load management
programs) is projected to double from 2010 levels to $9.5 billion in the medium case, compared to $15.6 billion in the high case and $6.5 billion in the low case.
• Compliance with statewide legislative or regulatory savings or spending targets is the
primary driver for the increase in electric program spending through 2025, though a significant share of the increase is also driven by utility DSM planning activity and integrated resource planning.
• Our analysis suggests that electric efficiency program spending may approach a more
even geographic distribution over time in terms of absolute dollars spent, with the Northeastern and Western states declining from over 70% of total U.S. spending in 2010 to slightly more than 50% in 2025, and the South and Midwest splitting the remainder roughly evenly.
• Under our medium case scenario, annual incremental savings from customer-funded
electric energy efficiency programs increase from 18.4 TWh in 2010 in the U.S. (which is about 0.5% of electric utility retail sales) to 28.8 TWh in 2025 (0.8% of retail sales).
• These savings would offset the majority of load growth in the Energy Information
Administration’s most recent reference case forecast of retail electricity sales through 2025, given specific assumptions about the extent to which future energy efficiency program savings are captured in that forecast.
• The pathway that customer-funded efficiency programs ultimately take will depend on a
series of key challenges and uncertainties associated both with the broader market and policy context and with the implementation and regulatory oversight of the energy efficiency programs themselves.
6
1.
Introduction
Electric and natural gas energy efficiency in the United States is pursued through a diverse mix of policies and programmatic efforts, which support and supplement private investments by individuals and businesses. These efforts include federal and state minimum efficiency standards for electric and gas end-use products; state building energy codes; a national efficiency labeling program (ENERGY STAR®); tax credits; and a broad array of largely incentive-based programs for consumers, funded primarily by electric and natural gas utility
customers (Dixon et al. 2010).1 Over the past four decades, policy support and utility customer
funding of energy efficiency programs, in particular, has ebbed and flowed.2 Utilities first
launched substantial programs in the wake of the 1973 energy crisis, and those programs grew and matured with the expansion of integrated resource planning and demand-side management during the 1980s and 1990s (Nadel 1992). Spending on energy efficiency by utilities then declined sharply in many states in the late 1990s, with the restructuring of the electricity
industry. However, the western energy crisis of 2000-2001 brought renewed attention to energy efficiency as an important strategy for managing and containing costs for electric utility
customers.3
Since then, many state regulatory agencies and legislatures have sought to prioritize energy efficiency, in some cases strengthening and supplementing pre-existing policies by requiring comprehensive electric and gas system resource planning, developing funding mechanisms and energy savings targets, and creating business incentives for program administrators to deliver energy efficiency to customers. In some states, regulators have also extended demand-side planning, savings targets, or business incentive mechanisms from the electricity sector to large regulated natural gas utilities.
A variety of organizations and analysts have examined trends in utility customer-funded energy efficiency programs in the United States. These include efforts to document historical and recent trends in spending, savings or both (Nadel 1992; Sciortino et al. 2011; Cooper and Wood 2012; CEE 2012), as well as estimates of the projected impact of individual policies related to utility customer-funded energy efficiency (Nowak et al. 2011) or in particular regions (Hopper et al. 2008). Yet other studies have sought to estimate the potential savings that could be obtained through customer-funded efficiency programs, including an innumerable number of such studies conducted for individual utilities or states, as well as several national studies (EPRI 2009). The present study builds upon the body of existing literature by comprehensively
assessing the potential impact of the full suite of policies and market conditions relevant to the future of utility customer-funded energy efficiency programs in the United States, updating an earlier LBNL analysis (Barbose et al. 2009).
1
The American Recovery and Reinvestment Act (ARRA) provided a massive but temporary infusion of federal funding for energy efficiency (~$15-20B in programs administered by federal, state and local governments to be spent over three years) (Goldman et al. 2011).
2
Geller et al. (2006) provide an overview of the efficiency policy landscape among nations in the Organization of Economic Cooperation and Development, including the U.S., while Gillingham et al. (2006) provide a
comprehensive review for the United States.
3
Energy efficiency programs administered by U.S. gas distribution utilities have also increased over time but are much smaller in size than electric efficiency programs (York et al. 2012).
7
Specifically, we project futurespending on, and savings from, U.S. electric and gas efficiency
programs to 2025 under low, medium, and high scenarios. The projections are based on a detailed, bottom-up review and modeling of all relevant state policies and legislation, regulatory decisions, and utility integrated resource and demand-side management plans. The three
scenarios are intended to represent a range of potential outcomes under the current policy
environment, given uncertainties in policy implementation and in the broader economic and policy environment (e.g., utility business models, the extent to which energy efficiency is a policy priority, and concerns about rate impacts). The three scenarios are not intended to encompass major new federal policy developments, which could naturally expand the range of
potential outcomes beyond those modeled here.4 Scenario definitions and assumptions were
also informed by interviews with regional and national energy efficiency experts, program administrators, regulatory staff and other industry stakeholders. Based on the quantitative analysis of projected spending and savings under varying policy implementation scenarios, we identify and discuss the broader themes and issues that will influence which of the potential projections are most likely to transpire.
The study has relevance to a broad range of audiences: utilities and other entities responsible for administering customer-funded efficiency programs and the state regulatory agencies
responsible for overseeing their implementation; policymakers, planners, and industry analysts seeking to understand the potential impact of these programs on the broader electricity market or their implications for other policies; and the energy services industry seeking to understand market trends and opportunities. While this study focuses on the United States, the analysis also has relevance to policymakers abroad where energy and environmental policies may require the development of specific long-term energy savings goals and/or funding mechanisms for
voluntary incentive-based programs, such as those that are prevalent in the United States. For example, the set of potential trajectories of U.S. efforts potentially offers a window on the prospects and issues raised by the 2012 European Union Energy Efficiency Directive (Directive 2012/27/EU), in which the European Parliament and Council committed member states to adopting efficiency targets and submitting implementation plans consistent with a EU-wide target of saving 20% of the projected primary energy consumption in 2020 (Boonekamp 2011).
The remainder of the paper is organized as follows. Section 2 provides an overview of the key policy drivers that influence future efficiency program spending and savings, and summarizes current trends in spending on energy efficiency programs across states. Our modeling approach for capturing policy and market influences on future spending and savings for electric and gas efficiency programs is described in Section 3. The results of our analysis are presented in Section 4. In Section 5, we identify key challenges and discuss significant uncertainties in market and policy drivers that may influence the path forward for customer-funded efficiency programs.
2.
Recent Policy Developments and Trends
4
By virtue of limiting the analysis to current energy efficiency policies, we do not consider the potential impact of major new federal (or state) policy initiatives (e.g., a national energy efficiency resource standard, clean energy standard, or carbon policy) that could result in customer-funded energy efficiency program spending and savings that exceed the values in our High Case.
8
Over the past decade, an increasing number of states have adopted policies that encourage or require utility customer-funded energy efficiency programs. In this section, we summarize recent trends in the development of these policies and the current and historical spending levels across states.
2.1. Policy Drivers for Utility Customer-Funded Energy Efficiency Programs
In the utility sector, policies that drive investment in energy efficiency include: system benefit charges; energy efficiency resource standards; renewable portfolio standards under which energy efficiency is a qualifying resource; requirements that utilities obtain “all cost-effective energy efficiency” resources; long-term integrated resource planning requirements; and multi-year demand-side management planning requirements (see Table 1). Naturally, the scope and level of aggressiveness of each type of policy can vary substantially across states, and many states have adopted multiple policies in tandem.
A number of these policy drivers are relatively recent, most notably energy efficiency resource standards (EERS), which have thus far been adopted in 15 states and require utilities to achieve
minimum energy efficiency savings targets over a lengthy period of time.5 Similarly, several
others states have adopted broader renewable portfolio standards (RPS) or alternative energy standards under which energy efficiency is a qualifying resource. Many of these EERS policies and RPS policies with energy efficiency allowances have been enacted in states that previously had not aggressively pursued customer-funded energy efficiency and have therefore required rapid development of the regulatory and administrative structures necessary to implement and oversee sizable energy efficiency program portfolios. Another recent policy development in a number of states, all of which have offered large-scale energy efficiency programs for more than a decade, is the development of statutory or regulatory requirements that utilities acquire “all cost effective” energy efficiency. In these states, program administrators or regulatory staff may then conduct studies that estimate the long-term, cost-effective savings potential and then
propose annual or multi-year savings targets and budgets in order to capture this potential over a defined time period.
Other facets of the energy efficiency policy landscape are less recent. System benefit charges (SBC), which exist in 14 states and were typically established more than a decade ago as part of larger electric industry restructuring processes, serve to set an approximate floor on energy efficiency program spending via a non-bypassable surcharge on customers’ utility bills. Integrated resource planning (IRP) also exists in many states, whereby utilities are required to plan for the long-term needs of their customers by considering and assessing a broad range of resource options, including energy efficiency resources. Depending upon the manner and extent to which utilities are required to assess energy efficiency options, the IRP may culminate in a
5
In this study, we define Energy Efficiency Resource or Portfolio Standards as requirements under statute or regulatory order that some or all utilities within a state (e.g., all utilities or investor-owned utilities only) achieve specified minimum savings levels over a period greater than three years. States with shorter term DSM plans (i.e. one to three years) and/or multi-year efficiency budgets approved by state regulators are separately listed. Note that other entities (e.g., ACEEE) that track the status of energy efficiency policies in various states may use slightly different criteria for defining an EERS than LBNL; thus their tallies of the number of states with such policies may differ.
9
10- to 20-year plan with specified levels of energy efficiency resource acquisition. Finally, utilities in many states are required to regularly submit a demand-side management (DSM) plan to their state regulator, proposing a specific portfolio of programs that meet cost-effectiveness guidelines and other policy objectives, typically on a one- to three-year cycle.
Although IRP and DSM planning have both been utilized for more than 20 years, their application has expanded somewhat in recent years as a result of policy spill-over or cross-border effects from other states within a given region. For example, Arkansas regulators
developed a step-by-step energy efficiency program development template that has been cited as
a policy influence in other southern states (e.g., Mississippi and Alabama).6 Multi-state utilities
also are developing territory-wide efficiency programs designed to meet one state’s mandates, in
effect carrying that state’s energy saving policies de facto into neighboring states.7 Lastly, the
move by the Tennessee Valley Authority (TVA)8 to set savings targets through its IRP, and to
offer programs and encourage its member distributors to offer programs, is expected to spread the pursuit of energy efficiency across the seven states where it provides wholesale power.
Table 1: Policy Drivers for Customer-Funded Energy Efficiency Program Activity
Key Policy Drivers for Energy Efficiency Spending and Savings
Applicable to Electric Efficiency Programs
Applicable to Natural Gas Efficiency Programs
Energy Efficiency Resource Standard (EERS)
AZ, CA, CO, HI, IL, IN, MD, MI, MN, MO, NM, NY, OH, PA, TX
CA, CO, MI, MN, NY, IL
Energy efficiency eligibility under state RPS
HI, MI, NC, NV, OH Statutory requirement that utilities acquire
all cost-effective energy efficiency
CA, CT, MA, RI, VT, WA CA, CT, MA, RI, VT, WA
Systems benefit charges CA9 CA, DC, ME, MT, NJ, NY,
RI,WI , CT, DC, MA, ME, MT, NH,
NJ, NY, OH, OR, RI, VT, WI Integrated resource planning 34 States (primarily in the West and
Southeast) and TVA
17 States (primarily in the West and Northeast) Demand Side Management plan or
multi-year energy efficiency budget
28 States 21 States (primarily in the Northeast and Midwest)
In addition to the energy efficiency policy drivers summarized in Table 1, other broad market and policy dynamics may also play a critical role in shaping the trajectory of future spending and
6
In Arkansas, the process began with a collaborative among regulators, utilities and other stakeholders, then proceeded to “quick start” programs designed to test the viability of utility customer-funded programs in that jurisdiction and begin building program infrastructure. In the final step, regulators set modest but increasing savings targets.
7
For example, Duke Energy Carolinas and Progress Energy Carolinas are subject to an RPS in North Carolina in which energy efficiency is an eligible resource, and both submitted a pro rata version of the same efficiency plan from North Carolina for the rest of their service territory in South Carolina. Likewise, West Virginia’s requirement that an American Electric Power subsidiary initiate efficiency programs resulted in submission of similar program plans in neighboring Virginia.
8
The Tennessee Valley Authority (TVA) is the largest U.S. public power utility and serves 155 distributors and 57 industrial customers in TN, KY, AL, MS, GA, NC and VA.
9
The systems benefit charge in California expired at the end of 2011, although legislative efforts are underway to renew it.
10
savings from customer-funded energy efficiency programs. We discuss several of these factors in Section 5.1, including the timing and pace of the economic recovery, the long-term trend in natural gas prices, the stringency of future federal and state minimum efficiency standards for appliances and building codes, and the outcome of federal air emissions regulations.
2.2. Current and Historical Spending on Utility Customer-Funded Energy Efficiency Programs
Over the latter half of the past decade, spending on electric and gas utility customer-funded
energy efficiency programs (excluding load management)10
Table 2
more than doubled, from roughly $2 billion in 2006 to $4.8 billion in 2010, consisting of $3.9 billion for electric energy efficiency programs and $0.8 billion for natural gas programs (CEE 2008; CEE 2012). Approved budgets for 2011 – which may diverge from actual expenditures – were significantly higher than 2010 spending, totaling $6.7 billion, consisting of roughly $5.6 billion for electric efficiency
programs and $1.2 billion for gas efficiency programs (CEE 2012). With the steady increase in spending on utility customer-funded efficiency programs in recent years, relative spending as a percentage of utility revenues has also risen, with electric program expenditures in 2010
equivalent to roughly 1.1% of total U.S. electric utility revenues in that year, while gas program expenditures were equivalent to roughly 0.7% of total U.S. gas distribution utility revenues. The geographical distribution of both electric and gas spending has spread over time, as numerous states with recently adopted policies have ramped up their efforts. That said, total spending on utility customer-funded energy efficiency programs, in absolute dollar terms, still
remains highly concentrated within a relatively small number of states (see ).11
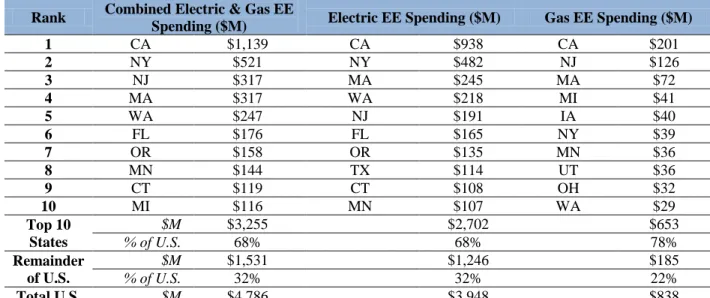
In particular, the majority of funding for electric efficiency programs is concentrated in California, the Pacific Northwest (OR, WA), and the Northeast (MA, NJ, NY, CT), all states with a long history of commitment to energy efficiency. Other states, many located in the Midwest (e.g., OH, PA, IL, IN, and MI), are in the process of ramping up program spending, often driven by long-term electricity savings targets. The top 10 states, in terms of absolute dollar expenditures account for about 70% of 2010 spending on electric energy efficiency programs. Program administrators in the leading states with the highest per capita energy
efficiency spending typically offer a comprehensive portfolio of programs tailored to residential, commercial, and industrial customers that utilize a variety of designs and intervention strategies (e.g., technical assistance to end users and trade allies, incentives to customers to buy down the cost of high-efficiency equipment, and incentives to upstream manufacturers and retailers to stock and distribute high-efficiency products).
Gas efficiency programs are less widespread than electric programs, and thus funding is even more highly concentrated in a small number of states, where the top-10 states account for almost 80% of the national budget for gas efficiency programs. Specifically, gas efficiency spending is
10
Electric utility expenditures on load management programs in 2010 represented an additional $0.9 billion (CEE 2012).
11
Metrics based on total budget for energy efficiency tend to favor states with large populations. It is important to note that program administrators in several small states (e.g. VT, RI, and IA) have significant energy efficiency budgets, if metrics are based on efficiency spending per capita. In the U.S., the 10 leading states spend more than $25 per capita on utility customer-funded electric efficiency programs, while the average spending on these programs among the 50 states is about $12 per capita.
11
concentrated in about a dozen states in various regions: NY, MA, and NJ in the Northeast; IL, MI, IA, MN and WI in the Midwest; and CA, OR and UT in the West. Most southern utilities have modest retail gas sales or function largely as distribution entities that convey
“transportation gas”,12 and they consequently spend little on gas efficiency programs.
Nationally, gas efficiency program budgets are dominated by residential and low income
programs, together comprising 68% of total program expenditures in 2010 (CEE 2012), which is
quite different from the program mix for electric efficiency programs.13
Table 2. 2010 Expenditures for Utility Customer-Funded Energy Efficiency (EE) Programs
Rank Combined Electric & Gas EE
Spending ($M) Electric EE Spending ($M) Gas EE Spending ($M)
1 CA $1,139 CA $938 CA $201 2 NY $521 NY $482 NJ $126 3 NJ $317 MA $245 MA $72 4 MA $317 WA $218 MI $41 5 WA $247 NJ $191 IA $40 6 FL $176 FL $165 NY $39 7 OR $158 OR $135 MN $36 8 MN $144 TX $114 UT $36 9 CT $119 CT $108 OH $32 10 MI $116 MN $107 WA $29 Top 10 States $M $3,255 $2,702 $653 % of U.S. 68% 68% 78% Remainder of U.S. $M $1,531 $1,246 $185 % of U.S. 32% 32% 22% Total U.S. $M $4,786 $3,948 $838
Source: CEE (2012), with several modifications
12
See approach section on modeling of gas programs for more details.
13
On a national basis, electric energy efficiency spending in 2010 was allocated among market sectors as follows: commercial and industrial (47%), residential (28%), low-income residential (8%) and other programs or
12
3.
Analytical Approach
We developed low, medium, and high case projections of electric and natural gas efficiency program spending to 2025, as well as accompanying projections of electric program energy
savings.14 These projections are based on a state-by-state review of current policies, regulatory
decisions, utility IRPs and DSM plans, and other key regulatory and planning documents, further supported through interviews with state PUC and utility staff and regional energy efficiency experts. The projections are intended to represent alternative pathways for the future
evolution of energy efficiency programs, given the current set of policies in place and the larger
market and policy environment in which programs operate. As explained further below, we took different approaches to developing projections for electric and gas energy efficiency program spending. These methodological differences reflect both that enabling efficiency policies are more prevalent among electric utilities compared to gas utilities, and that the level of
development and experience with administering electric efficiency programs is much greater than for gas programs.
3.1. Electric Energy Efficiency Program Spending and Savings Projections
The projections of electric program spending and savings are based primarily on state-specific assumptions about how effectively and aggressively current energy efficiency policies are implemented and about the impact of broader market conditions. The scenario assumptions are summarized by census region in Table 3. The projections for these states typically begin with assumptions about either future spending or savings (depending on the state and scenario), and then future spending or savings are derived from the other based on assumptions about the cost of savings. For a group of seven “uncommitted” states that currently have little efficiency program activity and no established policy framework, we instead employ a standardized approach by which spending increases above current levels by a stipulated amount under each
scenario, also described in Table 3.15 Additional methodological details, including state-by-state
descriptions of scenario definitions, are provided in Appendix A.
Although the scenario definitions were developed on a state-by-state basis, with consideration of the specific policy and market context in that state, the low, medium, and high scenarios can be characterized in broad terms. At a conceptual level, the low scenario represents a less prominent role for energy efficiency as a resource in many states, as program spending remains at current levels or increases very modestly (or decreases in a few states) in subsequent years. The medium scenario reflects a future in which states that historically have been leaders in energy efficiency continue down that path and in some cases expand the role of energy efficiency as a
14
In the context of this report, “spending” refers to the flow of money from the energy efficiency program
administrator into the market, including all program administration costs but excluding performance incentives. To the extent possible, electric spending projections are intended to reflect “gross” savings, prior to accounting for free-riders or free-drivers. This approach was taken in order to abstract from potential inconsistencies across states in methods for estimating net-to-gross ratios. However, the underlying data used to derive the cost of savings for some states were not explicit about whether savings are reported in “net” or “gross” terms; thus, some ambiguity exists in whether the spending projections for a number of states reflect net or gross savings. Gas efficiency program savings projections were not included for several reasons (e.g., relative paucity of mature, multi-year gas efficiency
programs from which to draw reliable data).
15
13
resource, while other states are fairly successful in ramping up their energy efficiency programs to meet legislative saving targets. Note that in the medium scenario, our estimates of future savings account for constraints that may limit the ability of program administrators to achieve savings targets – e.g., ability for energy efficiency services infrastructure to ramp up quickly in early years and rate or spending caps that limit program spending increases in later years. The high scenario reflects a future in which many states establish a very prominent role for energy efficiency as a resource: states with EERS statutes are assumed to meet savings targets (and overcome constraints), states in each region are inclined to follow the example (and goals) established by leading states in that region, and those states that are currently “uncommitted” are assumed to adopt policies that lead to savings in 2025 of roughly the national average savings targets achieved by utilities currently.
14
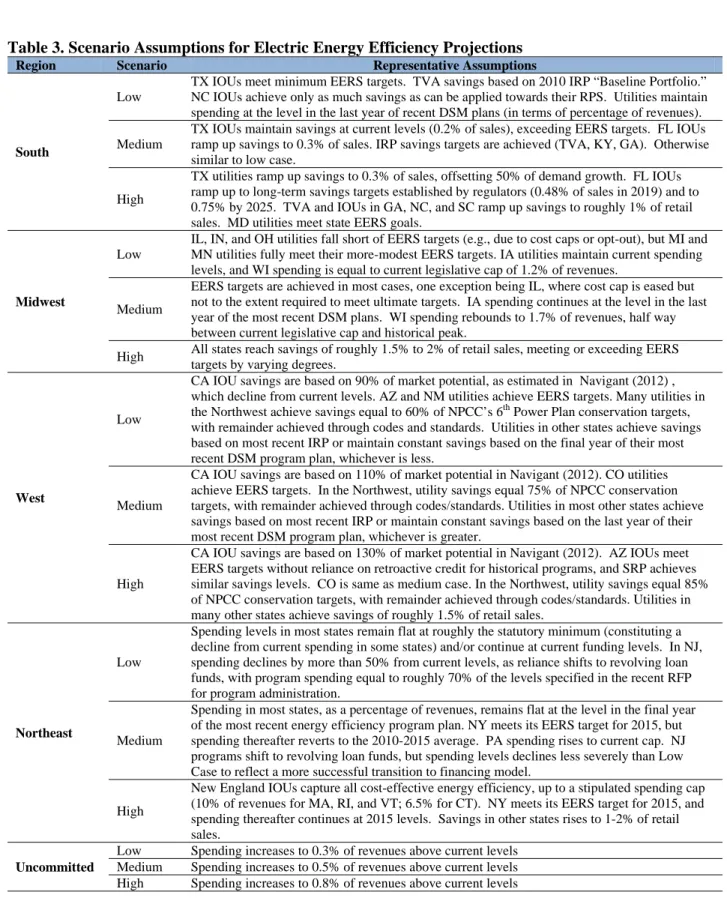
Table 3. Scenario Assumptions for Electric Energy Efficiency Projections
Region Scenario Representative Assumptions
South
Low
TX IOUs meet minimum EERS targets. TVA savings based on 2010 IRP “Baseline Portfolio.” NC IOUs achieve only as much savings as can be applied towards their RPS. Utilities maintain spending at the level in the last year of recent DSM plans (in terms of percentage of revenues). Medium
TX IOUs maintain savings at current levels (0.2% of sales), exceeding EERS targets. FL IOUs ramp up savings to 0.3% of sales. IRP savings targets are achieved (TVA, KY, GA). Otherwise similar to low case.
High
TX utilities ramp up savings to 0.3% of sales, offsetting 50% of demand growth. FL IOUs ramp up to long-term savings targets established by regulators (0.48% of sales in 2019) and to 0.75% by 2025. TVA and IOUs in GA, NC, and SC ramp up savings to roughly 1% of retail sales. MD utilities meet state EERS goals.
Midwest
Low
IL, IN, and OH utilities fall short of EERS targets (e.g., due to cost caps or opt-out), but MI and MN utilities fully meet their more-modest EERS targets. IA utilities maintain current spending levels, and WI spending is equal to current legislative cap of 1.2% of revenues.
Medium
EERS targets are achieved in most cases, one exception being IL, where cost cap is eased but not to the extent required to meet ultimate targets. IA spending continues at the level in the last year of the most recent DSM plans. WI spending rebounds to 1.7% of revenues, half way between current legislative cap and historical peak.
High All states reach savings of roughly 1.5% to 2% of retail sales, meeting or exceeding EERS targets by varying degrees.
West
Low
CA IOU savings are based on 90% of market potential, as estimated in Navigant (2012) , which decline from current levels. AZ and NM utilities achieve EERS targets. Many utilities in the Northwest achieve savings equal to 60% of NPCC’s 6th Power Plan conservation targets, with remainder achieved through codes and standards. Utilities in other states achieve savings based on most recent IRP or maintain constant savings based on the final year of their most recent DSM program plan, whichever is less.
Medium
CA IOU savings are based on 110% of market potential in Navigant (2012). CO utilities achieve EERS targets. In the Northwest, utility savings equal 75% of NPCC conservation targets, with remainder achieved through codes/standards. Utilities in most other states achieve savings based on most recent IRP or maintain constant savings based on the last year of their most recent DSM program plan, whichever is greater.
High
CA IOU savings are based on 130% of market potential in Navigant (2012). AZ IOUs meet EERS targets without reliance on retroactive credit for historical programs, and SRP achieves similar savings levels. CO is same as medium case. In the Northwest, utility savings equal 85% of NPCC conservation targets, with remainder achieved through codes/standards. Utilities in many other states achieve savings of roughly 1.5% of retail sales.
Northeast
Low
Spending levels in most states remain flat at roughly the statutory minimum (constituting a decline from current spending in some states) and/or continue at current funding levels. In NJ, spending declines by more than 50% from current levels, as reliance shifts to revolving loan funds, with program spending equal to roughly 70% of the levels specified in the recent RFP for program administration.
Medium
Spending in most states, as a percentage of revenues, remains flat at the level in the final year of the most recent energy efficiency program plan. NY meets its EERS target for 2015, but spending thereafter reverts to the 2010-2015 average. PA spending rises to current cap. NJ programs shift to revolving loan funds, but spending levels declines less severely than Low Case to reflect a more successful transition to financing model.
High
New England IOUs capture all cost-effective energy efficiency, up to a stipulated spending cap (10% of revenues for MA, RI, and VT; 6.5% for CT). NY meets its EERS target for 2015, and spending thereafter continues at 2015 levels. Savings in other states rises to 1-2% of retail sales.
Uncommitted
Low Spending increases to 0.3% of revenues above current levels Medium Spending increases to 0.5% of revenues above current levels High Spending increases to 0.8% of revenues above current levels
15
3.2. Gas Energy Efficiency Program Spending Projections
For the purpose of developing projections of utility customer funding of gas efficiency programs, we first grouped states into three categories: Tier I consists of the 13 states that comprise more than 80% of current national funding for gas efficiency programs, Tier II consists of another 15 states where 2010 spending on gas efficiency programs exceeded $0.50 per capita, and Tier III consists of the remaining 23 states. (See Technical Appendix A for the set of states included within each tier).
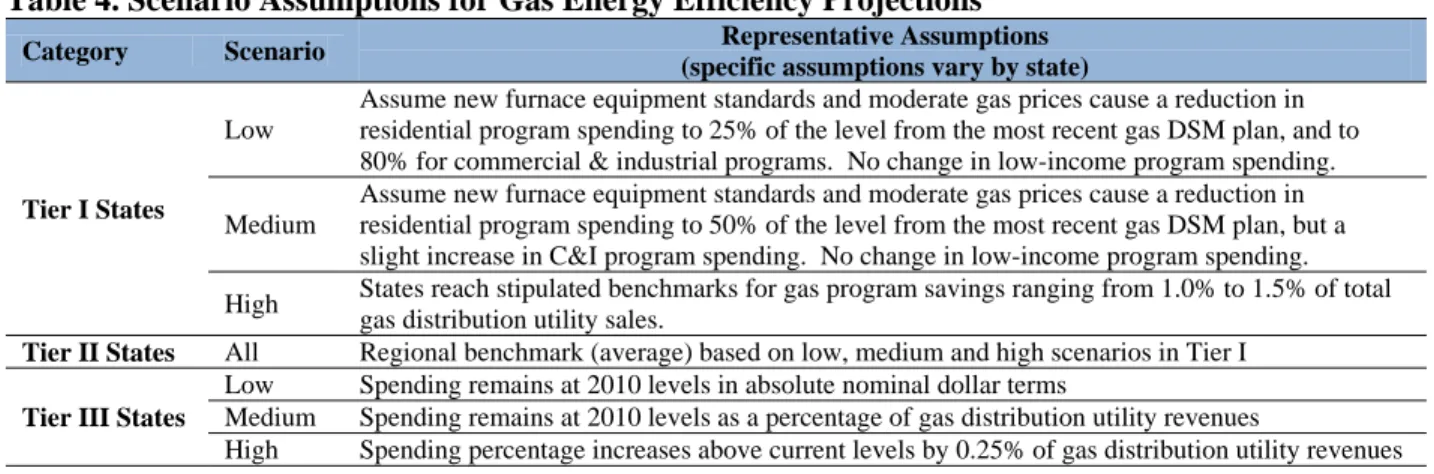
The process for developing scenario definitions for each state differed according to its tier (see Table 4). For Tier I states, gas efficiency program spending projections are based on state-specific policies, gas DSM program plans, and regulatory decisions that set savings targets for gas utilities, and were further informed by interviews with program administrators, regulators and other experts in the field. For most Tier I states, the low and medium case spending projections track the most recent multi-year gas DSM program plans to their terminal year (typically 2012 to 2014). In the low case, we assume that spending on residential gas efficiency programs in most Tier 1 states will decline to 25% of the level in the terminal year of the most recent DSM plan, while spending on commercial and industrial (C&I) programs will decline to roughly 80% of the level in the terminal year of the DSM plan. This decline in spending is due to the combination of sustained low natural gas prices, which reduce the cost effectiveness of gas efficiency programs, and tightening federal minimum efficiency standards for gas furnaces, which reduce the savings for voluntary programs – both of which are discussed further in Section 5. In the medium case, we assume a more modest drop-off in residential program spending, typically to 50% of the level from the terminal year of the most recent gas DSM Plan, but that C&I program spending increases slightly, as program managers shift budgets towards markets with greater savings opportunities. In both the low and medium scenario, we assume that spending on gas low-income programs remains constant at the level from the last year of the DSM plan, as these programs meet broader policy objectives (e.g. equity, reductions in bill arrearages) and therefore are less susceptible to the dynamics putting downward pressure on gas program spending for the other sectors. Finally, in the high case, we assume that many Tier I states achieve gas savings levels on par with the gas EERS targets recently adopted in several states (i.e., generally 1.0-1.5% of total gas distribution utility retail sales).
Table 4. Scenario Assumptions for Gas Energy Efficiency Projections
Category Scenario Representative Assumptions
(specific assumptions vary by state)
Tier I States
Low
Assume new furnace equipment standards and moderate gas prices cause a reduction in residential program spending to 25% of the level from the most recent gas DSM plan, and to 80% for commercial & industrial programs. No change in low-income program spending. Medium
Assume new furnace equipment standards and moderate gas prices cause a reduction in residential program spending to 50% of the level from the most recent gas DSM plan, but a slight increase in C&I program spending. No change in low-income program spending. High States reach stipulated benchmarks for gas program savings ranging from 1.0% to 1.5% of total
gas distribution utility sales.
Tier II States All Regional benchmark (average) based on low, medium and high scenarios in Tier I
Tier III States
Low Spending remains at 2010 levels in absolute nominal dollar terms
Medium Spending remains at 2010 levels as a percentage of gas distribution utility revenues
16
The 15 Tier II states have relatively aggressive spending levels on a per capita basis, but small populations and therefore small spending levels in absolute terms. Thus, for simplicity, the spending projections for these states were developed based on regional benchmark trajectories that were developed from the projections for Tier I states in the corresponding region. These regional benchmark trajectories were developed by averaging the change in spending as a percentage of gas distribution utility revenues per year by region for the Tier I states in each census region. Those growth curves were then applied to the 2010 spending for each Tier II state. As an example, in the medium case, spending for the three Tier I states in the Northeast (MA, NY, and NJ) is projected to increase by, on average, 0.6% of revenues; thus, the same 0.6% increase in spending as a percent of revenues was stipulated for the Tier II northeastern states in the medium case. For further details, please refer to Technical Appendix A.
For the remaining 23 Tier III states that currently have little or no customer-funded gas program activity, we assumed that future gas efficiency spending will, in the low case, remain at 2010 levels in absolute nominal dollar terms (thus declining as a percentage of gas distribution utility revenues, as revenues grow). In the medium case, we assume that program administrators maintain gas efficiency spending at their present level, in terms of the percentage of utility revenues. The high case posits that program administrators will increase program spending to approximately 0.25% of revenues above 2010 levels by 2025.
17
4.
Results
In this section, we present our projections of spending on utility customer-funded energy
efficiency programs through 2025. We first present total projected spending for electric and gas efficiency programs, combined, before turning to the projections for each fuel individually. We also present projections of electric energy savings associated with the three spending trajectories for electric efficiency programs and consider the potential significance of these savings
projections in relation to current expectations about future load growth in the electric sector.16
The results presented throughout this section focus primarily on national and regional trends; the corresponding state-level projections are provided in Technical Appendix B.
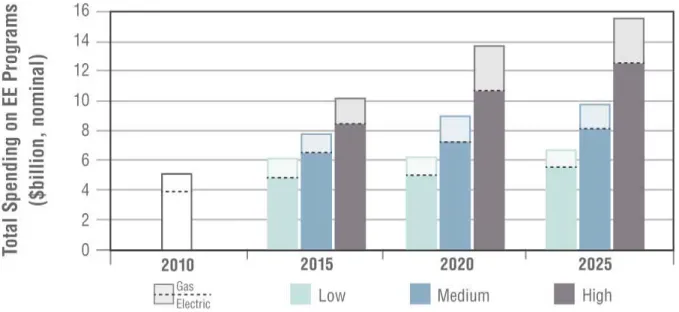
4.1. Combined Electric and Gas Energy Efficiency Program Spending Projections Total spending on electric and gas energy efficiency programs is expected to increase in all scenarios across the study period. By 2025, we project that total electric and gas efficiency program spending, in nominal dollars, will rise from $4.8 billion in 2010 to $6.5 billion in the low case, $9.5 billion in the medium case, and $15.6 billion in the high case (see Figure 1). These projections correspond to compound growth rates of approximately 2% per year (low case), 5% per year (medium case), and 8% per year (high case). Although the projected increase in spending in both the medium and high cases is sizable in absolute dollar terms, the associated growth rates in all cases are substantially lower than that witnessed over the past half-decade, when total electric and gas efficiency program rapidly accelerated at an average rate of 26% per year from 2006 to 2010 (Eldridge et al. 2008, CEE 2012). In the decade preceding this recent and rapid expansion of energy efficiency program activity, however, electric program spending grew by less than 5% per year from 1997 to 2006, which is on par with the projected growth in spending under the medium case.
As discussed further in the following sections, projected growth rates for electric efficiency program spending are somewhat higher than for gas program spending in both the low and medium cases, with projected electric program spending growth of 2.3% and 4.9% per year in the low and medium cases, versus less than 1.1% and 3.8% per year for gas programs. In the high case, however, gas efficiency spending grows faster than electric spending (9.7% vs. 7.8%). These differing trends reflect, in large part, the broader base of underlying policy support for, and historical experience with, electric efficiency programs, leading to stronger growth in the low and medium cases for electric programs, while leaving a large upside potential for growth in gas program spending under the high-case conditions.
16
We do not present projections of natural gas program savings, as insufficient data exists to link the projected spending amounts to specific savings trajectories.
18
Source: 2010 spending based on CEE (2012)
Figure 1. Projected Electric and Gas Energy Efficiency Program Spending
4.2. Electric Energy Efficiency Program Spending Projections
Spending on electric utility customer-funded energy efficiency programs is expected to increase, in nominal dollar terms, across all scenarios (see Table 5). Relative to 2010 spending of $3.9 billion (1.1% of total electric utility retail revenues), spending is expected to more than double to $8.1 billion by 2025 in the medium case (1.7% of revenues). In comparison, spending in the low case is projected to increase more slowly, reaching $5.5 billion by 2025 (1.1% of revenues). As described in Section 3, this slower pace of spending growth reflects a future scenario in which regulators and administrators “stay the course” at current funding levels, and many states with aggressive savings targets fall short of those goals. In the high case, spending more than triples from 2010 levels, reaching $12.2 billion (2.7% of revenues), due to the impact of “all cost effective efficiency” policies in leading states, successful achievement of EERS targets, and an increase in program savings in a number of states to the levels projected for regional peers. Importantly, the projected growth in electric program spending across all cases does not occur smoothly over the forecast period, but rather is “front-loaded”, with much faster growth projected through 2015 (Table 5). In the medium case, for example, spending grows by 11% per year through 2015 but by only 2% per year from 2020 to 2025. This dynamic is partly due to the fact that, in many states, recent multi-year DSM plans entail significant spending
increases over the next several years, but no longer-term targets or resource planning process currently exists to guide program activity beyond the time horizon of the DSM plan. The front-loaded spending projections also reflect the trajectory of EERS schedules, which typically reach their terminal targets by 2020 or sooner. From 2020 onward, we assume that spending growth in many states tapers off and grows roughly in proportion with projected revenues, reflecting both a lack of strong policy drivers for continued spending growth after 2020, as well as the assumption that savings potential within the 2020-2025 period will be diminished due to the
19
success of programs implemented over the prior decade and tightening federal efficiency standards.
Table 5. Projected Electric Energy Efficiency Spending Scenario
Projected Spending ($B, nominal)
Projected Spending
(% of Revenues) Average Annual Spending Growth
2015 2020 2025 2015 2020 2025 2010-2015 2015-2020 2020-2025
Low 4.8 5.2 5.5 1.2% 1.2% 1.1% 4% 2% 1% Medium 6.5 7.4 8.1 1.7% 1.8% 1.7% 11% 3% 2% High 8.3 10.8 12.2 2.2% 2.6% 2.7% 16% 5% 3%
Not surprisingly, total U.S. electric program spending across all scenarios are driven, in large measure, by EERS policies, energy efficiency eligibility under RPS policies and legislative mandates requiring utilities to acquire all cost-effective energy efficiency. In the medium case, for example, the 15 states with an electric EERS, plus the additional five states with legislative “all cost-effective energy efficiency” mandates (and no associated EERS) and the two states that qualify energy efficiency as an eligible resource under a renewable portfolio standard (again, without an associated EERS) together account for 72% of the total projected electric efficiency program spending in the U.S. in 2025 (see Figure 2). The remaining spending is associated primarily with the additional 18 states that rely primarily on DSM planning and/or IRP (without an associated EERS or “all cost-effective energy efficiency” mandate) to establish their electric efficiency budgets and targets, together comprising 28% of total projected spending on electric efficiency programs.
Figure 2. Policy Drivers for Projected Electric Energy Efficiency Spending in the Medium Case (2025)
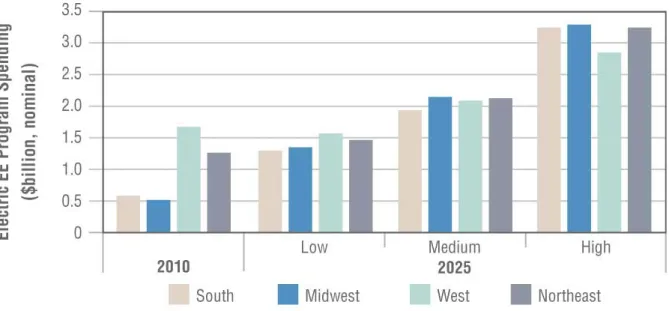
Projected trends in total U.S. spending are, to some extent, an overlay of distinct quasi-regional trends (see Figure 3). In the medium scenario, overall growth of national efficiency program spending is driven chiefly by projected growth in the Midwest and South, which together represent 70% of projected total U.S. electric program spending growth over the 2010-2025 period. In the Midwest, spending growth is associated with a contingent of populous states (IL, IN, MI, OH) that are currently ramping up to meet statutory EERS targets, while in the South,
20
increases in efficiency program spending are associated with a collection of relatively modest EERS policies and nascent IRP/DSM planning processes in states with a large base of energy consumption (TX, FL, NC, MD, KY). The same underlying policy drivers propel spending growth in these two regions in the low and high scenarios as well, though to differing degrees. In the West and Northeast – the traditional bastions of energy efficiency activity – electric program spending is also projected to increase in the medium case, though by lesser amounts than the other two regions, reflecting the more mature state of those markets. In the Northeast, efficiency program spending is projected to increase under all three scenarios, where differences in spending levels between the medium and high cases are largely driven by assumptions about how utility program administrators and state regulators translate statutes requiring acquisition of all cost-effective efficiency into multi-year savings goals. For the West, the regional trends are dominated by California, where electric program spending in both the medium and low cases is projected to decline over the long term, as saturation within key end-use markets occurs and as the state leans more heavily on other energy efficiency policies (Navigant 2012). In the medium case, those declines are offset by spending growth in other western states, leading to net
spending growth for the region as a whole, while in the low case, total electric program spending in the West is projected to decline slightly.
Figure 3. Projected Electric Energy Efficiency Spending by Census Region
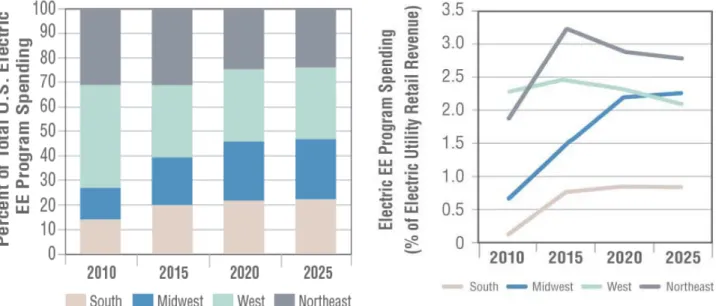
The differing regional trends imply a continued shifting of the energy efficiency map over the coming decade and beyond (see Figure 4). While states in the West and Northeast accounted for more than 70% of efficiency program spending in 2010, that percentage declines to just over 50% by 2025 in the medium case, with the South and Midwest splitting the remaining spending
about evenly. Notwithstanding the greater regional balance in absolute dollar spending on
electric efficiency programs, the South is still projected to lag well behind other regions in terms
of relative spending levels as a percentage of electric utility revenues. As shown in Figure 5,
spending as a percentage of revenues in the medium case is projected to rise from 1.8% and 2.8% in the Northeast over the 2010 to 2025 timeframe, and decline slightly from 2.4% to 2.1% in the West. In the Midwest, efficiency spending is expected to increase quite dramatically
21
(from 0.7% to 2.2% of revenues). However, in the South, while spending as a percentage of total electric utility revenues rises from 0.4% of revenues in 2010 to 0.9% in 2025, this is one-third to one-half the spending levels projected in the other three regions.
Figure 4. Regional Distribution of Electric Energy Efficiency Program Spending (Medium Case)
Figure 5. Electric Energy Efficiency Program Spending as a Percent of Utility Revenues (Medium Case)
4.3. Electric Energy Efficiency Program Savings Projections
In 2010, electric energy efficiency programs in the U.S. achieved incremental energy savings of
18.4 TWh, equivalent to 0.49 % of electric utility retail sales nationally (Foster et al. 2012).17 In
comparison, leading states, where program administrators typically have a decade or more of experience in delivering energy efficiency programs, have achieved annual savings of more than
1.0% of retail sales(e.g., CA, CT, MA, OR, VT, NV, HI, RI, and MN), and a sizeable
contingent of other states has consistently achieved savings in excess of 0.50% of retail sales. As explained previously in Section 3 (and in greater detail in Appendix A), the electric
efficiency program spending projections are linked to a corresponding set of savings projections
(see Table 6 and Figure 6), where in some cases savings estimates are derived from spending,
and in other cases vice-versa.18
17
Note that energy savings number cited here represents first-year savings from programs implemented in 2009, and should not be confused or compared with other estimates (e.g., CEE 2012) that refer to the combined impact in any given year from both programs implemented in that year and from programs implemented in prior years.
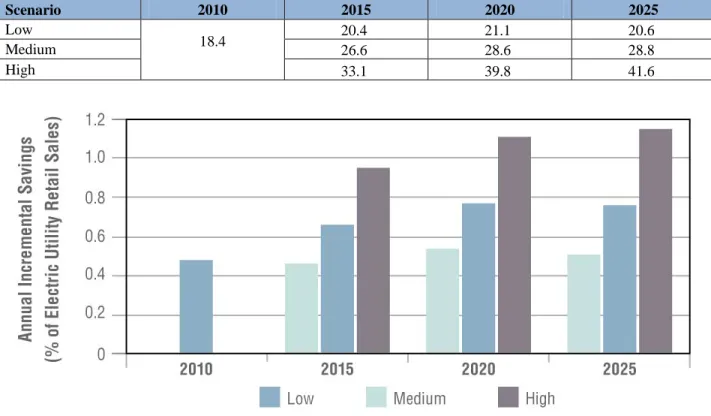
In the medium case, incremental annual energy savings from electric efficiency programs are projected to increase to 28.8 TWh and 0.76% of retail sales in 2025. This represents roughly a 50% increase over the impact of electric efficiency programs in 2010. As was the case for the spending projection, much of the projected increase in annual incremental savings is concentrated in the initial years of the forecast period, as the projection
18
To the extent possible, spending projections are intended to reflect “gross” savings (i.e., prior to accounting for free-riders or spillover effects). This approach was taken in order to abstract from potential inconsistencies across states in methods for estimating net-to-gross ratios.
22
follows the trajectory of the most recent batch of utility energy efficiency plans (which typically terminate in the 2012-2014 period) and EERS targets (which typically reach their final
percentage targets by 2020 or sooner).19 In the low case, incremental annual savings rise
moderately by 2015 before largely flattening out over the remainder of the forecast period, reaching 20.6 TWh or 0.53% of retail sales by 2025. In the high case, annual incremental savings rise to 41.6 TWh by 2025, more than double the level achieved in 2010, equivalent to 1.13% of total electric utility retail sales. Thus, in effect, the high case represents a scenario in which the national average savings rise to the level currently being attained by the top tier of states. In both the medium case and the high case, savings levels nationally are within the bounds of most studies of “achievable” energy efficiency potential. This suggests, among other things, that the level of savings projected in these two cases could potentially be reached
through accelerated deployment of current technologies, without significant reliance on new efficiency technologies.
Table 6. Projected Incremental Annual Electricity Savings from Utility Customer-Funded Programs (TWh) Scenario 2010 2015 2020 2025 Low 18.4 20.4 21.1 20.6 Medium 26.6 28.6 28.8 High 33.1 39.8 41.6
Figure 6. Projected Electricity Savings from Utility Customer-Funded Efficiency Programs
To place these savings projections in perspective, the Energy Information Administration (EIA)’s most recent reference case forecast (EIA 2012) projects that total U.S. retail electricity sales will grow at a compound annual growth rate (CAGR) of 0.58% over the 2010 to 2025 period, which is substantially lower than the average U.S. load growth of 1.6% per year over the past two decades. The EIA’s modeling framework (the National Energy Modeling System, or
19
For many states, our analysis assumes constant savings percentages from 2020 to 2025; those assumptions are reflected in the national totals in Figure 7, which similarly shows a flat or slight decline in savings percentages from 2020 to 2025.
23
NEMS) does not explicitly account for the impacts of future utility customer-supported efficiency programs; however, the electricity sales forecast generated by NEMS implicitly assumes that historical trends in utility customer-funded efficiency programs will continue over the forecast period. For the period 2000 to 2010, we estimate that utility customer-funded energy efficiency programs nationally achieved incremental savings of roughly 0.18% per year,
on average.20 Thus, if one were to assume that the EIA reference case forecast implicitly
assumes that savings from customer-funded electric efficiency programs continue to accrue at this historic rate, then a hypothetical reference case forecast with no future customer-funded energy efficiency activity would correspond to a CAGR of 0.76% (i.e., 0.58% plus 0.18%). Our medium case projection corresponds to average annual incremental electricity savings of 0.72% of retail electric sales per year between 2010 and 2025. This, in turn, implies that if electric utility customer-funded efficiency programs achieve savings at the level projected under our medium case, they would reduce growth in U.S. retail electricity sales to just 0.04% per year through 2025 (i.e., 0.76% annual growth with no future efficiency program activity minus projected annual incremental savings of 0.72% of retail sales per year under the median case),
offsetting almost all projected load growth under EIA’s 2012 reference case forecast.21
Following the same logic, our low case and high case savings projections would offset roughly 70% and 120% of load growth, respectively, yielding average annual growth rates for retail electricity sales of 0.21% and -0.18% from 2010 to 2025. To be sure, these benchmarks should be considered no more than a “back-of-the-envelope” estimate of the impact of projected
customer-funded efficiency program savings on load growth in the United States. Nevertheless, they suggest that rising savings levels, in combination with modest underlying drivers for load growth, could potentially lead to flat, or even negative, load growth over the next 10 to 15 years. 4.4. Gas Energy Efficiency Program Spending Projections
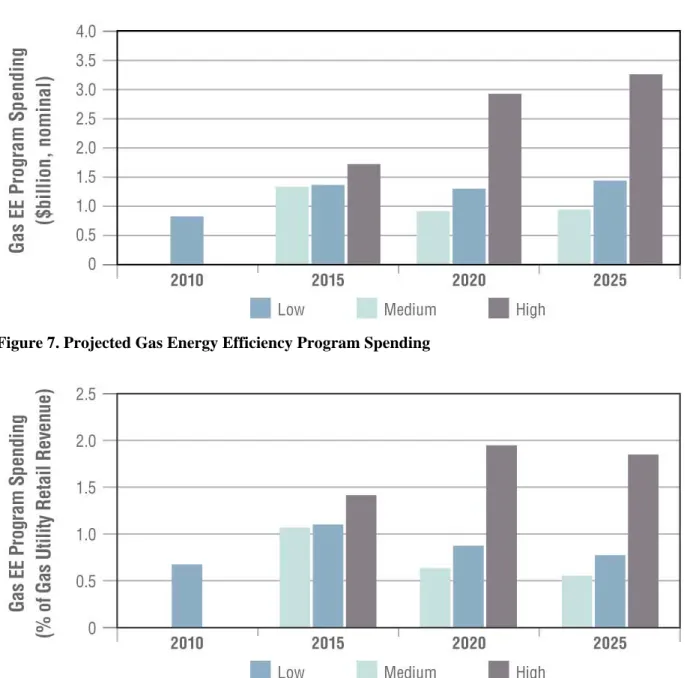
Our analysis suggests a very different set of trajectories for gas efficiency programs compared to electric efficiency programs (see Figure 7 and Figure 8). While the low and medium scenarios both show gas efficiency spending increasing from 2010 to 2015, associated primarily with increases that have already been planned or approved in recent multi-year gas DSM plans, we currently see little evidence to expect significant further spending growth at a national level beyond 2015. Thus, in the low case, spending on gas efficiency programs recedes from its elevated level in 2015 to below $1 billion in 2025 (0.5% of revenues), which is slightly higher than 2010 spending in absolute nominal dollar terms but lower as a percentage of gas
20
EIA’s National Energy Modeling System (NEMS) is calibrated to historical data on end-use stock efficiency and shipments, and the customer adoption simulation assumes, in essence, that consumers will continue purchasing equipment that exceeds minimum efficiency standards to the same extent as has historically occurred. This estimate of incremental savings from efficiency programs is based on ACEEE data for national electric efficiency program savings for 2006-2010, and savings for 2000-2005 are estimated based electric efficiency program spending for those years.
21
One must interpret this finding with a certain degree of caution given that: (a) EIA’s 2012 reference case load forecast projects much slower growth in electricity demand and in economic activity than has historically occurred, and (b) uncertainty regarding the precise extent to which EIA’s load forecast accounts for the impacts of future electric utility customer-funded efficiency programs. Our results suggest that additional analysis of the amount of future energy efficiency program savings that is implicit in EIA’s reference case forecast and more consistent accounting of free rider and spillover effects is warranted, although beyond the scope of this study.
24
distribution utility revenues. In the medium case, spending remains roughly flat at projected 2015 levels, reaching almost $1.5 billion in 2025, equivalent to 0.8% of revenues, a slight increase over the 2010 level. As discussed in Section 3, the low and medium case projections are driven largely by scheduled increases in federal minimum efficiency standards for furnaces, with differing assumptions between the low and medium cases about the extent of the impact on residential gas efficiency spending and the degree to which declines in residential program spending may be offset by increased spending on programs that target commercial/industrial customers. In the high case, however, where gas program savings in the leading states are assumed rise to levels on par with current leading states for electric efficiency, spending on gas programs roughly triples from 2010 levels, reaching $3.3 billion in 2025 (1.8% of revenues).
Figure 7. Projected Gas Energy Efficiency Program Spending
Figure 8. Projected Gas Energy Efficiency Program Spending as a Percentage of Gas Distribution Utility Revenues
25
5.
Discussion of Key Issues and Uncertainties
The preceding set of projections suggest a wide range of potential trajectories for utility customer-funded energy efficiency program spending and savings in the United States – even without considering the possibility of fundamentally new policy developments. In this section, we identify some of the significant issues and uncertainties that may influence the spending course and impact of these programs over the next 10 to 15 years and which we attempted to account for – either directly or indirectly – within the projections. These interrelated issues and uncertainties include both external factors, such as the broader policy and market context within which utility customer-funded programs operate, and internal factors related to the
implementation and regulatory oversight of these programs. 5.1. Broader Market and Policy Context
Utility customer-funded energy efficiency programs and their enabling policies function within a broader context, influenced by a variety of market forces and conditions, as well as by
interactions with other policies. We briefly highlight four key elements of this broader market and policy context that may be particularly critical to the future trajectory of customer-funded efficiency programs: the state of the economy, natural gas prices, federal minimum efficiency
standards, and environmental regulations affecting the electric power sector.22
The Economy
The timing and extent of the economic recovery may complicate and restrain efforts to scale-up energy efficiency spending and savings over the near to medium term, for several reasons. First, utility customer-funded energy efficiency programs typically requires customers to pay a portion of the capital outlay for energy efficiency measures; as households and businesses struggle to manage their day-to-day expenses, and as declining home values reduce the equity available for financing efficiency improvements, many customers may be reluctant to make new investments, even those with short payback periods. As a result, program participation may be suppressed, or program costs may rise if program administrators are required to increase financial incentives or expend greater sums on marketing efforts. Second, a stagnant economy is likely to reduce the rate of stock turnover and new housing starts, thereby reducing the amount of energy savings that could be captured through utility customer-funded programs targeting these market opportunities. Third, a slow economy may indirectly constrain energy efficiency program efforts in at least three ways: heightened sensitivity to potential near-term rate impacts
associated with efficiency program spending,23
22
Other aspects of the broader market and policy context that may impact future customer-funded energy efficiency program activity include the development of alternative utility business models, increasing capital costs for conventional generation technologies, greenhouse gas mitigation policies, and the lasting effects of ARRA-funding on energy efficiency program delivery infrastructure and energy efficiency potential.
increased risk that policymakers will re-direct
23
Lawmakers in Wisconsin and regulators in Florida, for example, have both cited rate impacts in repealing or lowering energy savings targets.