&
%
QUESO A QUALITY MODEL FOR OPEN
SOURCE SOFTWARE ECOSYSTEMS: LIST OF
MEASURES
Oscar Franco-Bedoya, David Ameller, Dolors Costal and
Xavier Franch.
Abril, 2016
UPC University
Software and Service Engineering Group (GESSI)
Technical Report No. ESSI-TR-16-1
Universitat Polit`
ecnica
de Catalunya
Barcelona, Spain
This technical report is part of QuESo-V2.0 a quality model for open source
soft-ware ecosystems (OSSECOs). Our prior efforts have focused on providing a detailed
list of the quality measures found during the execution of a systematic mapping on
OSSECOs. In this new version of the model, we addressing some of the issues that
were highlighted in the QuESo V1.0 such as: the unbalanced distribution of measures
and the ambiguity of some measures names. The measures listed in this report are
not intended to be an exhaustive and complete set. However, this list provides a
representative collection of OSSECOs measures. It is a small step in the direction of
developing a platform for support the analysis of OSSECO.
1
Introduction
1
2
QuESo Model
1
3
QuESo Measures
3
1
QuESo quality model . . . .
2
2
QuESo-measure ontology . . . .
4
1
Size measures. . . .
6
2
Activeness measures
. . . .
7
3
Heterogeneity measures. . . .
9
4
Regeneration ability measures. . . .
10
5
Effort balance measures. . . .
11
6
Expertise balance measures. . . .
12
7
Visibility measures . . . .
13
8
Community cohesion measures. . . .
15
9
Ecosystem cohesion measures. . . .
16
10
Information consistency measures. . . .
17
11
Synergetic evolution measures. . . .
18
12
Interrelatedness ability measures. . . .
19
13
Niche creation measures. . . .
20
14
OSSECO Knowledge measures. . . .
21
15
Visibility measures . . . .
21
16
Trustworthiness measures. . . .
23
1
Introduction
This technical report provides a detailed description of the measures defined in QuESo
V2.0. The measures listed in this technical report were obtained from a systematic
mapping of open source software ecosystems (OSSECOs).
These are grouped in
four quality characteristics defined in QuESo V2.0 (i.e.,
productivity
,
sustainability
,
network health
and
resorces health
). They are defined for measuring the quality of
OSSECOs. However, researchers, OSS communities, developers, OSS adopters, and
those related to OSSECOs may use these measures for adapting their own approaches.
QuESo V2.0 is a quality model for OSSECOs that defines quality characteristics,
subcharacteristics and measures. The quality characteristics in QuESo V2.0 have
been organized in three dimensions: (1) those that relate to the platform around
which the ecosystem is built, (2) those that relate to the community (or set of
com-munities) of the ecosystem and (3) those that are related to the ecosystem as a
network of interrelated elements, such as partners or companies (see Fig. 1).
Further-more, QuESo describe how any of these subcharacteristics could be measured using
statistical inference and experts’ knowledge.
We recommended to use this technical report together with the QuESo-V2.0
model, particularly if it will be used to assess the quality of an OSSECO.
2
QuESo Model
According to ISO 25010 standard, the quality of a system (e.g., OSSECO) is the
degree to which the OSSECO satisfies the stated and implied needs of its various
stakeholders [16]. Those stakeholders’ needs are precisely what is represented in the
quality model, which categorizes the OSSECO quality into characteristics and
sub-characteristics. Fig. 1 shows the QuESo-V2.0 quality model.
QuESo
V2.0
Maintenance
capacity
Sustainability
Process
maturity
Community
quality
Size
Community
cohesion
Activeness
Heterogeneity
Regeneration
ability
Effort
balance
Expertise
balance
Visibility
Ecosystem
network
quality
*Resources
health
Network
health
Information
consistency
Vitality
Interrelatedness
ability
Synergetic
evolution
Platform
quality
OSSECO
knowledge
Niche
Creation
Trustworthiness
Ecosystem
cohesion
From Jansen (2014)
Dimension
Characteristic
Sub-characteristic
From QualOSS
Figure 1:
QuESo quality model
In the next subsections, we describe each of the quality characteristics of
QuESo-V2.0.
2.1
Maintenance capacity
OSSECOs need a continuous input of energy in the form of new development or
main-tenance of the ecosystem. It is the capacity of a OSSECO to provide the resources
necessary for maintaining its products [32]. In OSSECOs the maintenance capacity
balances the OSS community practices and the needs of the other members of the
OSSECO. In general the objective of the maintenance capacity is allowing the
modifi-cation of the existing OSSECO resources, relationships and products while preserving
its integrity.
2.2
Process maturity
From an OSSECO approach the software development process cannot be subjected to
standardized process models, tools and ways of working. This means that traditional
process maturity approaches, such as CMMi become much more difficult to apply in
this context [13, 35]. However, determine which good practices a specific OSSECO
follows, as well as how established these practices are, is perfectly reasonable. Soto
and Ciolkowski define OSSECO process maturity as the ability of a OSSECO to
consistently achieve development-related goals by following established processes. It
can be assessed for specific software development tasks with the answers of questions
such as: (1) is there a documented process for the task?, (2) if there is an established
process, is it executed consistently? [32]. We omit process maturity of our model
because we have not found quantitative measures to evaluate it. Furthermore, [32]
developed a process maturity evaluation framework specifically aimed at OSSECOs.
2.3
Sustainability
According to [6] sustainability is one of the fundamentals challenges in any type of
ecosystem. A sustainable natural ecosystem maintains its characteristic diversity of
major functional groups, productivity, and rates of bio-geochemical cycling, even in
the face of disturbing events. Similar to Dhungana et al.[6], we defined a sustainable
OSSECO to be the one that can increase or maintain its products, resources, members
and relationships over longer periods of time and can survive inherent changes such
as new technologies, new products, competitors that can change the population. In
summary sustainability is the likelihood that a OSSECO remains able to maintain
the products or services it develops over an extended period of time.
2.4
Network health
Hartigh et al. define network health as a representation of how well partners are
connected in the ecosystem and the impact that each partner has in its local network
[5]. Healthy ecosystems show many relations and subsystems of different types of
elements that are intensely related [10]. Furthermore, in a healthy OSSECO network,
these relations are mutualistic [26]. Van der Linden et al. proposed to evaluate the
network health of an OSSECO before its adoption [33].
2.5
Resources health
In business ecosystems (BECOs), resources health is related to the financial health
concept defined by Hartigh et al. [5]: “it is a long-term financially based reflection of a
partner’s strength of management and of its competences to exploit opportunities that
arise within the ecosystem and is directly related to the capability of an ecosystem
to face and survive disruption”. In the context of OSSECOs, we defined resources
health as the ability of an OSSECO to obtain value from their symbiotic relationships
between all members and resources of the ecosystem. This means that the OSSECO
will remain growing and increasing in longevity [17].
3
QuESo Measures
In this chapter we described the measures used in the QuESo quality model. In order
to describe in detail the QuESo measures, we introduce a basic QuESo-measure
on-tology (see Fig 2). this shows the graphical representation of classes and properties of
the ontology. We are using the visual notation for OWL ontologies language (VOWL)
[24].
Measure
Source of
Measure
Historical
Subclass of
hasSource
n..1String
hasCode
String
hasName
String
hasProcedure
String
hasMethod
String
hasPurpose
String
hasInterpretation
Absolut
Subclass of
Measure
Value
hasMValue
hasMValue
1..n 1..1Date
hasDate
Numerical
hasValue
Literal
Data sources
Literal
String
Experts
Description
Figure 2:
QuESo-measure ontology
3.1
Measure structure
Based on the ontology, the most important concepts in measure-definition are:
Measure
This class represents all measures in the QuESo Quality model. The list
of datatype properties of this class is:
•
Code:
Unique identifier for the measure.
•
Name:
Name of the measure.
•
Purpose:
It is a question answered by the measure use. What does this
metric tell us about the OSSECO?.
•
Method:
Provides a summary of the application
•
Procedure:
Describe the measurement process or formula when is available.
•
Interpretation:
Provides the range and preferred values.
Source of Measure
This class specify thedatarepositoryusedasasource forthe
•
Data sources:
When the measure data can be accessed automatically using
software tools.
•
Experts:
When it is necessary to recollect the measure data from
het-erogeneous experts (e.g., company adopters, OSS-community members,
researchers).
•
Description:
A brief description of the measure data source.
Measure Value
It is a tuple with two fields: value of the measure and data when
this was measured.
Historical
In this measure, the measurement process is done in a time interval. The
result is a set of measure values.
Absolute
In this measure, the measurement is done in a specific time. The result is
a single measure value.
3.2
Measure tables
The measures are listed by QuESo quality characteristics and subcharacteristics.
3.2.1
Maintenance capacity
Size
OSSECOs are dynamic entities in which change is the rule, and during this process
they grow in size and complexity. This subcharacteristic indicates the overall
evolu-tion of the size populaevolu-tion in an OSSECO. Simple measures show the size of an active
OSSECO. By calculating these measures for different time windows it is possible to
study the community dynamics [10]. Because of this, they are ideal for statistical
and network analysis, since a high sample size increases the significance of found
re-sults and improves the external validity [21]. Finally, OSSECO measures of size are
typically used to compare OSSECOs [17]. Table 1 shows the
Size
measures.
Table 1:
Size measures.
Cod. Name Purpose Method Procedure Interpretation Source Type
S-NoP Number of partners Are there organizations that can provide different types of support to an OSSECO-community?
Count the number of companies, institutions, research communities, etc. that support the OSSECO-community. Crawler query More is better. More partnerships indicate a strong project that is well embedded in the community [17]. Data source: OSSECO websites. A S-NoPU Number of passive users
How many people are just downloading and using the software produced by the OSSECO-Community?
Count the number of OSSECO-community members from mailing list that are not contributors.
Data base query
More is better. Passive users are essential for a sustainable OSSECO-community [22]. Data source: OSSECO repositories. H S-NoC Number of contributors
How many people are collaborating in different types of activities in the OSSECO-community?
Count the number of people that make changes in the OSSECO-community data repositories e.g. authors, active users, commiters, readers, translators. Data base query More is better. Number of active and mature contributors is a measure that indicates a healthy OSS-community [17]. Data source: OSSECO repositories. H S-SoNC Size of network community
What is the size of the OSSECO-community social network?
Count the number of edges in the network. OSSECO-community social network its a graph were nodes are members and the edges are different type of relationships (e.g., emails, shared commits). Data base query More is better. Networks with more nodes and connections are bigger and have a better structure. Data source : OSSECO repositories. H S-NoCM Number of OSSECO-community members
How many people are in the OSSECO-community?
Count the number of contributors, passive users and partners in the the OSS- community. N oCM= (SN oP)∪ (SN oP U)∪ (SN oC) SN oCM= n(X) More is better. More members indicate that the OSS-community have a good structure for maintaining its products [27]. Data source: OSSECO repositories. H
Activeness
Activeness
as a QuESo quality subcharacteristic refers to the different activity types
of the OSSECO. i.e., how much business is created, how much value is added, and how
many new players are joining [19]. Furthermore, the OSSECO contributor community
level of activity by aggregating data coming from the analysis of mailing list, forum,
and bug tracking system archives, as well as from versioning system logs [32]. Table 2
shows the
Activeness
measures.
Table 2:
Activeness measures
Cod. Name Purpose Method Procedure Interpretation Source Type
A-BTA Bug tracking
activity
Is the OSSECO-community active in the bug tracking system? Count the number of bugs activities (e.g., bugs opened, closed, status changed, bug fix time, etc.) from the project bugs tracker system. A=Number of bugs reported B=Number of critical bugs reported C=Number of bugs opened D=Number of bugs closed
G = Bug fix time E = D/ C F= Number of comments created in the project bug tracker system Bug tracking activity is an indicator of OSSECO-community activity [29] Any of measures can be used to assess the activity in the OSSECO-community, e.g.: A, B, F= can be used to assess the OSSECO community users activity. E, G= Can be used to assess the OSSECO-community contributors activity. If E is near to 0 is better. B= Might play a vital contribution for members participation in the OSSECO-community activities Data source: OSSECO bug-tracking system. H A-CaBFC Communication and bug fixing correlation Is there a correlation between OSSECO developers communication and software quality? Calculate the number of developers communication in mailing list and the number of bugs fixed in a OSSECO-project. X=Pearson’s correlation coefficient(A,B) A= Set of number of communications B= Set of number of bugs fixed X=1 (Perfect positive correlation) 0¡X¡1 (Positive correlation) X=0 (No correlation) -1 ¡ X ¡ 0 (Negative correlation) X= -1 (Perfect negative correlation) Perfect negative correlation is better. There is a significant correlation between communication and quality [1]. Data source: OSSECO mailing lists and bug tracking system. A A-DoLC Date of last commit How is the OSS-community ctuality?
Read the date of the last commit from the version control repository system.
Data base query More recently is
better A
OSS-community that has more actuality is more active. Data source: OSSECO version control repository system. A A-VH Version history How is the OSS-community evolving? Calculate the number of major releases per year from the OSS-community web
Crawler query More is better
The number of project releases show the evolution in an OSSECO-community [22] Data surce: OSSECO web sites. H A-DoLR Date of last release How is the OSSECO-community actuality?
Read the date of the last release from the version control repository system.
Data base query More recently is
better A
OSS-community that has more actuality is more active. Data source: OSSECO version control repository system. A A-NoCF Number of changed files How is the activity in the OSSECO-community repositories? Count the number of files changed per commit.
Data base query More is better
High number of files changed implies more OSS-community activity [30] and effort [12] . Data source: OSSECO version control repository system. H
Cod. Name Purpose Method Procedure Interpretation Source Type A-CA Communication activity How is the communication between OSSECO-community members? Read the OSSECO-community communications activity from the e-mail system. It’s possible to do several kinds of calculations with this values. D= Number of responses obtained from a message F= Number of messages from contributors More is better High communications activities implies a high active OSSECO-community [11]. Data source: OSSECO mailing lists. H A-CCA Community contributor activity How is the commits activity in the OSSECO-community projects? Count the number of commits and count the number of contributors from the control repository system. X= number of commits / number of contributors High is better Commits activity is an indicator of OSS-community activity [12]. Data source: OSSECO version control repository system. H A-CCR Community commit rate How long between commits of a OSS-community? Calculate the average of time between first and last commits dates of all OSSECO-community projects. CCR=
P
n 1P CT(pi) n PCT= interval commit time for a projectn= number of OSSECO
community projects
Low is better Smaller rate can be interpreted like a more active OSSECO-community. Data source: Version control repository system. H
A-DP Decline point When the values
of number of emails starts to decline?
Calculate the date for which the number of contributors is an 80% of the culminating point. A.DP=x < max(n)∗0,8 n= number of emails Data source: OSSECO Mailing lists. A A-CP Culminating point When the number of emails is maximum in the OSS-community history? Calculate the date for which the maximum number of emails is found in the OSSECO-community history A.CP=max(n) n= number of emails Data source: OSSECO Mailing lists A A-OCAP OSSECO-community activity period Is it possible to know whether a OSS-community was active all the time or there have been some gaps of inactivity during its lifetime? Identify the period of time between culminating point and decline point
[A-CP,A-DP] Large is better
A large community activity period is better [8]. Data source: OSSECO Mailing lists. H A-CT Community Timelines How is the OSSECO-community timeliness? Calculate the average of time between date of request and date of first response of all projects in the OSSECO-community ET=
P
n 1T F R(ri) n TFR= time interval for first response to a request i n= number of OSSECO-comunity request.Low is better [2]. Data sources:
OSSECO mailing lists. version control repository system and bug tracking system. H A-NoE Number of events
How is the social activity in a OSSECO-community?
Count the number of events and people that participate in these events
Use list of events attendees and calculate: A=Number of people participating in an event. B=Number of events C=Event regularity
More people are better and more events are better [22]. Data source: content management system [17]. H
3.2.2
Sustainability
Heterogeneity
OSSECOs are global and complex interconnected and distributed community-oriented
model of software development and services. This characteristic of OSSECO creates
a wide range of diversity and heterogeneity. Because of this, governance, goals,
com-munity structure and mechanisms, and business models have continued to diverge.
In order to maintain healthy growth of divergent OSSECO-community projects, it is
necessary to provide a basic framework to describe this diversity and heterogeneity
[36]. Table 3 shows the
Heterogeneity
measures.
Table 3:
Heterogeneity measures.
Cod. Name Purpose Method Procedure Interpretation Source Type
H-GMD Geographical
members distribution
Are the members of the OSSECO-community geographically distributed? Identify the geographical location of members from the mailing lists.
Count the number of the different geographical locations (e.g. countries) Data base query. More is better More members distributed implies more heterogeneity. Data source: OSSECO mailing lists H H-MAT Member activity types
Are the OSSECO-community member distributed across different activity types?
identify the activity types from the file paths and filenames [34].
Count the number of members participating in each activity Calculate the Gini Index [34] Closer to 0 is better [29] A zero value for these indices implies a uniform distribution. A value of 1 means inequality. Data source: OSSECO version control repository system. H H-ViOP Variety in OSSECO-community projects
How many kinds of projects has the OSSECO-community? Search project information in OSSECO-community data sources Data base query. More is better A large variety in projects is an indicator that there are many niches, platforms, domains, etc., in which a new player can become active [17]. Data source:OSSECO projects index, content management system and multi-homing H H-VoOP Variety of OSSECO-community partners
How many kinds of partners has the OSSECO-community?
First partners are classified into species by their characteristics (e.g., private, public) Second calculate the proportions of the species in the entire market as a reference point Calculate for each partner the proportions of different species that is related to.
Calculate the covariance of partner variety with the market ˙ High is better Covariance with market indicates the variety of different partners a partner has. Experts: OSSECO-partners surveys A H-OMD Organizations members’ distributions
How are the affiliations of OSSECO-community members to organizations.
Count the number of organizations in which the OSSECO-community members are affiliated.
N/A More is better
Experts:OSSECO-partners surveys.
Regeneration ability
Regeneration ability is the degree to which the size evolution of a OSSECO community
happens at an adequate rate to maintain a sustainable OSSECO size that allows
them to survive the loss of some of their human resources [7]. Table 4 shows the
Regeneration ability
measures
Table 4:
Regeneration ability measures.
Cod. Name Purpose Method Procedure Interpretation Source Type
RA-CSR Contributor survival rate What is the number of surviving contributors in the OSSECO community? Calculate the OSSECO community contributors that were at the beginning and survived in a period time. X= number of active contributors that survive Y = number of active contributors at the beginning RA-CSR= X/Y e.g. CSR= 70% implies that 7 contributors survive for each 10 contributors per year. Higher is better [27] Data source: OSSECO mailing lists, version control repository system and bug tracking system. H RA-CNMR Community new members rate Is the number of OSSECO-community members evolving?
Count the number of members that have done their affiliation to the community on a time period. X = number of active members Y= number of new members in a period of time CNMR= Y/X Higher is better. More new members more survival likelihood [17] Data source: OSSECO mailing lists. H RA-CNCR Community new contributors rate Is the number of OSSECO-community contributors evolving?
Count the number of contributors that had done their first contribution to the OSSECO-community on a time period. X = number of active contributors Y= number of new contributors in a period of time CNCR= Y/X Higher is better More new contributors more survival likelihood [17]. Data source: OSSECO mailing lists, version control repository system and bug tracking system. H
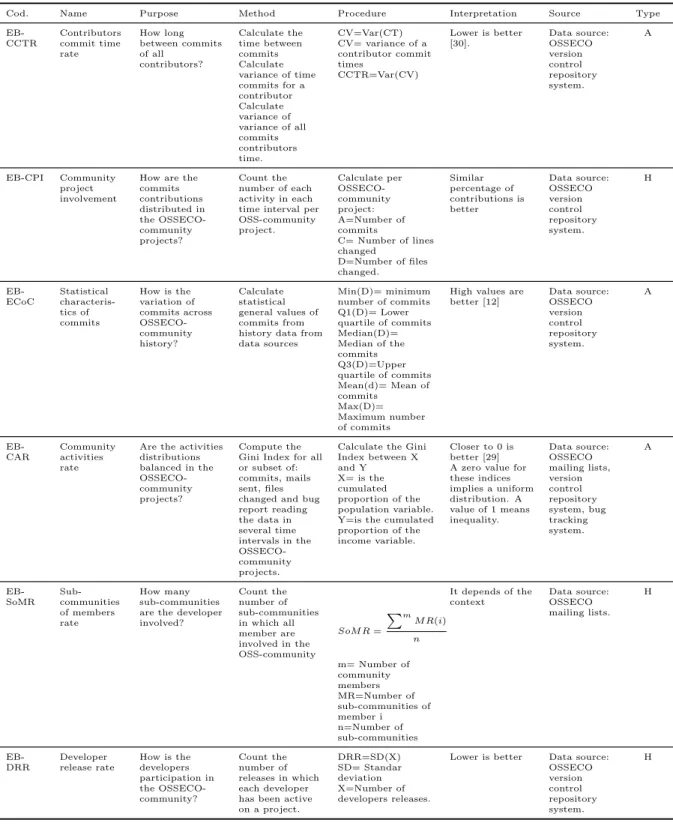
Effort balance
An ecosystem is the result of a delicate and dynamic balance between its interacting
components [28]. OSSECO effort balance can be expressed as a function of
sev-eral variables such as lines of code, number of commits, and number of
OSSECO-community members. Table 5 shows the
Regeneration ability
measures.
Table 5:
Effort balance measures.
Cod. Name Purpose Method Procedure Interpretation Source Type
EB-CCTR Contributors commit time rate How long between commits of all contributors? Calculate the time between commits Calculate variance of time commits for a contributor Calculate variance of variance of all commits contributors time. CV=Var(CT) CV= variance of a contributor commit times CCTR=Var(CV) Lower is better [30]. Data source: OSSECO version control repository system. A EB-CPI Community project involvement
How are the commits contributions distributed in the OSSECO-community projects? Count the number of each activity in each time interval per OSS-community project. Calculate per OSSECO-community project: A=Number of commits C= Number of lines changed D=Number of files changed. Similar percentage of contributions is better Data source: OSSECO version control repository system. H EB-ECoC Statistical characteris-tics of commits How is the variation of commits across OSSECO-community history? Calculate statistical general values of commits from history data from data sources Min(D)= minimum number of commits Q1(D)= Lower quartile of commits Median(D)= Median of the commits Q3(D)=Upper quartile of commits Mean(d)= Mean of commits Max(D)= Maximum number of commits
High values are better [12] Data source: OSSECO version control repository system. A EB-CAR Community activities rate
Are the activities distributions balanced in the OSSECO-community projects? Compute the Gini Index for all or subset of: commits, mails sent, files changed and bug report reading the data in several time intervals in the OSSECO-community projects.
Calculate the Gini Index between X and Y X= is the cumulated proportion of the population variable. Y=is the cumulated proportion of the income variable.
Closer to 0 is better [29] A zero value for these indices implies a uniform distribution. A value of 1 means inequality. Data source: OSSECO mailing lists, version control repository system, bug tracking system. A EB-SoMR Sub-communities of members rate How many sub-communities are the developer involved? Count the number of sub-communities in which all member are involved in the OSS-community SoM R=
P
m M R(i) n m= Number of community members MR=Number of sub-communities of member i n=Number of sub-communities It depends of the context Data source: OSSECO mailing lists. H EB-DRR Developer release rate How is the developers participation in the OSSECO-community? Count the number of releases in which each developer has been active on a project. DRR=SD(X) SD= Standar deviation X=Number of developers releases.Lower is better Data source:
OSSECO version control repository system. H
Expertise balance
Developing complex software projects in a OSSECO requires skill and expertise in a
share-market domain (e.g., Eclipse OSSECO requires knowledge and expertise in
plu-gins, R OSSECO requires skills in statistics). Expertise is one of the most overarching
attributes of OSSECOs [20]. OSSECO adopters and contributors typically share the
same level of technical expertise (i.e., mostly developer-to-developer communication
[4]). The networks of members in an OSSECO provide expertise on different domains
and assist in the creation of solutions or products in the ecosystem. Table 6 shows
the
Expertise balance
measures.
Table 6:
Expertise balance measures.
Cod. Name Purpose Method Procedure Interpretation Source Type
E-CE Contributors expertise How is the expertise of the OSSECO-community contributors? Count the number of files that contributors have changed and classify this by their file extension.
Classify the expertise of all contributors according his kind of contributions.
High balanced is better
A zero value for these indices implies a uniform distribution. A value of 1 means inequality. Data source: OSSECO version control repository system. A E-LoCR Longevity of contributor rate
How many time is a developer in the OSSECO-community?
Obtain dates of first and final author commits Calculate time
between dates LoCR=
P
m T ime(Ci) m Time(Ci)= Time of contributor i m=Number of contributors. High is better [25] Data source: OSSECO version control repository system. H E-CER Contributor experience rate How is the experience of the OSSECO-community contributors?Count the total number of releases in which the contributors were active. Contributor project experience= Number of releases since the contributors first activity on the project. CER=
P
m N R(Ci) m NR(Ci)=Number of releases of contributor i m=number of contributors. High is better [30] Data source: OSSECO version control repository system. H E-NoPpC Number of projects per contributor Does each OSSECO-ecosystem contributor have a OSSECO-community project in which it contribute? Count the number of projects where contributorUse Gini Index Close to 0 is
better. A zero value for these indices implies a uniform distribution. A value of 1 means inequality [5]. OSSECO version control repository system. A
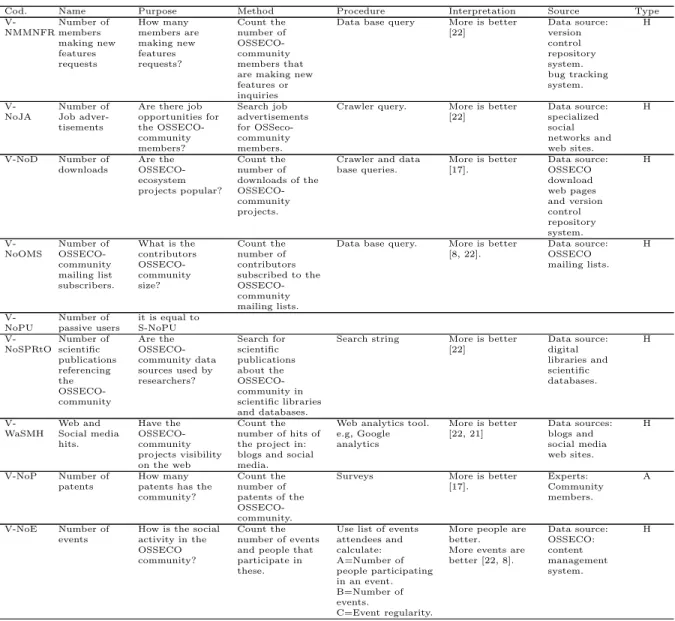
Visibility
Visibility tells us something about the popularity of the OSSECO in the shared
market. Healthy ecosystems have many partners that are central players and hence
possess a high visibility in the market. Those partners have a high impact and
there-fore a positive influence towards adopters and towards other partners [5]. OSSECO
Visibility
can be measured as a aggregation of several measures such as the amount
of requests or feedback received to the OSSECO web site, the number of hits the
OS-SECO gets in the media and blogs and what is the amount of activity on the project’s
visibility in the social media, e.g. Twitter and Facebook [22], the number of OSSECO
events, patents and so on. Finally, greater visibility is useful in convincing potential
adopters to collaborate with the OSSECO. Table 7 shows the
Visibility
measures.
Table 7:
Visibility measures
Cod. Name Purpose Method Procedure Interpretation Source Type
V-NMMNFR Number of members making new features requests How many members are making new features requests? Count the number of OSSECO-community members that are making new features or inquiries
Data base query More is better
[22] Data source: version control repository system. bug tracking system. H V-NoJA Number of Job adver-tisements
Are there job opportunities for the OSSECO-community members? Search job advertisements for OSSeco-community members.
Crawler query. More is better
[22] Data source: specialized social networks and web sites. H V-NoD Number of downloads Are the OSSECO-ecosystem projects popular? Count the number of downloads of the OSSECO-community projects.
Crawler and data base queries. More is better [17]. Data source: OSSECO download web pages and version control repository system. H V-NoOMS Number of OSSECO-community mailing list subscribers. What is the contributors OSSECO-community size? Count the number of contributors subscribed to the OSSECO-community mailing lists.
Data base query. More is better
[8, 22]. Data source: OSSECO mailing lists. H V-NoPU Number of passive users it is equal to S-NoPU V-NoSPRtO Number of scientific publications referencing the OSSECO-community Are the OSSECO-community data sources used by researchers? Search for scientific publications about the OSSECO-community in scientific libraries and databases.
Search string More is better
[22] Data source: digital libraries and scientific databases. H V-WaSMH Web and Social media hits. Have the OSSECO-community projects visibility on the web Count the number of hits of the project in: blogs and social media.
Web analytics tool. e.g, Google analytics More is better [22, 21] Data sources: blogs and social media web sites. H V-NoP Number of patents How many patents has the community? Count the number of patents of the OSSECO-community.
Surveys More is better
[17]. Experts: Community members. A V-NoE Number of events
How is the social activity in the OSSECO community?
Count the number of events and people that participate in these.
Use list of events attendees and calculate: A=Number of people participating in an event. B=Number of events. C=Event regularity.
More people are better. More events are better [22, 8]. Data source: OSSECO: content management system. H
Cod. Name Purpose Method Procedure Interpretation source V-CRaR Contributor ratings and reputation. How is the OSSECO-ecosystem contributors reputation? Obtain contributors data from OSSECO-community data sources and surveys. ET=
P
n T F R(ri) n TFR=Time interval for first response to a request i n= Number of OSSECO-community requests. Can be established by looking at the contributor standing in the community, their numbers of commits, their individual bug x times. High is better [17]. High contributors ranking implies more Trustworthiness. Data Experts: OSSECO contributors Data source:OSSECO web pages. H V-GMD Geographical members distribution It is equal to H-GMD VCA Community acceptance How is the OSSECO-community acceptance by commercial organizations? Obtain information from partnerships about OSSECO-ecosystem acceptance. Surveys Crawler query High is better. OSSECO-community acceptance is better [17]. Experts: OSSECO partners. A OSSECO content man- age-ment system. V-NWPROWP Number of web pages referencing the OSSECO-community web pageHow many page referenced the OSS-community web page? Use a specialized software for count the number of web pages.
Web analytics tool. e.g., Google analytics. More is better[22, 17]. Data sources: World Wide Web. H
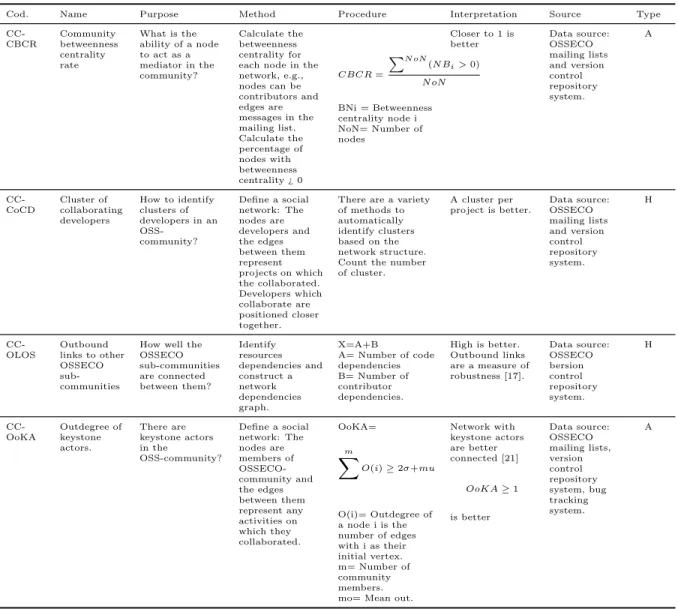
Community cohesion
Cohesion is an indicator of connectedness between members in a OSSECO-community.
It is a property that keeps communities’ structure safe from risks, guaranteeing their
wellbeing and health [31]. Cohesion guarantees an efficient exploitation of core
re-sources, a proper flow of information between species and provides the necessary
protective factors against the entrance of new competitors [5]. Table 8 shows the
Community cohesion
measures.
Table 8:
Community cohesion measures.
Cod. Name Purpose Method Procedure Interpretation Source Type
CC-CBCR Community betweenness centrality rate What is the ability of a node to act as a mediator in the community? Calculate the betweenness centrality for each node in the network, e.g., nodes can be contributors and edges are messages in the mailing list. Calculate the percentage of nodes with betweenness centrality ¿ 0 CBCR=
P
N oN (N Bi>0) N oN BNi = Betweenness centrality node i NoN= Number of nodes Closer to 1 is better Data source: OSSECO mailing lists and version control repository system. A CC-CoCD Cluster of collaborating developers How to identify clusters of developers in an OSS-community? Define a social network: The nodes are developers and the edges between them represent projects on which the collaborated. Developers which collaborate are positioned closer together.There are a variety of methods to automatically identify clusters based on the network structure. Count the number of cluster. A cluster per project is better. Data source: OSSECO mailing lists and version control repository system. H CC-OLOS Outbound links to other OSSECO sub-communities
How well the OSSECO sub-communities are connected between them? Identify resources dependencies and construct a network dependencies graph. X=A+B A= Number of code dependencies B= Number of contributor dependencies. High is better. Outbound links are a measure of robustness [17]. Data source: OSSECO bersion control repository system. H CC-OoKA Outdegree of keystone actors. There are keystone actors in the OSS-community? Define a social network: The nodes are members of OSSECO-community and the edges between them represent any activities on which they collaborated. OoKA= m
X
O(i)≥2σ+mu O(i)= Outdegree of a node i is the number of edges with i as their initial vertex. m= Number of community members. mo= Mean out.Network with keystone actors are better connected [21] OoKA≥1 is better Data source: OSSECO mailing lists, version control repository system, bug tracking system. A
3.2.3
Network health
Ecosystem cohesion
This subcharacteristics is related to the OSSECO community cohesion, however, the
measures are more related to a holistic point of view of the OSSECO. Table 9 shows
the
Ecosystem cohesion
measures.
Table 9:
Ecosystem cohesion measures.
Cod. Name Purpose Method Procedure Interpretation Source Type
EC-NoNtDO Number of nodes to disconnect the OSSECO-ecosystem How is the OSSECO-ecosystem connected? Define a OSS-ecosystem social network. Calculate the minimum number of nodes that would need to be removed from the network before it becomes. disconnected.
Data base query and surveys
More is better. Data source:
OSSECO version control repository system, mailing lists, content management system. Experts: OSSECO members. H EC-OoKA Outdegree of keystone actors How many keystone actors have he OSSECO? Define a OSSECO-ecosystem social network The outdegree of a node v is the number of edges with v as their initial vertex.
Data base query. High is better.
High outdegree implies that the actor plays a large role in the OSSECO. Data source: OSSECO mailing lists, version control repository system and bug tracking system. Experts: OSSECO members. H EC-OCC OSSCO clustering coefficient
How close are the OSSECO nodes to becoming a complete graph with its neighbors. Define a social network: The nodes are the OSSECO mem-bers/artifacts and edges definitions depend of the type of the ecosystem analysis.(mails, code, project dependencies, resources). CCi= Li Ni(Ni−1) where Li is the number of links between the neighboring nodes Ni of node i N is the number of nodes in the network. OCC=c= 1 n n
X
1 CCi Close to 1 is better [27]. Data source: OSSECO mailing lists, version control repository system and bug tracking system. Experts: OSSECO members. A EC-NoPC Number of partners connections How many connections have the partners in the OSSECO network? Define a network: partners and projects are the nodes and any communication is a edge. Count the number of connections between central and non-central species or partners.Data base query and Surveys. More is better. More number of connections implies more Interrelatedness. Data source: version control repository system. Experts:OSSECO partners. H
Information consistency
The communication in a OSSECO has a common vocabulary that presents the
sum-mary of the terms used in the OSECO. A common vocabulary is a tool for the
mem-bers who wants to obtain a general overview of the domain language of a OSSECO.
Table 10 shows the
Information consistency
measures.
Table 10:
Information consistency measures.
Cod. Name Purpose Method Procedure Interpretation Source Type
IC-OSiVM OSSECO synonyms in vocabulary map How to obtain a general overview of the domain language of the OSSECO? Construct a vocabulary map with the terms in the OSSECO data sources. Identify synonyms
Data base query and Text mining.
A common language is better. Less synonyms is better Data sources: OSSECO version control repository system, mailing lists and content management system. A IC-OSAS OSSECO sentimental analysis How is the message vocabulary content in the OSSECO? Pre-process the email messages. Configure the sentimental words. Score the words. Classify the words.
Data base query A possitive
vocabulary is better. Data sources: OSSECO mailing lists. A
Synergetic evolution
It is the ability of the subsystems that constitute the whole ecosystem to form a
dynamic and stable space-time structure [14, 23]. Synergetic evolution measures the
collaboration between the key members in an OSSECO. Table 11 shows the
Synergetic
evolution
measures.
Table 11:
Synergetic evolution measures.
Cod. Name Purpose Method Procedure Interpretation Source Type
SE-OPD OSSECO partners distribution Is the partner distribution over the ecosystem species equality? Count the number of partners in each OSSECO project Calculate Gini index Close to 0 is better A zero value for these indices implies a uniform distribution. A value of 1 means inequality [5]. Experts: OSSECO partners. A SE-OP OSSECO popularity How is the OSSECO popularity in external companies? Calculate the information entropy E(CT) = − i=n
X
i=1 Pilog2Pi C=Commercial companies. P=percentage contribution [37]. High is better [37]. If entropy is low the OSSECO is supported by a small number of companies. Experts: OSSECO partners. OSSECO sponsors. H SE-OPCPaE OSSECO projects community partnership and embed-dedness How is the OSSECO-community projects embeddedness? Obtain information about partnership model [17]Crawler query and surveys. High is better [17] Data source: OSSECO Content management system. Experts: OSSECI members H SE-OR OSSECO reciprocity Is there OSSECO reciprocity? Define a social network: The nodes are the OSSECO mem-bers/artifacts and edges definitions depend of the type of the ecosystem analysis( e.g., mails, code, project dependencies, resources). Reciprocity is the correlation coefficient between the entries of the adjacency matrix of a directed graph. P>=0 is better. This measures the amount of direct reciprocity (P>0) or antireciprocity (P<0) in networks, with mutual links occurring more and less often than in random networks. The neutral or reciprocal case corresponds to p=0. Data source: version control repository system, mailing lists and content management system. Experts:OSSECO members. H
Interrelatedness ability
Interrelatedness is the ability of nodes in an OSSECO to establish connections
be-tween them based on the ways developers collaboratively contribute to the OSSECO
projects [9]. Table 12 shows the
Interrelatedness ability
measures.
Table 12:
Interrelatedness ability measures.
Cod. Name Purpose Method Procedure Interpretation Source Type
IA-OPCE OSSECO partners con-nectedness evolution How is the partners connectedness evolution in the OSSECO? Define a OSSECO social network. Number of relations as a proportion of the theoretically maximum number of relations in all network.
Data base and crawler queries. Growing is better. High connectedness is a property that keeps OSSECO structure safe from risks, guaranteeing their well-being and health. Data source: OSSECO version control repository system, mailing lists, content management system. Experts: OSSECO members. H IA-OPOOMCE OSSECO partners with other OSSECO members connected-ness evolution. How is the partners connectedness with other OSSECO members evolution? Define a OSSECO social network. Number of relations as a proportion of the theoretically maximum number of relations in all network.
Data base and crawler queries. Growing is better. High connectedness is a property that keeps OSSECO structure safe from risks, guaranteeing their well-being and health. Data source: version control repository system, mailing lists and content management system. Experts: OSSECO members. H IA-OCE OSSECO centrality evolution. What OSSECO members tend to be more connected between them? Define a OSSECO social network. It’s possible to calculate several centrality measures: C1= Partner centrality. C2= Project code centrality. C3= Ecosystem code centrality. C4= Files centrality. C5= Centrality of a developer’s contributions.
Process are defined in [3] The centrality is used within network analysis as a measure to indicate the importance of a node in the network. Data source: OSSECO version control repository system, mailing lists and content management system. Experts: OSSECO members. H
3.3
Resources health
Niche creation
It is the ability of the OSSECO to increase meaningful members diversity over time
[27]. According to [17] Niche creation describe how much opportunity there is in the
OSSECO to start as a new niche player. Furthermore, it is one of the measures defined
by [15] for evaluating ecosystem health. Niche creation is also, one of the OSEHO
platform pillars (Open Source Ecosystem Health Operationalization) defined by [17].
Table 13 shows the
Niche creation
measures.
Table 13:
Niche creation measures.
Cod. Name Purpose Method Procedure Interpretation Source Type
NC-NoCToOPA Number of context types of OSSECO projects applications Have the OSSECO projects different types of context applications? Identify the project OSSECO dependencies. Crawl the OSSECO content management system. Identify the project contexts.
Data base and crawler queries. More is better. A wide variety of OSSECO project applications contexts, will be more supporting for niche creation [17] Data source: version control repository system and content management system Experts: OSSECO members. H NC-NoNLS Number of natural languages supported Is the OSSECO multi-language?
Crawl the OSS content management system. Identify different languages in the OSSECO repository.
Data base and crawler queries. More is better. A wide variety of supported languages, will be more supporting for niche creation [17]. Data source: OSSECO content management system. A NC-ViOPT Variety in OSSECO project technologies. Does the OSSECO projects support different technologies? Read information from OSSECO data sources. Identify the OSSECO development technologies.
Data base and crawler queries wide variety of technologies, will be more supporting for niche creation [17]. Data source: OSSECO version control repository system and content management system. Experts: OSSECO members. A NC-NoOPE Number of OSSECO platform extensions How many platform extensions have the OSSECO? Obtain the number of extensions from the version control repository system.
Data base query. More is better.
Each extension is a potential ecosystem niche Data source: OSSECO content management system. A NC-NoNoO Number of niches of the OSSECO
How many niches have the OSSECO?
Obtain the number of niches.
Data base query and Surveys.
More is better. Data source:
OSSECO version control system. Experts: OSSECO members. H
OSSECO Knowledge
The open and shared development practices in OSSECOs allow to contributors adding
knowledge such as aggregated information, blog posts, and manuals into a common
knowledge base and code repositories, indicating also that the OSSECO is healthy
[17]. Table 14 shows the
OSSECO Knowledge
measures.
Table 14:
OSSECO Knowledge measures.
Cod. Name Purpose Method Procedure Interpretation Source Type
OK-NoAT
Number of activity types
How many types of activities has the OSSECO?
Obtain the type of activity of the OSSECO members.
Data base query and surveys. More is better [34]. Data source: OSSECO version control repository system. Experts: OSSECO members. H OK-NoOA Number of OSSECO artifacts Are the contributors adding knowledge to the OSSECO? Crawl (Counting the knowledge artifacts). Some artifacts can be: A= Blog posts. B= Manuals. C= Translations. D= Marketing materials. E= Scientific papers.
Crawler query. More is better
[17]. Data source: OSSECO content management system, OSSECO Wikis and digital libraries. H
Vitality
Vitality is the viability and the ability of an OSSECO to expand (i.e., robustness,
ability to increase size and strength) of the ecosystem [QuESo Li et al., 2013). Vitality
related metrics are based on the number of distinct OSSECO members, resources and
activities in time intervals. Table 15 shows the
Vitality
measures.
Table 15:
Visibility measures
Cod. Name Purpose Method Procedure Interpretation Source Type
V-LoP Liquidity of
partners
Can the partner to meet your short-term obligations?
Obtain the financial data from the partner. Calculate de Liquidity for each partner in the OSSECO. Count the number of partners with liquidity ¡ 1. LoP=short-term assets / short term liabilities
Less is better. X<1 is
dangerous for the partner. 1<= X<= 2 is normal. X>2 is good [5]. Data source: OSSECO public partners data. Experts: OSSECO members. H V-MSoOP Market share of OSSECO projects How is the OSSECO projects market shared? We need to do end-user surveys in order to collect the knowledge and information that is already available, such as market reports, open source evaluations, and other platform popularity data. Finally, on an aggregate level we can analyze, using source code and manifest analysis, how frequently a project is required and used by other projects.
Data base query and surveys. More is better [17]. Data source: OSSECO content management system, mailing lists and code repositories. Furthermore, if it is possible, to identify the OSSECO-code inclusion in other projects and software ecosystem [17]. Experts: OSSECO final-users. H
Cod. Name Purpose Method Procedure Interpretation source V-SoP Solvency of partners Can the OSSECO partners pay their debts? Obtain the financial data from the partner. Calculate de solvency for each partner in the OSSECO. Count the number of partners with solvency<1. X=partner’s equity /partner’s liabilities. Low is better. 0<= X<1 is normal 0<=1/3 may be financial problems X<0 negative equity. X>1 conservatively financed [5]. Data source: OSSECO partners public data. Experts: OSSECO partners. H V-BoAP Buildup of assets of partners How is the OSSECO partners productivity? Obtain financial data from the partners. Calculate the total factor productivity over time.
Surveys High is better [5] Data source:
OSSECO partners public data. Experts: OSSECO partners. H V-LO Limited obsolescence
Are the OSSECO infrastructure obsolete? Obtain information about OSSECO technologies.
Crawler query. No obsolete is
better [27]. Data source: OSSECO content management system. Experts: OSSECO members. A V-CoUEaUC Continuity of use experience and use cases
How to the OSSECO evolve in response to new technologies? Obtain list of projects releases technologies information. Compare releases evolve with OSSECO-community platform evolve and programing languages and operating system evolving. Crawler query. Surveys. Evolve more rather than changing abruptly is better. OSSECO: Content management system. General context of the technologies. A V-OCA OSSECO community acceptance How is the OSSECO community acceptance by commercial organizations? Obtain information from partnerships about OSSECO acceptance.
Surveys High OSSECO
acceptance is better [17] Data source: OSSECO Content management system Experts: OSSECO Partners. A V-NoPU Number of passive users it is equal to S-NoPU More is better. Passive users are essential for a sustainable OSS-ecosystem [22] H V-NoNC Number of new communities
Are the OSSECO creating new communities continuously Count the number of new communities in a period of time.
Data base query. More is better
[17]. Data source: OSSECO mailing lists and version control repository system. H V-OPaE OSSECO partnership and embed-dedness How is the OSSECO embeddedness? Obtain information about partnership model [17].
Surveys. High embedded
is better [17] Data source:Version control repository system. A
Trustworthiness
OSSECO Trustworthiness is the ability to establish a trusted partnership of shared
responsibility in building an extended period of time [32]. Table 16 shows the
Trust-worthiness
measures.
Table 16:
Trustworthiness measures.
Cod. Name Purpose Method Procedure Interpretation Source Type
T-ZSoP ZETA score
of partners How is bankruptcy score of the OSSECO partners? Obtain the financial data from the partner. Test the creditworthiness and solvency of a partner [5]. Count the number of OSSECO partners with ZETA score below 1.8. ZETA score =1.2A+1.4B+3.3C+0.6D+1.0E A = Working Capital/Total Assets B = Retained Earnings/Total C = Earnings Before Interest Tax/Total Assets D = Market Value of Equity/Total Liabilities E = Sales/Total Assets (P4 Altman)
Surveys High is better.
A score below 1.8 means the company is probably headed for bankruptcy [5] Data source: partners public financial data. Experts OSSECO partners. H T-OA OSSECO Age
How old is the OSS-ecosystem? Calculate lifetime of the OSSECO OE= B-A A= Date of first commit B= Date of last commit Older is better [29]. Data source: OSSECO version control repository system. A T-NoPoP Number of patents of partners How many patents has the OSSECO partners? Count the number of patents of the OSS- ecosystem partners.
Surveys More is better
[17] Data source: OSSECO partners. A T-CRaR Contributor ratings and reputation How is the OSSECO contributors reputation? Obtain contributors data from OSSECO datasources and surveys. ET=
P
n T F R(ri) n TFR= Time interval for first to a request i n= number of OSSECO requests. Can be established by looking at the contributor standing in the community, their numbers of commits, their individual bug x times. High is better [17]. High contributors ranking implies more Trustworthiness. Data sources: OSSECO content management system. Experts: OSSECO members. AReferences
[1] R. Abreu and R. Premraj, “How developer communication frequency relates to
bug introducing changes,” in
Proceedings of the IWPSE and Evol Workshops
,
(New York, NY, USA), pp. 153–158, ACM, 2009.
[2] N. Bettenburg, A. Hassan, B. Adams, and D. German, “Management of
com-munity contributions,”
Empirical Software Engineering
, pp. 1–38, 2013. P67.
[3] P. Bonacich, “Power and centrality: A family of measures,”
American journal of
sociology
, pp. 1170–1182, 1987.
[4] N. Dai, W. Thronicke, A. R. Lopez, F. C. Latasa, E. Zeeb, C. Fiehe, A. Litvina,
J. Krueger, O. Dohndorf, I. Agudo,
et al.
, “OSAMI Commons - An open dynamic
services platform for ambient intelligence,” in
Proceedings of the 16
th
ETFA
,
pp. 1–10, IEEE, 2011.
[5] E. den Hartigh, W. Visscher, M. Tol, and A. J. Salas,
Measuring the health of a
business ecosystem
, ch. 11, pp. 221–246. Vol. 1 of [18], 1
st
ed., 2013.
[6] D. Dhungana, I. Groher, E. Schludermann, and S. Biffl, “Software ecosystems vs.
natural ecosystems: learning from the ingenious mind of nature,” in
Proceedings
of the 4
th
ECSA
, pp. 96–102, ACM, 2010.
[7] J. Donald Wynn,
Emerging Free and Open Source Software Practices
, ch.
As-sessing the Health of an Open Source Ecosystem, pp. 238–258. Idea Group
Publishing, 2007.
[8] M. Foulonneau, R. Pawelzik, B. Gr´
egoire, and O. Donak, “Analyzing the open
source communities’ lifecycle with communication data,” in
Proceedings of the
5
th
MEDES
, pp. 340–344, ACM, 2013.
[9] O. Franco-Bedoya, D. Ameller, D. Costal, and X. Franch, “Queso: A quality
model for open source software ecosystems,” in
Proceedings of the 9
th
Interna-tional Conference on Software Engineering and Applications. ICSOFT-EA
, July
2014.
[10] J. Gamalielsson, B. Lundell, and B. Lings, “The Nagios community: An extended
quantitative analysis,” in
Proceedings of the 6
th
OSS
, pp. 85–96, Springer, 2010.
[11] M. Goeminne and T. Mens, “A framework for analysing and visualising open
source software ecosystems,” in
Proceedings of IWPSE-EVOL
, pp. 42–47, ACM,
2010.
[12] M. Goeminne and T. Mens,
Analyzing ecosystems for open source software
de-veloper communities
, ch. 12, pp. 247–275. Vol. 1 of [18], 1
st
ed., 2013.
[13] V. K. Gurbani, A. Garvert, and J. D. Herbsleb, “Managing a corporate open
source software asset,”
Communications of the ACM
, vol. 53, no. 2, pp. 155–159,
2010.
[14] H. Haken, “Synergetics,”
Naturwissenschaften
, pp. 121–128, 1980.
[15] M. Iansiti and R. Levien, “Keystones and dominators: framing operating and
technology strategy in a business ecosystem,” tech. rep., Harvard Business
School, 2004.
[16] ISO/IEC 25010, “Systems and software engineering systems and software quality
requirements and evaluation (square) system and software quality models,” 2011.
[17] S. Jansen, “Measuring the health of open source software ecosystems: Beyond the
scope of project health,”
Information and Software Technology
, vol. 56, no. 11,
pp. 1508 – 1519, 2014. Special issue on Software Ecosystems P68.
[18] S. Jansen, S. Brinkkemper, and M. Cusumano,
Software Ecosystems: Analyzing
and Managing Business Networks in the Software Industry
. Cheltenham, UK:
Edward Elgar Publishing, 1
st
ed., 2013.
[19] S. Jansen, S. Brinkkemper, and A. Finkelstein, “Business network management
as a survival strategy: A tale of two software ecosystems.,” in
Proceedings of the
1
st
Workshop on Software Ecosystems. CEUR-WS
, pp. 34–48, 2009.
[20] C. Jergensen and A. Sarma, “The onion patch: migration in open source
ecosys-tems,” in
Proceedings of the 19
th
SIGSOFT and 13
th
ESEC/FSE
, pp. 70–80,
ACM, 2011.
[21] J. Kabbedijk and S. Jansen, “Steering insight: An exploration of the ruby
soft-ware ecosystem,” in
Proceedings of the 2
nd
ICSOB
, pp. 44–55, Springer, 2011.
[22] T. Kilamo, I. Hammouda, T. Mikkonen, and T. Aaltonen, “From proprietary
to open source-Growing an open source ecosystem,”
Journal of Systems and
Software
, vol. 85, no. 7, pp. 1467–1478, 2012.
[23] X. Li, X. Jie, Q. Li, and Q. Zhang, “Research on the Evaluation of Business
Ecosystem Health,” in
Proceedings of the 6
th
ICMSEM
, pp. 1009–1020, Springer,
2013.
[24] S. Lohmann, S. Negru, F. Haag, and T. Ertl, “Visualizing ontologies with
VOWL,”
Semantic Web
, pre-print.
[25] G. Lucassen, K. van Rooij, and S. Jansen, “Ecosystem health of cloud paas
providers,” in
Software Business. From Physical Products to Software Services
and Solutions
(G. Herzwurm and T. Margaria, eds.), vol. 150 of
Lecture Notes in
Business Information Processing
, pp. 183–194, Springer Berlin Heidelberg, 2013.
[26] B. Lundell and B. Forssten, “Exploring health within OSS ecosystems,” in
Pro-ceedings of the 1
st
OSCOMM
, pp. 1–5, 2009.
[27] K. Manikas and K. M. Hansen, “Reviewing the health of software
ecosystems-a conceptuecosystems-al frecosystems-amework proposecosystems-al.,” in
proceedings of the 5
th
IWSECO-ICSOB
,
pp. 33–44, 2013.
[28] T. Mens, M. Claes, P. Grosjean, and A. Serebrenik,
Studying evolving software
ecosystems based on ecological models
, pp. 297–326. Springer Berlin Heidelberg,
2014.
[29] T. Mens and M. Goeminne, “Analysing the Evolution of Social Aspects of Open
Source Software Ecosystems,” in
Proceedings of the 3
rd
IWSECO)
, pp. 1–14,
2011.
[30] S. Neu, M. Lanza, L. Hattori, and M. D’Ambros, “Telling stories about GNOME
with Complicity,” in
Proceedings of the 6
th
VISSOFT
, pp. 1–8, IEEE, 2011.
[31] R. E. Rolfe, “Social cohesion and community resilience: A multi-disciplinary
review of literature for rural health research,”
Halifax: Department of
Inter-national Development Studies Faculty of Graduate Studies and Research Saint
Marys University
, 2006.
[32] M. Soto and M. Ciolkowski, “The QualOSS open source assessment model
mea-suring the performance of open source communities,” in
Proceedings of the 3
rd
ESEM
, pp. 498–501, 2009.
[33] F. van der Linden, B. Lundell, and P. Marttiin, “Commodification of Industrial
Software: A Case for Open Source,”
IEEE Software
, vol. 26, no. 4, pp. 77–83,
2009.
[34] B. Vasilescu, A. Serebrenik, M. Goeminne, and T. Mens, “On the variation
and specialisation of workloada case study of the gnome ecosystem community,”
Empirical Software Engineering
, vol. 19, no. 4, pp. 955–1008, 2014.
[35] M. Viljainen and M. Kauppinen,
Framing management practices for keystones
in platform ecosystem
, ch. 7, pp. 121–137. Vol. 1 of [18], 1
st
ed., 2013.
[36] T. Yamakami, “A three-layer view model of OSS: Toward understanding of
di-versity of OSS,” in
Proceedings of the 13
th
ICACT
, pp. 1190–1194, IEEE, 2011.
[37] L. Yu, J. Cawley, and S. Ramaswamy, “Entropy-Based Study of Components in
Open-Source Software Ecosystems,”
INFOCOMP Journal of Computer Science
,
vol. 11, no. 1, pp. 22–31, 2012.