SCHOOL OF ELECTRICAL AND ELECTRONIC ENGINEERING
ELECTRIC POWER SYSTEMS RESEARCH GROUP
INVESTIGATION OF ENERGY
STORAGE SYSTEM AND
DEMAND SIDE RESPONSE FOR
DISTRIBUTION NETWORKS
A THESIS PRESENTED FOR THE DEGREE OF
DOCTOR OF PHILOSOPHY
Jialiang Yi February 2016
i
Abstract
The UK government has a target of achieving an 80% reduction in CO2 emissions with respect to the values from 1990 by 2050. Therefore, renewables based distributed generations (DGs) coupled with substantial electrification of the transport and heat sectors though low carbon technologies (LCTs), will be essential to achieve this target. The anticipated
proliferation of these technologies will necessitate major opportunities and challenges to the operation and planning of future distribution networks.
Smartgrid technologies and techniques, such as energy storage systems (ESSs), demand side response (DSR) and real time thermal ratings (RTTRs), provide flexible, economic and expandable solutions to these challenges without resorting to network reinforcement. This research investigates the use of ESS and DSR in future distribution networks to facilitate LCTs with a focus on the management and resolution of thermal constraints and steady state voltage limit violation problems. Firstly, two control schemes based on sensitivity factors and cost sensitivity factors are proposed. Next, the impacts of a range of sources of uncertainties, arising from existing and future elements of the electrical energy system, are studied. The impacts of electric vehicle charging are investigated with Monte Carlo simulation (MCS). Furthermore, to deal with uncertainties efficiently, a scheduling scheme based on robust optimization (RO) is developed. Two approaches have been introduced to estimate the trade-off between the cost and the probability of constraint violations. Finally, the performance of this scheme is evaluated.
The results of this research show the importance of dealing with uncertainties appropriately. Simulation results demonstrate the capability and effectiveness of the proposed RO based scheduling scheme to facilitate DG and LCTs, in the presence of a range of source of uncertainties. The findings from this research provide valuable solution and guidance to facilitate DG and LCTs using ESS, DSR and RTTR in future distribution networks.
iii
Declaration
I hereby declare that this thesis is a record of work undertaken by myself, that it has not been the subject of any previous application for a degree, and that all sources of information have been duly acknowledged.
v
Acknowledgement
I would like to express my gratitude to my supervisors, Professor Phil Taylor and Dr Pádraig Lyons. Without their support, supervision, expertise, efforts, encouragement and inspiration, this research would have been impossible. The lessons they have taught me go far beyond the PhD.
I would like to thank Northern Powergrid for the supports during and after the Customer-led Network Revolution project. Special thanks to Ian Lloyd, Rosie Hetherington, Stuart Brown, Andrew Webster and David Miller for providing support, data, network models and especially their expertise and experiences.
I would like to thank all the colleagues in the CLNR project, Robin Wardle, Dr Lorna Bang, Peter Davison and Dr Pengfei Wang. This project has been an unforgettable journey. At the same time, I must acknowledge my colleagues in the electric power group especially Dr Neal Wade, Myriam Neaimeh, Dr Simon Blake, Dr Mansoureh Zangiabadi, Dr Haris Patsios, Dr Tianxiang Jiang, Dr David Greenwood and Dr Lei Wang for all the collaborations, advices and helpful discussions. Most importantly I would like to thank you all for your friendship and all the happy and sour moments we shared together.
Above all, I would like to thank my parents for their unwavering love, faith and support (mentally and financially!). None of these would have been possible if they have ever given up on me since I was born.
vii
List of Publications
Journal Papers
J. Yi, P. Lyons, P. Davison, P. Wang, P. Taylor, "Robust Scheduling Scheme for Energy Storage to Facilitate High Penetration of Renewables," IEEE Transactions on Sustainable Energy,. 7(2): 797-807.
M. Neaimeh, R. Wardle, A. Jenkins, J. Yi , G. Hill, P. Lyons, Y. Hübner, P. Blythe, P. Taylor, (2015). "A probabilistic approach to combining smart meter and electric vehicle charging data to investigate distribution network impacts." Applied Energy 157(0): 688-698.
P. Wang, D. H. Liang, J. Yi, P. F. Lyons, P. J. Davison, and P. C. Taylor, "Integrating Electrical Energy Storage Into Coordinated Voltage Control Schemes for Distribution Networks," Smart Grid, IEEE Transactions on, vol. 5, pp. 1018-1032, 2014.
Conference papers
J. Yi, P. Wang, P. C. Taylor, P. J. Davison, P. F. Lyons, D. Liang, et al., "Distribution network voltage control using energy storage and demand side response," in
Innovative Smart Grid Technologies (ISGT Europe), 2012 3rd IEEE PES International Conference and Exhibition on, 2012, pp. 1-8.
P. Wang, J. Yi, P. Lyons, D. Liang, P. Taylor, D. Miller, et al., "Customer Led Network Revolution - Integrating renewable energy into LV networks using energy storage," in
Integration of Renewables into the Distribution Grid, CIRED 2012 Workshop, 2012, pp. 1-4.
M. Neaimeh, G. Hill, P. Blythe, R. Wardle, J. Yi, and P. Taylor, "Integrating smart meter and electric vehicle charging data to predict distribution network impacts," in
Innovative Smart Grid Technologies Europe (ISGT EUROPE), 2013 4th IEEE/PES, 2013, pp. 1-5.
S. Blake, J. Yi, P. Taylor, D. Miller, and I. Lloyd, "Using electrical energy storage to support customers under faulted network conditions," in Electricity Distribution (CIRED 2013), 22nd International Conference and Exhibition on, 2013, pp. 1-4.
viii Selected Reports
J. Yi and S. Blake, "Analysis of Industrial and Commercial Demand Side Response for Powerflow Management", CLNR trial Analysis, 2014. Available:
http://www.networkrevolution.co.uk/wp-content/uploads/2014/12/CLNR-Trial-Analysis-IC-DSR-for-Powerflow-Management.pdf
J. Yi and P. Lyons, “Electrical Energy Storage 1 (2.5MVA/5MWh) and Enhanced Automatic Voltage Control”, CLNR trial Analysis, 2014. Available:
http://www.networkrevolution.co.uk/wp-content/uploads/2014/12/CLNR-L119-CLNR-Trial-Analysis-EES1-and-EAVC1-Voltage-Control-at-Rise-Carr.pdf
J. Yi, T. Jiang, P. Davison and P. Lyons, “Electrical Energy Storage 1
(2.5MVA/5MWh) Powerflow Management at Rise Carr” , CLNR trial Analysis, 2014. Available: http://www.networkrevolution.co.uk/wp-content/uploads/2014/12/CLNR-Trial-Analysis-EES1-Powerflow-Management-at-Rise-Carr.-2pdf.pdf
J. Yi and P. Lyons, “Industrial and Commercial Demand Side Response + Grand Unified Scheme Voltage Control”, CLNR trial Analysis, 2014. Available:
http://www.networkrevolution.co.uk/wp-content/uploads/2014/12/CLNR-Trial-Analysis-IC-DSR-and-GUS-Voltage-Control.pdf
T. Jiang, J. Yi, S. Blake and P. Lyons, “Residential Demand Side Response for Powerflow Management”, CLNR trial Analysis, 2015. Available:
http://www.networkrevolution.co.uk/wp-content/uploads/2015/04/CLNR-L223-Residential-DSR-for-Powerflow-Management-v0-5.pdf
T. Jiang, P. Lyons, P. Wang and J. Yi, “Electrical Energy Storage 2 (100kVA/200kWh) Powerflow Management”, CLNR trial Analysis, 2014. Available:
http://www.networkrevolution.co.uk/wp-content/uploads/2014/12/CLNR-Trial-Analysis-EES2-Autonomous-Powerflow.pdf
P. Wang, T. Jiang, P. Lyons and J. Yi “Tap changing Secondary Transformer
Autonomous and Grand Unified Scheme voltage control” , CLNR trial Analysis, 2014. Available: http://www.networkrevolution.co.uk/wp-content/uploads/2014/12/CLNR- Trial-Analysis-Tapchanging-Secondary-Transformer-Automonous-and-GUS-Voltage-Control1.pdf
P. Lyons, T. Jiang, P. Wang and J. Yi “Analysis of collaborative voltage control on high voltage and low voltage networks”, CLNR trial Analysis, 2014. Available:http://www.networkrevolution.co.uk/wp-content/uploads/2014/12/CLNR-L135-CLNR-Trial-Analysis-Collaborative-voltage-control-on-HV-and-LV-networks.pdf
ix
Acronyms
Acronym Definition
ANN Artificial neural network
AC Alternating current
ARMA Autoregressive moving average
ASHP Air source heat pump
BESS Battery energy storage systems
BoU Budget of uncertainty
BPNN Back-propagation neural network
CB Capacitor bank
CBM Cumulant-based method
CCP Chance constraint programming
CHP Combined heat and power
CLNR Customer led network revolution
CoP Coefficient of performance
CSF Cost sensitivity factor
DC Direct current
DCOPF Direct current optimal power flow
DG Distributed generation
DLC Direct load control
DN Distribution network
DNO Distribution network operator
DoD Depth of discharge
DSM Demand side management
DSR Demand side response
x
ESS Energy storage system
EV Electric vehicle
EWH Electric water heater
GB Great Britain
GP Gaussian processes
HIL Hardware in the loop
HV High voltage
I&C Industrial and commercial
ICT Information and communications technology
LCT Low carbon technology
LV Low voltage
MAPE Mean absolute percentage error
MCS Monte Carlo Simulation
M-GRNN Modified general regression neutral network MODM Multi-objective decision making
MV Medium voltage
OBoU Optimal budget of uncertainty
OHL Overhead line
OLTC On load tap changer
OPF Optimal power flow
PDF Probability density function PEM Price elasticity matrices
PEM Point estimation methods
PFCSF Power flow cost sensitivity factor PFF Participation factor forecaster
xi PFSF Power flow sensitivity factor
PHS Pumped hydroelectric storage
PoS Probability of success
PSO Partial swarm optimization
PV Photovoltaic
RBFNN Radial basis function neural network
RDSR Residential DSR
RES Renewable energy sources
RMSE Root means square error
RO Robust optimization
RTP Real time price
RTTR Real time thermal rating
SD Standard deviation
SF Sensitivity factor
SME Small and medium enterprise
SO Stochastic optimization
SoC State-of-Charge
SoH State-of-Health
ST Short term
STLF Short term load forecast
ToU Time of use
UC Unit commitment
V2G Vehicle to grid
VCSF Voltage cost sensitivity factor VSF Voltage sensitivity factor
xii VSTLF Very short term load forecast
xiii
Nomenclature
Symbol Definition Unit
∆𝑉 voltage change pu
𝑉𝑆 nominal voltage Pu
𝑃𝐸𝑆𝑆 real power import/export from ESS kW/MW
𝑄𝐸𝑆𝑆 reactive power import/export from ESS kVAr
𝑅 resistance
𝑋 inductive reactance
𝑉𝑆𝐹𝑖,𝑘
voltage sensitivity factor from bus 𝑘 to bus 𝑖 which represents the voltage change at bus 𝑖 due to the power injection at bus 𝑘
pu/kW
∆𝑉𝑖 voltage change at bus 𝑖 pu
∆𝑃𝑘 real power injection change at bus 𝑘 kW/MW
∆𝑄𝑘 reactive power injection change at bus 𝑘 kVAr
∆𝑆𝑘 apparent power injection change at bus 𝑘 kVA
𝜽 vector of angle difference between busbars Radian
𝑽 vector of voltage of busbars N/A
𝑱 Jacobian matrix N/A
𝑱−𝟏 inverse Jacobian matrix N/A
𝑷 vector of net real power injection N/A
𝑸 vector of net reactive power injection N/A
𝜕∆𝜽 𝜕𝑷
⁄ matrix for the partial derivatives of 𝜽to∆𝑷 N/A
𝜕∆𝜽 𝜕𝑸
⁄ matrix for the partial derivatives of 𝜽 to ∆𝑸 N/A
𝜕∆𝑽 𝜕𝑷
⁄ matrix for the partial derivatives of ∆𝑽 to 𝑷 N/A
𝜕∆𝑽 𝜕𝑸
⁄ matrix for the partial derivatives of ∆𝑽 to 𝑸 N/A
𝑃𝐹𝑆𝐹𝑖𝑗,𝑘 Power flow sensitivity factor from bus 𝑘 to branch 𝑖𝑗 MVA
∆𝑆𝑖𝑗 apparent power flow change of branch 𝑖𝑗 kVA
𝑉𝐶𝑆𝐹𝑖,𝑘 voltage cost sensitivity factor from bus 𝑘 to bus 𝑖 pu/£
𝐶𝑘 the cost of real power injection at bus 𝑘 MW/£
𝑃𝐹𝐶𝑆𝐹𝑖,𝑘 power flow cost sensitivity factor from bus 𝑘 to bus 𝑖 MVA/£
xiv
𝐶𝐸𝑆𝑆,𝐷𝑖𝑠𝑐ℎ𝑎𝑟𝑔𝑒 cost for discharging ESS £/kW
𝐶𝐶𝑎𝑝𝑖𝑡𝑎𝑙,𝐸𝑆𝑆 capital cost of ESS £
𝑁𝐶𝑦𝑐𝑙𝑒,𝐸𝑆𝑆
total charge and discharge cycle over the lifetime of the selected ESS
N/A
𝑃𝐸𝑆𝑆,𝑅𝑎𝑡𝑖𝑛𝑔 rated real power output of the ESS kW
𝑆𝑜𝐶 State-of-Charge %
𝑆𝑜𝐶𝑈𝑝𝑝𝑒𝑟𝑙𝑖𝑚𝑖𝑡 the upper limit for SoC %
𝑘𝐸𝑆𝑆
is a factor represents the impact of SoC on the cost of operating the ESS. This reflects a disincentive to discharging the ESS at a low state of charge and a disincentive to charging the ESS at a high SoC
N/A
𝐶𝑅𝐷𝑆𝑅 is the cost of RDSR service per kW £/kW
𝐶𝐶𝑎𝑝𝑖𝑡𝑎𝑙,𝑅𝐷𝑆𝑅 is the cost of RDSR service per year £
𝑁𝑅𝐷𝑆𝑅 is the maximum number of service requests of RDSR in a
year
N/A
𝑃𝑅𝐷𝑆𝑅 is the reduction of RDSR customer consumption kW
𝐶𝐼&𝐶 is the cost of I&C service per kW £/kW
𝐶𝐶𝑎𝑝𝑖𝑡𝑎𝑙,𝐼&𝐶 is the total cost of I&C DSR service per year £
𝑁𝐼&𝐶 is the maximum number of service requests of I&C DSR in
a year
N/A
𝑃𝐼&𝐶 is the estimated real power reduction delivered by the I&C
DSR customer
kW
𝑃𝐸𝑆𝑆,𝑅𝑎𝑡𝑖𝑛𝑔 real power rating of ESS kW
𝑄𝐸𝑆𝑆,𝑅𝑎𝑡𝑖𝑛𝑔 reactive power rating of ESS kVAr
𝑆𝐸𝑆𝑆,𝑅𝑎𝑡𝑖𝑛𝑔 apparent power rating of ESS kVA
𝑉𝑆𝐹𝑃𝑖,𝐸𝑆𝑆 real power voltage sensitivity factor from ESS to busbar 𝑖 pu/kW
𝑉𝑆𝐹𝑄𝑖,𝐸𝑆𝑆
reactive power voltage sensitivity factor from ESS to busbar 𝑖
pu/kVAr
𝐸 Expectation N/A
𝑅𝑒𝑎𝑙𝑡 the real value N/A
𝑃𝑟𝑒𝑡 the predicted value N/A
𝑝𝑟 probability N/A
xv
𝜀 normalised prediction error N/A
μ mean N/A
σ standard deviation N/A
𝜅 kurtosis N/A
𝑅𝑀𝑆𝐸 root mean square error N/A
𝑞𝑐 convective heat exchange J
𝑞𝑠 impact of solar radiation J
𝑞𝑟 radiative heat exchange J
𝐶𝑞𝑟 a coefficient to account for factors such as emission effect N/A
𝒙 input vector N/A
𝒚 output vector N/A
𝑔() general nonlinear function N/A
ℎ() general nonlinear function for inequality constraints N/A
𝒃 theconstraints vector N/A
𝒄 vector of coefficients for the cost function N/A
𝒄′ inverse vector of coefficients for the cost function N/A
𝑨 matrix of constants for constraints N/A
𝑎𝑖𝑗 the nominal value of the elements of 𝑨 in the 𝑖
𝑡ℎ row and
the 𝑗𝑡ℎ column
N/A
𝑎̂𝑖𝑗 maximum variation of 𝑎𝑖𝑗 N/A
𝑎̃𝑖𝑗 real value of 𝑎𝑖𝑗 N/A
𝑫 matrix of coefficients for equality constraints N/A
𝒆 right hand side vector of equality constraints N/A
𝒍 lower limit of decision variables N/A
𝒖 upper limit of decision variables N/A
𝒘 maximum of the cost function N/A
𝑇 total number of timesteps N/A
𝑡 number of timestep, integer between 0 to 𝑇 N/A
𝑁𝐸𝑆𝑆 total number of ESS N/A
𝐶𝐸𝑆𝑆𝑚 cost of charging or discharging ESS 𝑚 £/kW
𝑃𝐸𝑆𝑆𝑡 𝑚 power import/export of ESS 𝑚 at time 𝑡 kW
𝑘1 positive coefficient N/A
xvi
𝐶𝐸𝑆𝑆𝑚,𝐶𝑎𝑝𝑖𝑡𝑎𝑙 capital cost of ESS 𝑚 £
𝑆𝑜𝐻𝐸𝑆𝑆𝑚 State-of-Health of ESS 𝑚 N/A
𝑆𝑖𝑗,𝐹𝑜𝑟𝑒𝑐𝑎𝑠𝑡𝑡 forecasted load flow through branch 𝑖𝑗 at time 𝑡, based on powerflow calculations at the forecast stage
MVA
𝑃𝐹𝑆𝐹𝑖𝑗,𝐸𝑆𝑆𝑡 𝑚 PFSF of ESS 𝑚 to branch 𝑖𝑗 at time 𝑡 MVA/MW
𝑃𝐹𝑆𝐹𝑖𝑗,𝑅𝐸𝑆𝑡 𝑛 PFSF of RES 𝑛 to branch 𝑖𝑗 at time 𝑡 MVA/MW
𝑃𝐹𝑆𝐹𝑖𝑗,𝐵𝑢𝑠𝑡 𝑝 PFSF of busbar 𝑝 to branch 𝑖𝑗 at time 𝑡 MVA/MW
𝑁𝐸𝑆𝑆 total number of ESS N/A
𝑁𝑅𝐸𝑆 total number of renewable energy sources N/A
𝑁𝐵𝑢𝑠 total number of buses N/A
∆𝑃𝑅𝐸𝑆𝑡 𝑛 error of RES power output at time 𝑡 MW
∆𝑃𝐵𝑢𝑠𝑡 𝑝 error of RES power output at time 𝑡 MW
𝑃𝑅𝐸𝑆𝑡 𝑛,𝐹𝑜𝑟𝑒𝑐𝑎𝑠𝑡 the forecasted output of RES 𝑛 at time 𝑡 MW
𝑃𝐵𝑢𝑠𝑡 𝑝,𝐹𝑜𝑟𝑒𝑐𝑎𝑠𝑡 the forecasted load of busbar 𝑝 at time 𝑡 MW
𝑉𝑀𝑖𝑛,𝑖 lower voltage limits of busbar 𝑖 pu
𝑉𝑀𝑎𝑥,𝑖 upper voltage limits of busbar 𝑖 pu
𝑉𝑖,𝐹𝑜𝑟𝑒𝑐𝑎𝑠𝑡𝑡 forecasted voltage of busbar 𝑖 at time 𝑡 based on load flow
calculations at the forecast stage
pu
𝑉𝑆𝐹𝑖,𝐸𝐸𝑆𝑡 𝑚 voltage sensitivity factor from ESS 𝑚 to busbar 𝑖 at time 𝑡 pu
𝑉𝑆𝐹𝑖,𝑅𝐸𝑆𝑡 𝑛 voltage sensitivity factor from RES 𝑛 to busbar 𝑖 at time 𝑡 pu
𝑉𝑆𝐹𝑖,𝐵𝑢𝑠𝑝𝑡 voltage sensitivity factor from busbar 𝑝 to busbar 𝑖 at time
𝑡
pu
𝑆𝑜𝐶𝐸𝑆𝑆𝑡 𝑚 SoC of ESS at time 𝑡 %
∆𝑡 duration of each timestep N/A
𝜂𝐸𝑆𝑆𝑚,𝑑𝑖𝑠𝑐ℎ𝑎𝑟𝑔𝑒 discharge efficiency of ESS 𝑚 %
𝜂𝐸𝑆𝑆𝑚,𝑐ℎ𝑎𝑟𝑔𝑒 charge efficiency of ESS 𝑚 %
𝑑𝐸𝑆𝑆𝑡 𝑚 binary variable, 𝑑 = 1 if discharge and 𝑑 = 0 if charge N/A
𝐸𝐸𝑆𝑆𝑚 energy capacity of the ESS 𝑚 kWh
𝑆𝑜𝐶𝐸𝑆𝑆𝑡 𝑚,𝑀𝑖𝑛 lower limit of SoC for ESS 𝑚 at time 𝑡 %
𝑆𝑜𝐶𝐸𝑆𝑆𝑡 𝑚,𝑀𝑎𝑥 upper limit of SoC for ESS 𝑚 at time 𝑡 %
xvii
𝑆̃𝑖𝑗,𝑅𝑇𝑇𝑅𝑡 uncertainty value of predicted RTTR of branch 𝑖𝑗 at time 𝑡 kVA
∆𝑃̃𝑅𝐸𝑆𝑡 𝑛 uncertainty value of predicted power output of RES 𝑛 at
time 𝑡
kW
∆𝑃̃𝐵𝑢𝑠𝑡 𝑝 uncertainty value of load forecast of busbar 𝑝 at time 𝑡 kW
𝑁𝑢 maximum number of uncertainty N/A
𝑁𝑇𝑜𝑡𝑎𝑙 total number of Monte Carlo samples N/A
𝑁𝑉𝑖𝑜 number of violations recorded. N/A
𝑁𝐷𝑆𝑅 total number of DSR N/A
𝑃𝐹𝑆𝐹𝑖𝑗,𝐷𝑆𝑅𝑡 𝑞 power flow sensitivity factor of DSR 𝑞 to branch 𝑖𝑗 MVA/MW
𝑉𝑆𝐹𝑖,𝐷𝑆𝑅𝑡 𝑞 voltage sensitivity factor of DSR 𝑞 to bus 𝑖 MVA/MW
𝑃𝐷𝑆𝑅𝑡 𝑞 power decrease or increase due to DSR 𝑞 kW
xix
Table of Contents
Chapter 1. Introduction ... 1
1.1 Background ... 1
1.1.1 Distributed Generation ... 2
1.1.2 Air Source Heat Pumps ... 2
1.1.3 Electric Vehicles ... 3
1.2 Challenges Faced by Conventional Distribution Networks ... 3
1.2.1 Voltage Control ... 4
1.2.2 Power Flow ... 4
1.2.3 Uncertainties ... 5
1.3 Energy storage ... 6
1.4 Demand Side Response ... 7
1.5 Real Time Thermal Rating ... 8
1.6 Research objectives ... 8
1.7 Thesis outline ... 9
Chapter 2. Literature Review... 11
2.1 Introduction ... 11
2.2 Energy Storage ... 11
2.2.1 Benefits of Energy Storage in Electrical Energy Systems ... 11
2.2.2 Grid Scale Energy Storage Technologies and Services... 12
2.2.3 Energy Storage Control and Scheduling ... 13
2.2.4 Use of Real and Reactive Power Ratio for Voltage Control and Power Flow Management ... 15
2.3 Demand side response ... 16
2.3.1 Benefits and Challenges of Demand Side Response ... 17
2.3.2 DSR Control and Scheduling ... 18
2.4 Coordinated ESS and DSR control ... 19
xx
Chapter 3. Sensitivity Factors and Sensitivity Factors Based Control Schemes ... 23 3.1 Introduction ... 23 3.2 Deriving Voltage Sensitivity Factor and Power Flow Sensitivity Factor from Jacobian Matrix ... 23
3.2.1 VSF ... 24 3.2.2 PFSF ... 25 3.3 VSF and PFSF Calculation Based on Incremental Method... 26 3.4 Sensitivity Factor Based Control Scheme ... 27 3.4.1 Proposed control scheme ... 28 3.4.2 Case Study Network... 30 3.4.3 Simulation results ... 37 3.5 Cost Sensitivity Factors ... 42 3.6 CSF Based Control Scheme... 43 3.6.1 Cost functions of DSR ... 43 3.6.2 Proposed Control Strategy ... 45 3.6.3 Case Study Network... 49 3.6.4 Results ... 56 3.6.5 Extension and Application of VCSF Based Control Scheme ... 59 3.7 The Limitation of VSF and PFSF ... 60 3.7.1 VSF ... 62 3.7.2 PFSF ... 64 3.8 Discussion and Conclusion ... 65 Chapter 4. Uncertainties in the Power System ... 69 4.1 Introduction ... 69 4.2 Source of uncertainty ... 69 4.2.1 Load Forecast Uncertainty ... 69 4.2.2 Wind Forecast and Windfarm Output Forecast ... 72 4.2.3 Real Time Thermal Rating ... 75
xxi
4.2.4 State-of-Charge ... 77 4.2.5 Industrial and Commercial DSR ... 78 4.3 Probabilistic Methods to Deal with Uncertainty ... 81 4.3.1 Introduction ... 81 4.3.2 Point Estimate Method ... 82 4.3.3 Cumulant-based method ... 84 4.3.4 Monte Carlo Simulation ... 85 4.3.5 Chance Constrained Programming Method ... 87 4.4 Investigating the Impact of EV Charging Using MCS ... 88 4.4.1 Data ... 88 4.4.2 Case Study Networks ... 90 4.4.3 MCS Study ... 92 4.4.4 Results ... 94 4.4.5 Conclusion ... 96 4.5 Robust optimisation... 97 4.6 Conclusion and discussion ... 100 Chapter 5. Introduction to Robust Optimisation ... 103 5.1 Introduction ... 103 5.2 Linear optimisation problem with uncertainty ... 103 5.2.1 Types of uncertainty ... 103 5.2.2 General formulation of a ULO problem ... 104 5.2.3 Uncertainty model ... 106 5.3 Robust optimization ... 107 5.3.1 Soyster’s formulation ... 107 5.3.2 Ben-Tal and Nemirovski’s formulation ... 108 5.3.3 Bertsimas and Sim’s formulation ... 109 5.4 Probability bounds of constraint violation ... 111 5.5 Probability of Success ... 113
xxii
5.6 Algorithm Implementation ... 114 5.6.1 Python Implementation ... 114 5.6.2 Evaluation with a 30 Variable Problem ... 115 5.7 Discussion and conclusion ... 118 Chapter 6. A Robust Optimisation Based Scheduling Scheme ... 119 6.1 Introduction ... 119 6.2 Proposed Scheduling Scheme ... 119 6.2.1 Forecast stage ... 120 6.2.2 Scheduling stage ... 120 6.2.3 Post-event analysis ... 121 6.3 Problem Formulation without uncertainty ... 121 6.3.1 Objective function ... 121 6.3.2 Constraints ... 122 6.3.3 Generalization of the Proposed Formulation ... 126 6.4 Problem Formulation with Uncertainty ... 128 6.5 Optimal Budget of Uncertainty and Probability of Success Estimation ... 130
6.5.1 Estimation of OBoU Based on Probability Bounds of Constraint Violation (Bound 1) ... 131 6.5.2 Estimation of OBoU Based on MCS and Curve Fitting Technique ... 131 6.6 Extension of this formulation ... 134 6.6.1 Demand Side Response ... 134 6.6.2 Reactive Power ... 135 6.7 Discussion and Conclusion ... 135 Chapter 7. Evaluation of the Robust Optimization Based Scheduling Scheme and Case
Studies ... 137 7.1 Introduction ... 137 7.2 Optimal power flow ... 137 7.2.1 Standard alternate current optimal power flow ... 137
xxiii
7.2.2 Modified optimal power flow ... 139 7.2.3 Conservative form of optimal power flow ... 140 7.3 Case Study on IEEE 14 Bus Network ... 141 7.3.1 Case Study Network ... 141 7.3.2 Sources of Uncertainties ... 143 7.3.3 Optimal Budget of Uncertainty and Probability of Success Test Results ... 146 7.3.4 Verification of Estimated OBoU ... 148 7.3.5 Comparison with Optimal Power flow ... 152 7.4 IEEE 118 busbar network ... 154 7.5 Discussion and Conclusion ... 158 Chapter 8. Discussion ... 161 8.1 Introduction ... 161 8.2 Network Reinforcement vs Smartgrid Technologies and Techniques ... 161 8.3 Sensitivity Factors ... 163 8.3.1 Variation of Sensitivity Factors ... 163 8.3.2 Strength and Weakness of Sensitivity Factors ... 165 8.4 The Importance of Considering Uncertainty ... 166 8.5 The Impact of LCTs on Distribution Networks ... 167 8.6 Robust Optimization ... 167 8.6.1 RO and Other Methods to Deal with Uncertainty ... 168 8.6.2 Selection of Uncertainty Interval ... 169 8.6.3 MCS Based Curve Fitting Technique ... 170 Chapter 9. Conclusion ... 171 9.1 Overview ... 171 9.2 Conclusions ... 171 9.3 Future work ... 175 Appendix A. Loadflow Calculation ... 177 Appendix B. Code for Running Loadflows with EV and Smart Meter Profiles ... 185
xxiv
Appendix C. Moment, Central Moment and Cumulant... 191 Appendix D. Test case for Python Based Robust optimization solver ... 193 Appendix E. Robust Optimization Detailed Formulation ... 203 Appendix F. Curve fitting results ... 205 Normal distribution ... 205 Uniform distribution ... 205 Beta distribution ... 206 Reference ... 207
xxv
Table of Figures
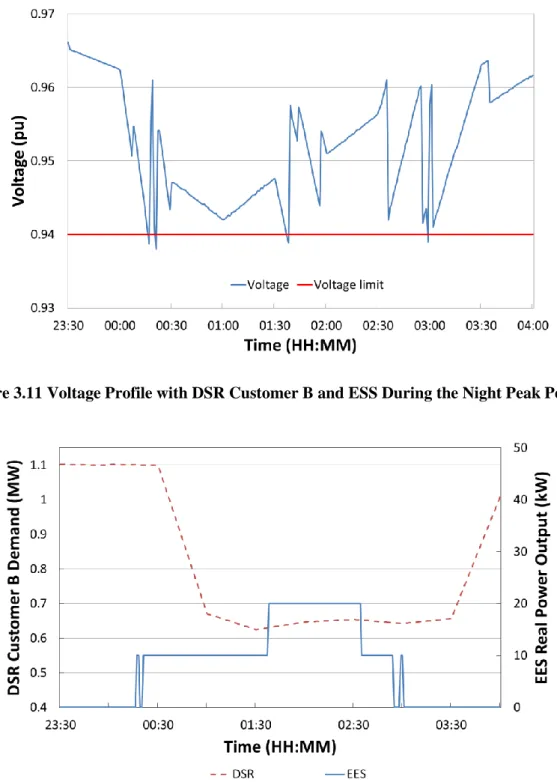
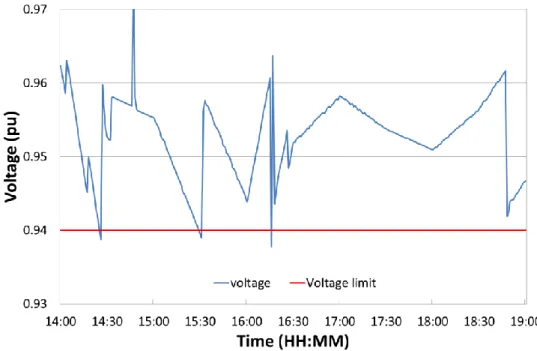
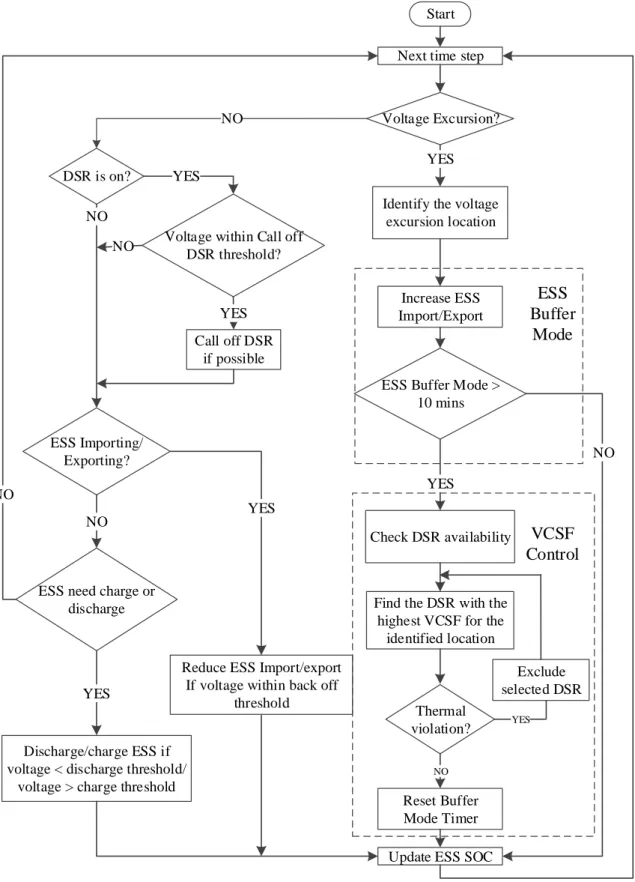
Figure 1.1 UK CO2 Emissions by Sector in Percentage of Total UK Emissions [2] ... 1 Figure 1.2 Installed Capacity of PV and Wind Generation in the UK from 2010 to 2014 [3] ... 2 Figure 2.1 Characteristics, State and Potential Application of Electrical Energy Storage Technologies [47] ... 13 Figure 2.2 Illustration of the Trade-off Between Real and Reactive Power ... 16 Figure 3.1 Incremental Method for Calculating VSF and PFSF ... 27 Figure 3.2 Flow Chart for Sensitivity Factor Based Control Scheme ... 29 Figure 3.3 Schematic Diagram of the 20kV Case-Study Network. ... 31 Figure 3.4 Current Load Profile in the case-Study Network ... 32 Figure 3.5 Model of LV Distribution Network ... 33 Figure 3.6 Probability of Vehicles Being at Home [104]. ... 34 Figure 3.7 Aggregated EV charging curve in the LCT cluster during night time. ... 35 Figure 3.8 Derived electrical demand for detached and semi-detached properties. ... 35 Figure 3.9 Aggregated ASHP electrical demand curve in the LCT cluster. ... 36 Figure 3.10 Voltage Profile in 24 Hours ... 37 Figure 3.11 Voltage Profile with DSR Customer B and ESS During the Night Peak Period .. 38 Figure 3.12 DSR Customer B Demand and Real Power Output of ESS... 38 Figure 3.13. Voltage profile at the end of the feeder with ESS control only during the morning peak period. ... 39 Figure 3.14. ESS real power output during the morning peak period. ... 40 Figure 3.15. Voltage Profile with ESS and DSR Customer A During the Afternoon Peak Period. ... 41 Figure 3.16. DSR customer a consumption and ESS real power output during the afternoon peak period. ... 41 Figure 3.17 Flow Chart of VCSF Voltage Control Strategy ... 47 Figure 3.18 ESS Real/Reactive Power Setpoint Algorithm ... 49 Figure 3.19 LV Network Diagram showing location of the EES device and connected loads. ... 50 Figure 3.20 Schematic diagram of the case-study network with future scenario industrial and commercial customers ... 51 Figure 3.21 Rurality filtered aggregated smart meter, simulated and simulated wet goods load profiles of non-gas connected customers... 52 Figure 3.22 Supervisory DSR control system architecture ... 55
xxvi
Figure 3.23 Voltage Profiles under Future Scenario Using Existing Network Infrastructure with No Control Actions ... 56 Figure 3.24 DSR profiles during MV voltage excursion control under future scenario with decentralised voltage control strategy ... 57 Figure 3.25 Voltage profiles with control actions under future scenario with decentralised voltage control strategy ... 57 Figure 3.26 Voltage Profiles with No Control Actions ... 58 Figure 3.27 DSR profiles during LV voltage excursion ... 59 Figure 3.28 Voltage profiles with control actions during LV voltage excursion ... 59 Figure 3.29 IEEE 14 Busbar Network ... 61 Figure 3.30 VSF based on Jacobian Matrix Method and Incremental Method ... 62 Figure 3.31 Voltage and Voltage Sensitivity Factor Change due to Power Injection ... 64 Figure 3.32 PFSF based on Jacobian Matrix Method and Incremental Method ... 64 Figure 4.1 Illustration of the Difference between the Distribution of Wind Speed (Left) and the Distribution of Wind Speed Error (Right) ... 72 Figure 4.2 Probability density of Wind Speed Forecast Errors (12hours ahead) for One of the test wind farms [121] ... 73 Figure 4.3 Probability density of Wind Power Forecast Errors (12hours ahead) for One of the test wind farms [121] ... 74 Figure 4.4 Comparison of a histogram of 24-h forecast error data (kurtosis 4.8) with Gaussian and Laplace pdf having the same standard deviation as the forecast error [123] ... 75 Figure 4.5 ESS Measured and Calculated SoC ... 78 Figure 4.6 I&C Customer A DSR profile in DSR trial A.1 ... 79 Figure 4.7 I&C Customer A DSR profile in DSR trial A.2 ... 79 Figure 4.8 I&C Customer B DSR profile in DSR trial B.1 ... 80 Figure 4.9 I&C Customer B DSR profile in DSR trial B.2 ... 81 Figure 4.10 Flowchart of Monte Carlo Study ... 86 Figure 4.11 Diagram of the 6.6 kV case-study urban network used in steady-state IPSA2 study ... 91 Figure 4.12 Diagram of the 20 kV case-study rural network used in steady-state IPSA2 study ... 91 Figure 4.13 UK generic network used in steady-state IPSA2 study ... 92 Figure 4.14 Example of peak day load profiles for 2 customers (#1 and #73) on the network for 2 different MCS runs (run #1 and 1000). Each MCS run generates a population of
xxvii
Figure 4.15 Test Day Critical Demand for Urban Network ... 94 Figure 4.16 Test Day Critical Demand for Rural Network. ... 95 Figure 4.17 Test Day Critical Demand for the Generic Network. ... 95 Figure 5.1 Probability of constraint violation with BoU of bound 1 and 2 for a ULO problem with 𝒏 = 𝟏𝟎 [192] ... 113 Figure 5.2 Flow Chart for the RO Solver in Python ... 114 Figure 5.3 Testing for a 30 Variable Problem ... 115 Figure 5.4 Test result of a 30 variable 50 constraints problem ... 116 Figure 5.5 Comparison of derived PoS based on equation (5.28) and MCS results ... 117 Figure 6.1 Proposed Scheduling Scheme ... 120 Figure 6.2 Estimation of OBoU Based on MCS and Curve Fitting Technique ... 132 Figure 7.1 IEEE 14 Busbar network ... 141 Figure 7.2 Windfarm Output ... 142 Figure 7.3 Apparent Power and RTTR of the Modelled Branch 13- 14 ... 142 Figure 7.4 Two sets of Beta Distributions, for series 1, 𝜶 = 2 and 𝜷 = 1.5, for series 2 𝜶 = 2 and 𝜷 = 4 ... 144 Figure 7.5 Windfarm Outputs with Uncertainty ... 145 Figure 7.6 Apparent Power and RTTR of the Modelled Branch... 146 Figure 7.7 PoS Test Results for All Cases at different BoU ... 148 Figure 7.8 Illustration of Different Types of Distributions ... 149 Figure 7.9 Curve Fitting Results of Case Study 1 ... 150 Figure 7.10 Curve Fitting Results of Case Study 2 ... 150 Figure 7.11 Curve Fitting Results of Case Study 3 ... 151 Figure 7.12 ESS Charge and Discharge Profiles in Case 1 ... 153 Figure 7.13 SoC Comparison in case 1 ... 153 Figure 7.14 IEEE 118 busbar network ... 155 Figure 7.15 RES output plot ... 156 Figure 8.1 Comparison of Different Approaches to Calculate Sensitivity Factors ... 164
xxviii
List of Tables
Table 1.1 EV Charing Connection Type and Power Range ... 3 Table 3.1 Voltage Sensitivity Factors for Critical Nodes (pu/100kW)... 53 Table 3.2 DSR Costs ... 54 Table 3.3 Voltage-Cost Sensitivity Factors for Critical Nodes (pu/£) ... 54 Table 3.4 VSF Results from Jacobian Matrix and Incremental Method based on ∆𝑷𝟏𝟐 =
𝟎. 𝟓𝐌𝐖 and ∆𝑷𝟏𝟐 = 𝟏𝟎𝐌𝐖 ... 63 Table 3.5 An Example of Two Available DSR Services to Solve an Thermal Violation ... 66 Table 4.1 Summary of Very Short Term and Short Term Load Forecast Results ... 71 Table 4.2 Environmental condition sensitivity analysis (parameter variation versus rating variation) [25] ... 77 Table 4.3 Summary of LV Network and Population Parameters ... 90 Table 4.4 Maximum Voltage Changes on the Test Networks (negative sign indicates a voltage drop) ... 96 Table 4.5 Maximum Voltage Changes in the Generic LV Network (negative sign indicates a voltage drop) ... 96 Table 4.6 Comparison of Different Techniques to Deal with Uncertainty ... 100 Table 7.1 Sources of Uncertainty and Uncertainty Intervals ... 143 Table 7.2Sources of Uncertainty and Uncertainty Intervals ... 144 Table 7.3 Two Sets of Beta Distributions ... 144 Table 7.4Input values for the curve fitting algorithm ... 147 Table 7.5 Calculated Parameters Based on LMA Curve Fitting Technique ... 147 Table 7.6Estimated OBoU for 97% and 100% PoS ... 147 Table 7.7OPTIMAL BOU FOR 97% AND 100%POS ... 151 Table 7.8PoS Test Results ... 152 Table 7.9 PoS of Estimated OBoU ... 154 Table 7.10 ESS in IEEE 118 Network ... 155 Table 7.11 Locations and Ratings of RESs ... 156 Table 7.12PoS Results for 100% PoS ... 157 Table 7.13Cost Results ... 157
1
Chapter 1.
Introduction
1.1Background
Governmental policy around the world is incentivising the decarbonisation of energy
infrastructure. The UK government, for example, has a target of achieving an 80% reduction in CO2 emissions with respect to the values from 1990 by 2050 [1]. In the UK, CO2 accounted for 74% of the UK’s greenhouse gas emissions in 1990 and increased to over 80% in 2013 [2]. Figure 1.1 shows a breakdown of CO2 emissions by sector, in percentage of UK total. Energy supply, transport, business and residential sectors account for 78% of total UK CO2 emissions in 2013. Energy supply was responsible for 32% of total CO2 emissions in the UK, 180.8 million tonnes of carbon dioxide equivalent, in 2013. Transport and residential sectors contribute 20% and 13% respectively of total CO2 emissions. Road transport and residential heating and cooking are large consumers of fossil fuels and are the most significant sources of emissions in the transport and residential sectors, respectively.
Figure 1.1 UK CO2 Emissions by Sector in Percentage of Total UK Emissions [2]
Therefore, renewables based electricity generation, from windfarms and photovoltaics coupled with substantial electrification of the transport and heat sectors though low carbon technologies (LCTs) such as electric vehicles (EVs) and air source heat pumps (ASHPs), will be essential to achieve the required reductions in carbon emissions. The anticipated
proliferation of these technologies in future energy systems will necessitate major changes to the operation and planning of future distribution networks.
2
1.1.1 Distributed Generation
Distributed generation (DG), especially renewable energy source (RES), are playing an important role in decarbonising the energy supply. For example, wind generation and solar photovoltaics (PV) convert wind and solar energy into electrical energy. Installed capacities of wind and PV have increased dramatically since 2010. As indicated in Figure 1.2, the installed capacity of PV increased from 0.1 GW to 5.4 GW. For onshore and offshore wind, the installed capacities increased from 4.1 GW and 1.3GW to 8.5 GW and 4.5 GW,
respectively.
Figure 1.2 Installed Capacity of PV and Wind Generation in the UK from 2010 to 2014 [3]
1.1.2 Air Source Heat Pumps
ASHPs are seen as key technology in the decarbonisation of domestic heating. In comparison with conventional boilers, which burn natural gas, ASHPs transfer heat from the outside to the inside of buildings using electrical energy. This allows an ASHP to generate far more heat than a conventional electrical heating system. The efficiency of ASHP is measured by coefficient of performance (CoP). CoP is the ratio between the amount of thermal energy transferred for heating and the electrical energy consumed by ASHP. CoP can be influenced by many factors including the temperature difference between the inside and outside of the building. Experimental results from ASHPs in residential buildings in Italy show that the CoP
3
is typically above 2.5 [4]. Other studies have determined that the power consumption of ASHPs varies between 1.5kW to 4.5kW [5].
1.1.3 Electric Vehicles
Electric vehicles (EVs) include a range of technologies including plug-in EVs (PEVs), battery EVs and extended-range EVs. EVs use electrical motors instead of, or in conjunction with, internal combustion engines. When driven from the battery energy storage on board, EVs produce no pollution or CO2 during driving. If the batteries are charged from renewable sources, EVs do not produce any emissions. Even when EV batteries are charged from non-renewable based generation, they still provide opportunities to deal with emissions centrally. Plug-in EVs are charged from three categories of chargers [6, 7], which are summarized in Table 1.1.
Connection Power (kW)
Level 1 Single phase 1.5 – 3
Level 2 Single phase 10 - 20
Level 3 Three phase > 40
Table 1.1 EV Charing Connection Type and Power Range
Level 1 and Level 2 chargers are suitable for home charging. Compared to normal household peak demand, the power consumption of Level 1 and Level 2 chargers are relatively large. Level 3 refers to fast chargers and these high power chargers require appropriate
infrastructures. The impacts of EV charging on existing electrical infrastructures have been extensively studied [8-10]. It has been found that if not well managed, even a low penetration of EVs can still cause network constraints violations.
1.2Challenges Faced by Conventional Distribution Networks
Traditionally, power systems have been considered in terms of three areas: power generation, power transmission and power distribution. In the UK, distribution network operators (DNOs) manage electrical networks from 132kV to 0.4kV. The connection of DGs and LCTs to distribution networks brings new opportunities and challenges to DNOs.
Power systems were previously designed to deliver power from large-scale generators to where the demand was required, via the transmission networks and distribution networks, from high voltage (HV) to the low voltage (LV) system. However, with more DG and LCTs
4
connected within distribution networks, this model is becoming outdated as power can be supplied locally and even be exported back to the transmission networks in some cases. Moreover, due to the connection of large quantities of renewables based intermittent
generation such as wind and PV panels the availability and location of generation is becoming less predictable. Moreover, with the proliferation of new technologies such as EVs and
ASHPs, the prediction of load profiles are becoming less predictable and unified.
1.2.1 Voltage Control
DG can lead to voltage rise problems. In the UK, steady state voltage limits for networks above 1kV and below 132kV are ±6% of the nominal voltage and -6%/+10% for LV networks [11]. In distribution networks, especially in LV networks where on-load tap changers (OLTCs) are not used, the tap positions of transformers are normally set so that secondary voltages at the LV busbars are close to the high voltage limits to maximise the capability of the network to accommodate load. Thus, during periods of low load and high DG real power export, it is likely that high voltage limits are violated.
The connection of distributed PV, ASHPs and EVs are less likely to be planned by DNOs and therefore can increase unbalance between different phases and different feeders. The
increased unbalance between feeders in radial networks is challenging for OLTCs. OLTCs change the voltages of all the feeders downstream uniformly. As a result, in a substation where one feeder has low voltage problems due to load while another feeder has high voltage problems due to DG, an OLTC cannot solve both sets of problems if they occur
simultaneously. Similarly, as unplanned generation and additional load will be distributed across the phases of an LV feeder voltage phase unbalance is likely to be more severe than before.
DGs and LCTs can pose challenges for voltage control devices controlling individual feeders. Conventionally, capacitor banks (CB) and in-line regulators are used for feeder voltage control. However, at the remote ends of medium voltage (MV) feeders and LV networks, normally there are no measurements. Without measurements and accurate state estimation information, controlling voltages at the remote ends of MV and LV feeders is difficult.
1.2.2 Power Flow
The ratings of transformers and cables indicate their capabilities for transferring power. High penetrations of DG can cause power flow problems including reverse power flow and
5
Traditionally, distribution networks are designed to transmit power in the same direction moving from HV to LV or from substations to the remote ends of feeders. Bidirectional power flows can be challenging to network control and protection as existing systems and technology has been designed to cope with the traditional model of power flow. RESs, especially wind energy, may not be at the same location as load, thus in weak networks with high penetrations of DG, during low demand period, reverse power flow is likely to occur. For cables and transformers without OLTCs, the reverse power ratings are equal to their normal ratings. However, the reverse ratings of primary transformers equipped with certain types of OLTC can be constrained. For example, it is found that the reverse rating of some 33/11.5kV, 7.5MVA primary transformer is reduced to 66.3% of the forward rating [11]. Both large penetrations of DG and load increase due to LCTs can cause overloads in transformers, overhead lines and underground cables. Overloads or thermal constraint violations are conventionally alleviated by network reinforcement which is expensive and requires considerable planning [12, 13]. The ratings of transformers and branches used in system planning and design are to meet peak demand or generation and are therefore typically not fully utilised. Enhanced DG control can also be used to alleviate thermal constraints. This includes curtailment of real power and management of reactive power of DG. DG curtailment is the most common method to deal with generation driven overloads. However, DG
curtailment reduces environmental and economic benefits of RESs. Some DG, depending on the type and technology, has the capability to inject or absorb reactive power. In addition, the use of reactive power can be effective for voltage control in networks particularly in networks with higher X/R ratios. In MV and LV distribution networks, where the X/R ratio is relatively lower, reactive power is less effective for voltage control. It should be noted that the injection or absorption of reactive power changes the power factor and can increase the losses across the system.
1.2.3 Uncertainties
Conventionally, distribution networks are operated and planned using predictable load profiles with the majority of the real power supplied from large generators via the
transmission system. The generation dispatch schedules are developed, at the transmission system operator level, based on day-ahead load forecasts coupled with sufficient reserve. However, this simple model is no longer valid as the level and types of uncertainty in power systems are increasing with the increasing penetration of RESs and LCTs connecting to distribution networks [14-17]. The result of these changes is that the load and generation
6
profiles used for planning systems are becoming more unpredictable and thus forecast errors will increase. The electrification of the transport and heating not only increase the demand but also make load forecast a more difficult task. For instance, due to the spatial and temporal uncertainty of EV charging, it is difficult to predict the charging profiles. The usage of domestic ASHP is decided by heat demand which can be influenced by many factors such as ambient temperature and the use of hot water. As a result, the electricity demand of LCTs is difficult to predict as well. Besides, renewable based generation is less or even not
controllable.
With the presence of these increasing uncertainties in the power system conventional technologies and techniques are therefore not adequate. The increasing number and level of uncertainties will greatly increase operation costs and trigger network reinforcement unless these uncertainties are understood, managed and planned for appropriately.
1.3Energy storage
Electrical energy cannot be stored easily therefore the existing operational model within power systems is to maintain the balance between load and generation as accurately as possible. Due to the uncertainties in predicting load and generation some mismatch is unavoidable. These mismatches are conventionally managed using controllable generation, controllable load (if available) and energy storage systems (ESSs). ESSs store electrical energy in other forms such as chemical, thermal or gravitational potential energy and
decouple load and generation. Battery energy storage systems (BESSs), for instance, convert electrical energy into chemical energy during charging and convert chemical energy into electrical energy during discharge.
The characteristics of BESSs such as high energy density and fast response rate make it suitable for various power system applications [18-20]. Pumped hydroelectric storage (PHS) has been used for meeting peak demand, absorb excess generation and frequency control. However, in comparison with BESS, PHS is slower to respond and is also restricted by location. BESSs, on the other hand, have faster response times and are less restricted in terms of location. BESSs have no moving parts and therefore, in comparison to technologies such as compressed air energy storage and flywheel energy storage, are suitable to be installed in residential area or at a smaller scale.
Furthermore, in distribution networks, real power flow is much higher than reactive power. This means that the same change in the magnitude of real power has a much higher impact on the magnitude of apparent power than that using reactive power. Therefore, compared with
7
other technologies which use reactive power, such as static synchronous compensator, real power from ESS is more effective.
However, a number of limitations of BESSs still exist. Currently the cost of BESSs is still very high and the number of charge and discharge cycles of BESSs can result in relatively short operational lifetimes. Moreover, over-charging or over-discharging of BESSs can result in irreversible damage to the battery cells. To protect fragile and expensive BESSs,
conservative approaches are normally taken to the design and management of BESSs. For instance, tighter SoC limits than their technical limits are often used to protect BESSs from over-charge and over-discharge.
The difficulty of observing the complex chemical reactions within the cells makes measuring state-of-charge (SoC) and the state-of-health (SoH) of batteries extremely challenging. Inaccuracies in SoC measurements have additional impacts on the operational regimes of the available energy resource in order to protect the battery.
Understanding and measuring battery degradation and SoH is very important to maximising the value of BESSs, due to their high capital costs and limited numbers of charge-discharge cycles. SoH can be indicated by internal resistance, available capacity, voltage and remaining charge and discharge cycles [21]. Aggressive use of BESS such as deep depth of discharge (DoD) and fast charge and discharge have serious effects on the SoH of BESSs.
1.4Demand Side Response
Power systems used to be designed to meet peak demands by scheduling and controlling centralized large-scale fossil fuel based plant based on predictable load forecasts. The generators used to supply the peak demand usually have higher costs and are typically less efficient, more carbon intensive generating plants. Therefore, exploiting the customers’ flexibility through DSR and reducing reliance on this generating plant is crucial to reducing the carbon emissions of the electrical energy system. It has been estimated that a 5% shift of peak demand can deliver an annual network investment saving of £14m and a daily carbon emission saving of up to 1,250 tCO2 [22].
Demand side response (DSR) is able to reduce peak demand but also can be used to facilitate RESs. During periods when generation is in excess of demand, for example during periods of large wind generation export, bringing load forward, which results in generation and demand mismatches being minimised, can avoid RES curtailment. DSR has also been shown to have the capability to reduce the requirement for network reinforcement [23].
8
There are still a number of barriers to the implementation of DSR. How much demand can be reduced or increased is difficult to determine and uncertain. The recuperation of energy after DSR services have been delivered is known as pay back. The magnitude, duration and effects of the pay back of DSR need to be further investigated. The uncertainties associated with DSR need to be understood and managed. Furthermore, there is a lack of a regulatory framework and incentive mechanism for DSR which is currently limiting the adoption of DSR in the UK. Finally, customers’ awareness of the potential benefits of DSR needs to be improved.
1.5Real Time Thermal Rating
The ratings of conductors are conventionally defined by a set of predefined and conservative weather conditions. For instance, according to the UK standard, the rating for overhead lines (OHL) are calculated based on assumptions of the weather conditions of 0.5m/s wind speed and an ambient temperature of 2°C in winter and 20°C in summer [24].
Real time thermal rating (RTTR) considers the real time temperature of conductors as the constraint of the conductors’ capacity. The impacts of environmental conditions on RTTR have been explored in [25]. The cooling of conductors is influenced by environmental factors including ambient and soil temperature, wind speed, wind direction and solar irradiance. For OHLs, the most significant factors are wind speed and ambient temperature [26]. For electric cables (underground), their ratings are mostly influenced by thermal resistance of the
insulation and the soil. The ratings of power transformers are limited by the hot spot temperature of the windings. For distribution transformers, which are normally naturally cooled by air externally, the most significant environmental factor is air temperature [25, 27, 28].
Deploying RTTR in collaboration with other technologies has been shown to be able increase the capability of distribution networks’ to accommodate RESs and LCTs [29]. In comparison with static rating, RTTR can increase the current carrying capability of conductors [27]. In previous studies, it is found that the implementation of RTTR can reduce loss of load expectation of up to 67% [30].
1.6Research objectives
The research detailed in this thesis focussed on the management and resolution of thermal constraints and steady state voltage limit violation problems in distribution networks. The aim of the research is to provide an alternative solution to network reinforcement, which has high cost and requires extensive planning and construction work.
9
This research aims to investigate the use of ESS and DSR in future distribution networks to facilitate LCTs as an alternative to network reinforcement. In summary, the research question of this thesis is: if and when ESS and DSR can be alternative to network reinforcement? The main research objectives are detailed below:
- To investigate the impacts of high penetrations of DG and LCTs on future smart distribution networks in terms of voltage and power flow;
- To understand the limitations of current control strategies for ESS and DSR in future distribution network scenarios where high penetrations of DG and LCTs exist;
- To understand the impacts of a range of sources of uncertainties, arising from existing and future elements of the electrical energy system, on the performance of
conventional control algorithms;
- To develop and evaluate control strategies for ESS and DSR to facilitate DG and LCTs in the presence of a range of source of uncertainties.
1.7Thesis outline
The rest of this thesis is organised as follows: Chapter 2 provides a literature review on ESS and DSR. The technologies and benefits of ESS are introduced first. The state of the art of control and scheduling strategies for grid scale ESS is provided. This is followed by a description of the benefits and challenges for DSR. Current approaches for DSR control and scheduling are also examined. In the following section, coordinated control methods for ESS and DSR are reviewed. Finally, conclusions are drawn on the use of EES and DSR in future distribution networks.
In Chapter 3, the calculation of SFs is described and control schemes based on SFs are proposed. The use of sensitivity factors (SFs), namely voltage sensitivity factors (VSF) and power flow sensitivity factors (PFSFs) in this thesis, is an important method to linearize the quadratic power flow equation. Initially, two methods to calculate SFs are introduced. Next, based on SFs, cost sensitivity factors (CSFs) are introduced. Finally, A SF and a CSF based control schemes which use ESS and DSR collaboratively are presented.
Chapter 4 describes uncertainties that exist in power system scheduling problems and
methods to deal with uncertainties. The sources of uncertainty, including load forecast, wind forecast, RTTR, SoC and DSR, are introduced first. Methods to deal with uncertainty are presented. To illustrate the impact of uncertainty on a distribution network an example of using Monte Carlo simulation (MCS) to explore the impacts of EV charging on distribution networks is given.
10
In Chapter 5, tackling uncertainty with robust optimization (RO) is detailed. The formulation and solution of an uncertainty linear optimization problem is introduced. The three stages of RO formulations are presented. This is followed by a description of the implementation and validation of RO in Python.
Chapter 6 applies RO to solve a power flow management (PFM) problem which integrates ESS and DSR. The concept of budget of uncertainty (BoU) and optimal budget of uncertainty (OBoU) is proposed to realise the trade-off between the probability of success (PoS) and the cost. Two methods to calculate OBoU are proposed.
In Chapter 7, case studies based on IEEE 14 and 118 busbar networks are given to illustrate the advantages of the proposed method. Simulation results show that the proposed scheduling scheme is able to reduce the requirement for ESS, compared to conventional techniques. In Chapter 8 and Chapter 9, a discussion of the findings and the implications of this research is presented and key findings are summarised.
11
Chapter 2.
Literature Review
2.1Introduction
In the previous chapter, the challenges to future distribution networks due to the anticipated widespread proliferation of LCTs that are required to enable the decarbonisation of the energy sector are presented. ESS and DSR are key technologies in enabling a smart approach to economically managing these changes to the supply, transmission, distribution and consumption of electrical energy.
In this chapter, a review of the roles and capabilities of ESS and DSR, under the supervision of supervisory smart control systems in future distribution networks is presented. In section 2.4, previous work on the coordinated, collaborative operation and scheduling of ESS and DSR in distribution networks is evaluated. Finally, a summary of the current capabilities and limitations of advanced network management systems which integrate ESS and DSR to manage voltage and thermal constraints in future distribution network is discussed. The limitations of current research are summarised.
2.2Energy Storage
2.2.1 Benefits of Energy Storage in Electrical Energy Systems
Due to differences in the operation and management of today’s electrical energy systems throughout the world and the flexibility of energy storage the benefits of energy storage vary. In the following section, the key benefits provided by energy storage to distribution and transmission networks worldwide is presented. The benefits of ESS include:
1. Voltage control and power flow management
The use of energy storage to provide voltage control and power flow management has been demonstrated in [31, 32]. In [31], a battery energy storage system (BESS) was deployed in an area of 11kV distribution network in the UK to control voltage and alleviate thermal constraints. It was found that the 0.4MW, 0.2MWh BESS deployed in an 11kV distribution network was capable of reducing the number of thermal excursions.
2. Energy Arbitrage
Generating profit by selling energy when the cost of energy is high and buying energy when the cost is low is known as arbitrage. To do this effectively requires accurate prediction of future energy prices which is influenced by factors such as generation availability and load. A robust bidding strategy for a windfarm and an ESS, which
12
considers the uncertainty in electrical energy price and wind power export forecasting, has been developed previously [33]. In [34], the economic viability of arbitrage with cryogenic ESS considering day-ahead and week-ahead electricity prices is evaluated.
3. Ancillary Services
Energy storage has been previously shown to be able to provide ancillary services including frequency response/operating reserves [35]. Energy storage can be used to support black starts [36, 37]. ESS can be used to improve power quality and stability, especially in LV networks and microgrids [38-40].
4. Facilitate renewables
Previous work has demonstrated, using a validated Great Britain (GB) power system model, it has been shown that with 8GW, 800GWh energy storage, the maximum capacity of wind based generation can be increased from 35GW to 42GW and the critical excess electricity production can be reduced from 8.21GWh to 4.35GWh [41]. 5. Regulatory
Energy storage has the capability to reduce customer minutes lost, and can also assist in compliance with ER P2/6 [42], the UK energy security standard. In addition, energy storage has also been shown to reduce generator curtailment [31, 43].
2.2.2 Grid Scale Energy Storage Technologies and Services
The capabilities of a wide range of grid scale energy storage technologies to provide energy system services have been investigated previously [18, 44-48].
In [47], the characteristics, current development state and potential usage of grid scale energy storage technologies are summarised and evaluated. Key characteristics that were identified include the current rated (energy) capacities and the discharge time duration at rated power of the energy storage systems under evaluation. These key characteristics were mapped to the key challenges and services that are required in the energy market. This mapping is expressed diagrammatically in Figure 2.1. It can be seen that the characteristics of BESSs currently map to the requirements of smartgrid and distribution network applications.
13
Figure 2.1 Characteristics, State and Potential Application of Electrical Energy Storage Technologies [47]
2.2.3 Energy Storage Control and Scheduling
In [49], an introduction to the use of BESS to enable the integration of PV based generation, is given. Three control modes for BESS were defined, namely ramp rate control, frequency response and reactive support. In reactive support mode, BESS is used to import/export reactive power for power factor correction and distribution network loss reduction. To support the development of the control for BESS a Hardware in the Loop (HIL) test bed was
developed. The final control strategy presented in this paper is based on ramp rate control, with the ramp rate of the BESS export change limited to 50kW/min. However; the control strategy developed is not optimised.
A multi-objective control strategy for BESS to defer network reinforcement due to the increasing penetration of PV has previously been developed [50]. A detailed BESS model is proposed and this model is able to simulate the round trip efficiency, SOC, single and three-phase real, reactive and apparent power rating of BESS. The objectives of the optimisation algorithm are voltage control, power flow management and minimisation of annual cost. The trade-off between voltage control and power flow management is realized by using a
weighting factor. The third objective, annual cost minimisation is modelled as a constraint. The annual cost calculation includes asset depreciation cost, fixed capital cost and
14
An optimal operation strategy for an ESS, connected to a wind generator, in a day-ahead market is proposed in [51]. The ESS is used to store renewable energy from the wind generator in order to maximize the revenue generated for selling energy to the market. A discrete time battery model, which models the battery dynamics including SOC, temperature and current, has been built and adopted. The overall optimization problem is solved with a forward dynamic programming algorithm.
Several studies focus on the real and reactive power import/export ratio of ESS to control voltage and manage power flows. The effectiveness of reactive power to control voltage is dependent on the X/R ratio of the network. In [52], six control strategies with different real and reactive power priorities and ratios have been used for voltage control and reducing reverse power flow. The strengths and weaknesses have been evaluated through simulations with an 11kV network model. In [53] an operation strategy for BESS, is proposed for distribution network voltage support. The real and reactive power ratio is determined by the conductance and the susceptance of the Thevenin equivalent of the upstream network. This method is introduced in [54]. Eight dispersed Zn/Br flow batteries are deployed in a rural distribution network at different locations for voltage control [55]. In this work three voltage control strategies have been developed and comparatively evaluated. However, it was found that reactive power had minimal effect on the voltages in the case study network under investigation.
Optimal power flow (OPF) techniques have also been used to develop control algorithms for the control and scheduling of ESS [56-58]. However, direct integration of ESS into
conventional OPF techniques is not usually possible. The main challenges to integrating ESS into OPF based control algorithms are:
Finite discharge/charge capability of ESS;
Accurate determination of available discharge and charge capability of ESS; The quadratic relationship between real, reactive and apparent power rating. In [56], an ESS is instructed to charge during off-peak periods and discharge during peak periods. Maximum real power import and export is decided by the maximum mismatch between generation and load. In this paper, the charge and discharge operation periods are fixed. In [57], an optimised flexible charge and discharge scheduler for ESS is proposed. However, this scheduler only allows one charge and discharge cycle per day and is not able to deal with the uncertainty of forecast. In [58], the authors proposed a dynamic programming approach based solver for OPF problems with ESS, with a focus on microgrid application.
15
The proposed formulation minimises the cost of importing electricity from the main grid. In [59], OPF equation has been modified to solve an ESS scheduling problem. In this work, the cost function minimizes the cost of generation. The cost of using ESS is not considered. Rule based control techniques have been used for ESS control [60, 61]. In [60], a rule based control strategy is proposed to dispatch intermittent renewable based generation. The objective of this control strategy is to maintain the combined export power from renewables and BESS to a predefined setpoint. In [61], ESS is used in collaboration with OLTC for voltage control. The concepts of cost sensitivity factors are proposed. The proposed methodology uses the most effective intervention.
Paper [62] presents a coordinated control of distributed ESS with tap changer transformers for voltage rise mitigation due to high PV penetration. In this proposed system, distributed ESSs are located next to PV and are coordinated by the central controller. When a voltage excursion occurs, the transformer responds initially and ensures that the bus voltage is within limits. Real power import/export signals will be sent to the ESSs to absorb the reverse power flow or shave the peak load. Real power import/export signals will not be sent until the tap operation is over. The maximum DoD of the BESS is limited to 20% (over 80% SOC) to prolong the cycle lifetime of the ESSs.
2.2.4 Use of Real and Reactive Power Ratio for Voltage Control and Power Flow Management
As energy storage can provide multiple services with both real and reactive power, it is
important to understand the relationships between voltages and power flows of the system and the real and reactive power import/export from ESS units.
The voltage change due to real and reactive power injection from ESS can be estimated by
∆𝑉 =(𝑃𝐸𝑆𝑆𝑅 + 𝑄𝐸𝑆𝑆𝑋) 𝑉𝑆
(2.1)
where
∆𝑉 the voltage change
𝑉𝑆 the nominal voltage
𝑃𝐸𝑆𝑆 the real power import/export from ESS
𝑄𝐸𝑆𝑆 the reactive power import/export from ESS
𝑅 line resistance
16
In transmission networks where the 𝑋/𝑅 ratio is high, reactive power is more effective for voltage control. On the contrary, in distribution networks, where the 𝑋/𝑅 ratio is relatively lower, real power is more effective to control voltage. However, the available real power resource is finite and is limited by the capacity of the ESS. Reactive power is less effective for voltage control but is unlimited in time.
Similarly, when using energy storage for power flow management problems, real power has a higher sensitivity factor but the effective cost of real power is higher as well. Reactive power is less effective but costs less.
The trade-off between using real and reactive power is illustrated by Figure 2.2 below.
Reactive power of ESS is not time limited therefore using reactive power only is purely a cost prioritized approach. However, injecting too much reactive power will cause large voltage change and also increase network losses. When voltage constraints and losses are considered, more real power should be used. Exporting real power only is a technically driven approach. Real power is an effective solution for power flow management, however, when the energy capacity of the ESS unit is approaching its limits as well as the duration of the violation of limits or constraints are considered, more reactive power should be used.
Increase cost, energy capacity requirement of ESS
Increase losses and voltage change
Reactive power only
Real power only
Figure 2.2 Illustration of the Trade-off Between Real and Reactive Power
2.3Demand side response
Demand side management (DSM) is defined as any activity carried out on the demand side of energy systems [63]. DSM, therefore, encompasses activities such as energy efficiency, time of use (ToU) tariffs, DSR and spinning reserve (SR). DSR increases or decreases the load in
![Figure 1.2 Installed Capacity of PV and Wind Generation in the UK from 2010 to 2014 [3]](https://thumb-us.123doks.com/thumbv2/123dok_us/1078917.2643613/32.892.98.733.352.761/figure-installed-capacity-pv-wind-generation-uk.webp)
![Figure 2.1 Characteristics, State and Potential Application of Electrical Energy Storage Technologies [47]](https://thumb-us.123doks.com/thumbv2/123dok_us/1078917.2643613/43.892.124.765.87.490/figure-characteristics-potential-application-electrical-energy-storage-technologies.webp)