Article (Accepted Version)
Chavarro Bohorquez, Diego Andres and Rafols, Ismael (2018) To what extent is publishing in the Web of Science an indicator of journal 'quality'? Research Evaluation, 2 (1). pp. 106-118. ISSN 0958-2029
This version is available from Sussex Research Online: http://sro.sussex.ac.uk/id/eprint/71256/
This document is made available in accordance with publisher policies and may differ from the published version or from the version of record. If you wish to cite this item you are advised to consult the publisher’s version. Please see the URL above for details on accessing the published version.
Copyright and reuse:
Sussex Research Online is a digital repository of the research output of the University.
Copyright and all moral rights to the version of the paper presented here belong to the individual author(s) and/or other copyright owners. To the extent reasonable and practicable, the material made available in SRO has been checked for eligibility before being made available.
Copies of full text items generally can be reproduced, displayed or performed and given to third parties in any format or medium for personal research or study, educational, or not-for-profit purposes without prior permission or charge, provided that the authors, title and full bibliographic details are credited, a hyperlink and/or URL is given for the original metadata page and the content is not changed in any way.
To what extent is inclusion in the Web of Science an indicator of journal ‘quality’?
Journal: Research Evaluation
Manuscript ID RESEVAL-2017-0002.R2 Manuscript Type: Article
Keywords: Web of Science, ; Latin America, Spain, and Portugal, Scholarly journals, research excellence, Universalism, estimation thinking
Abstract:
The assessment of research based on the journal in which it is published is a widely adopted practice. Some research assessments use the Web of Science (WoS) to identify “high quality” journals, which are assumed to publish excellent research. The authority of WoS on journal quality stems from its selection of journals based on editorial standards and scientific impact criteria. These can be considered as universalistic criteria, meaning that they can be applied to any journal regardless of its place of
publication, language, or discipline. In this article we examine the coverage by WoS of journals produced in Latin America, Spain, and Portugal. We use a logistic regression to examine the probability of a journal to be covered by WoS given universalistic criteria (editorial standards and scientific impact of the journal) and particularistic criteria (country, language, and discipline of the journal). We find that it is not possible to predict the inclusion of journals in WoS only through the universalistic criteria because particularistic variables such as country of the journal, its discipline and language are strongly related to inc¬lusion in WoS. We conclude that using WoS as a universalistic tool for research assessment can disadvantage science published in journals with adequate editorial standards and scientific merit. We discuss the implications of these findings within the research evaluation literature, specifically for countries and disciplines not extensively covered by WoS.
To what extent is inclusion in the Web of Science an
indicator of journal ‘quality’?
Abstract
The assessment of research based on the journal in which it is published is a widely adopted practice. Some research assessments use the Web of Science (WoS) to identify “high quality” journals, which are assumed to publish excellent research. The authority of WoS on journal quality stems from its selection of journals based on editorial standards and scientific impact criteria. These can be considered as universalistic criteria, meaning that they can be applied to any journal regardless of its place of publication, language, or discipline. In this article we examine the coverage by WoS of journals produced in Latin America, Spain, and Portugal. We use a logistic regression to examine the probability of a journal to be covered by WoS given universalistic criteria (editorial standards and scientific impact of the journal) and particularistic criteria (country, language, and discipline of the journal). We find that it is not possible to predict the inclusion of journals in WoS only through the universalistic criteria because particularistic variables such as country of the journal, its discipline and language are strongly related to inc-lusion in WoS. We conclude that using WoS as a universalistic tool for research assessment can disadvantage science published in journals with adequate editorial standards and scientific merit. We discuss the implications of these findings within the research evaluation literature, specifically for countries and disciplines not extensively covered by WoS.
1. Introduction
In the last three decades there has been a proliferation of national research assessments under increasing pressure for accountability (Whitley and Gläser 2007; Hicks 2012). Many of these assessments are strongly informed by the classification of journals into ‘quality’ ranks. The underlying assumption in research assessment by journal rankings is that the reputation or scientific impact of a journal is a good proxy of the ‘quality’ of papers and researchers. Most of the research evaluation literature warns against this practice (Hicks et al. 2015) given that journals publish different types of articles with highly diverse outcomes in terms of citation impact (Seglen 1997). This conventional practice leads to uniform research criteria, regardless of the context in which research is produced. Although this simplifies activities related to the management of research, such as funding and indicators production, it has been argued that it does not adequately represent the process and outputs of research. For example, the San Francisco Declaration on Research Assessment (DORA), subscribed to by a variety of universities, journal editors, and publishers, called for a radical change in the way current research evaluation is performed, away from the use of journal indicators.
2 3 4 5 6 7 8 9 10 11 12 13 14 15 16 17 18 19 20 21 22 23 24 25 26 27 28 29 30 31 32 33 34 35 36 37 38 39 40 41 42 43 44 45 46 47 48 49 50 51 52 53 54 55 56 57 58 59
Despite this concern, research assessment based on journals is a common practice as can be seen in the assessment exercises of Slovak Republic and Hungary (Lillis and Curry, 2010), Poland, Russia, and Slovenia1, Spain and Colombia (Rafols et al. 2016), Brazil (Frigeri & Monteiro 2015), and South Africa (Woodiwiss 2012), among others. The reasons for the adoption of these methods are not always clear, but a plausible reason could be that the main function of research evaluation in certain countries is to audit researchers and distribute funds. Having an internationally accepted measure thereby accords objectivity to managerial decisions that otherwise could be questioned (Rafols et al. 2016).
In journal-based methods of evaluation, a challenge is to find reliable data sources to select the best journals. In many quantitative research assessments, the Web of Science (WoS) is the main data source used to obtain bibliographic indicators such as the number of papers, citations, or impact factors (Rafols et al. 2016). WoS is commonly regarded as an objective data source that selects its journals based on their fulfilment of editorial standards and high scientific impact (Garfield 1997; Braun, Glänzel, & Schubert 2000; Testa 2014). Based on its perceived objectivity, WoS has achieved a status of authority on the identification of high quality journals globally (Guédon 2001; Lillis and Curry 2010).
However, the extent to which WoS should be used as a global research assessment tool has been contested based on linguistic, geographical, and disciplinary biases in its journal coverage. According to this argument, research evaluations based on WoS may reproduce those biases (Bonaccorsi 2015, p. 22; Rafols, Ciarli, & Chavarro 2015, p. 598) thereby affecting countries, disciplines, and languages that are under-represented (Gibbs 1995; Tijssen, et al. 2006). This is particularly relevant in countries in which research evaluations tend to favour papers published in high impact factor journals to promote and reward excellence in research (Velho 1985; Sancho 1992; Vessuri, Guédon, & Cetto 2014).
Objectives
1
These cases were kindly provided by an anonymous reviewer. 2 3 4 5 6 7 8 9 10 11 12 13 14 15 16 17 18 19 20 21 22 23 24 25 26 27 28 29 30 31 32 33 34 35 36 37 38 39 40 41 42 43 44 45 46 47 48 49 50 51 52 53 54 55 56 57 58 59
This paper aims to contribute to extant literature on the use of data sources for identifying and appraising research excellence. We do this by focusing on a much neglected aspect -- the inclusion criteria used by WoS for analysing journals produced in Latin America2, Portugal, and Spain. To do this, we look at the detailed characteristics of individual journals (as suggested by Tijssen et al. 2006, p. 173) in relationship to stated criteria for inclusion in WoS. Latin America, Spain, and Portugal are relevant because they are important producers of academic journals that are not included in WoS (Cetto & Alonso-Gamboa 2011).
In order to study the coverage of WoS, we analysed the extent to which two perspectives found in the literature help to elucidate the inclusion of journals in this database. The first perspective regards WoS as universalistic, meaning that its coverage depends on meritocratic criteria (Merton 1973, p. 271), specifically on editorial standards and scientific impact of the journals. The second is that WoS is particularistic, meaning that its coverage depends on ascribed characteristics (Merton, 1973, p. 273) such as country, discipline, and language of the journals.
The novel contribution of this paper is to interrogate, using a regression model, these two competing perspectives on journal selection by WoS. In particular, we show that particularistic variables such as country and discipline and universalistic variables such as editorial standards and scientific impact help to predict the probability of inclusion of a journal by WoS. This finding challenges the view that WoS’ coverage is based only on universalistic criteria (the dominant view in research evaluation), but also bring a more nuanced view to the claims of biases advanced by the most critical perspectives. Based on this finding, we suggest a more balanced assessment of data sources such as WoS while recognising both their strengths and weaknesses for the assessment of research.
2 The definition of Latin America is ambiguous because it comprises a variety of countries that
are economically and culturally diverse. We use the term here to indicate a geographical region that comprises Central America (including Mexico), South America, and the Caribbean.
2 3 4 5 6 7 8 9 10 11 12 13 14 15 16 17 18 19 20 21 22 23 24 25 26 27 28 29 30 31 32 33 34 35 36 37 38 39 40 41 42 43 44 45 46 47 48 49 50 51 52 53 54 55 56 57 58 59
2. Universalistic and particularistic views of WoS
This study focuses on Latin America, Spain, and Portugal as locations in which there is a considerable production of nationally edited journals that are not covered by WoS (Testa, 2011). To remedy this ‘invisibility’ in WoS, the dominant research policies in these regions have attempted to improve the editorial standards of their journals so that they are included in this database (Cetto & Hillerud 1995). These policies resemble recommendations by the founder of WoS, Eugene Garfield. For Garfield, by publishing in journals covered by WoS, which are mainly produced outside of Latin America, Latin American scientists could achieve international recognition for their work (Garfield 1976; 1995). Therefore, ‘recognizing and providing for this elite would seem a logical way to efficiently and systematically improve a nation’s science base’ (Garfield 1995, p. 95).
In order to explore the understanding of WoS as an indicator of journal quality we use the concepts of universalism and particularism (Merton, 1973). Universalism refers to the appraisal of research based on merit regardless of ascribed characteristics of who produces the knowledge. Particularism means the influence of ascribed characteristics, such as nationality or language, in the appraisal of research. In the case of journal coverage, universalism means the selection of journals based on their intrinsic quality, i.e. their editorial standards and intellectual merit. Particularism means that the selection of journals is influenced by ascribed characteristics of the journals such as their language, geographical location or discipline.
Garfield’s recommendation responds to a universalistic conception of the journal coverage of WoS. Operationally, Garfield explained the inclusion of journals in WoS through the use of citation indicators and fulfilment of editorial standards (Garfield 1980; 1985). The citation indicators are proxies for the scientific impact of a journal, and the editorial standards control for rigour in the review process of and publication in the journal. From this perspective, WoS ‘generally represents the best science performed in any nation’ (Garfield 1995, p. 88). The implication of this statement is that journals excluded from WoS are perceived as failing to meet the objective quality requirements, which renders them unsuitable for publication of excellent research.
2 3 4 5 6 7 8 9 10 11 12 13 14 15 16 17 18 19 20 21 22 23 24 25 26 27 28 29 30 31 32 33 34 35 36 37 38 39 40 41 42 43 44 45 46 47 48 49 50 51 52 53 54 55 56 57 58 59 60
However, different authors have criticised the selection of journals by WoS, arguing that its coverage is biased. The main criticism has been that WoS is under-representing some types of scientific research because it focuses mainly:
• on English language journals (Seglen 1997; van Leeuwen et al. 2001; Lillis & Curry 2010)
• on natural and engineering sciences (Yaalon, 1962, as cited by McDonald 1994, p.58; Velho & Krige 1984; Arvanitis & Chatelin 1988; Hicks 1999; Archambault et al. 2006; Larivière & Macaluso 2011).
• on journals produced in the UK, the Netherlands, and the US (Sanz, Aragón & Méndez 1995; Larivière, Haustein, & Mongeon 2015; Chavarro 2017, chapter 5).
The researchers here make the point that the indicators obtained from WoS give a partial view of scientific publications. However by expanding the coverage of WoS or using more databases, it becomes possible to obtain a more accurate representation of scientific production (Sivertsen & Larsen 2012). From the argument above it can be conjectured that the coverage of WoS is particularistic. This means that it is potentially influenced by characteristics of the journals such as their place of publication, discipline, and language. In Latin America, perceptions of particularism in WoS have motivated the development of alternative journal databases such as Scielo and RedALyC (Chavarro, 2017, Chapter 3), which aim at giving visibility to research that is not usually covered by WoS. Similarly, many Latin American researchers have argued for more recognition of the knowledge produced in these journals (Packer & Meneghini 2007; Aguado-López et al. 2014; Alperín 2014; Vessuri, Guédon, & Cetto 2014; Bianco, Gras, & Sutz 2016).
Merton and other sociologists of science considered the possibility that in practice ‘both universalistic and particularistic standards might be concretely
involved in the actual [as opposed to ideal] process of evaluation’ (Zuckerman & Merton 1971, p. 86; see also Cole & Cole 1973, p. 37). However, the above universalistic and particularistic perspectives on WoS reveal a tension between the two (Vessuri, Guédon, & Cetto 2014; Rafols et. al 2016). It is between the recognition of WoS as an appropriate tool to identify and reward excellent
2 3 4 5 6 7 8 9 10 11 12 13 14 15 16 17 18 19 20 21 22 23 24 25 26 27 28 29 30 31 32 33 34 35 36 37 38 39 40 41 42 43 44 45 46 47 48 49 50 51 52 53 54 55 56 57 58 59
research regardless of its context of production (the universalistic perspective), and WoS as an inadequate or incomplete tool that underestimates the value of journals not covered by it (the particularistic perspective). As the universalistic and particularistic views on WoS imply different policies to support excellence in research both arguments need to be confronted. We do so by examining to what extent these views are related to the coverage of WoS in the case of journals produced in Latin America, Spain, and Portugal.
3. Methodology
Previous studies of coverage analyses have focused on descriptive statistics of the number of journals in a database (mainly WoS and Scopus) in order to reach conclusions about their linguistic, geographical, and disciplinary balance (see, for instance, Braun, Glänzel & Schubert 2000; Archambault et al. 2006; Moya-Anegón et al. 2007; Wagner and Wong 2012; Aguado-López et al. 2014). However, these studies do not take into account the coverage criteria used by the databases as part of their analyses. This way of analysing coverage has been seen by Garfield (1997) as a weakness in these studies because uneven representations of countries, disciplines, and languages in databases do not necessarily reflect biases. Concentration in a few journals can also be the result of a rigorous selection, because good editorial standards and ‘research quality’ could be missing in many journals published in Iberian and Latin American countries. For this reason, Garfield (1997) has called for more elaborate statistical analyses of coverage.
In order to address this gap, we performed a detailed analysis of individual journal characteristics through a logistic regression. The independent variables are characteristics of the journals (classified as universalistic and particularistic). The dependent variable is inclusion in WoS. The universalistic characteristics are editorial standards, scientific impact, and journal age. These characteristics are found in WoS as the criteria on which journals are included (Testa, 2014). Particularistic variables are country, language, discipline, and GDP per capita of the country of the journals.
2 3 4 5 6 7 8 9 10 11 12 13 14 15 16 17 18 19 20 21 22 23 24 25 26 27 28 29 30 31 32 33 34 35 36 37 38 39 40 41 42 43 44 45 46 47 48 49 50 51 52 53 54 55 56 57 58 59
3.1 Population and sample
The population studied is formed of journals active in the period 2000 - 2012 in the Latindex Catalogue covered by WoS, Scopus, Scielo, or RedALyC (n=1,954). Latindex3 is the biggest catalogue of journals produced in Latin America, Spain, and Portugal. It provides basic cataloguing information and editorial standards of the journals and specifies the date on which the checking was done. This is performed by national research councils, libraries, and international networks such as the European Network for Information and Documentation on Latin America (REDIAL) by directly inspecting issues of the journals (Alonso-Gamboa & Russell 2012). Scopus is a competitor to WoS. Scielo and RedALyC are open access databases that include many journals produced in Latin America, Spain, and Portugal not covered by WoS (Aguado et al. 2014; Vélez-Cuartas, Lucio-Arias, & Leydesdorff 2015).
The sample for the study was formed of journals indexed by WoS in the period 2005 - 2012 and journals produced in Latin America, Spain, and Portugal which are indexed by Scopus, Scielo, and RedALyC that were active in the same period 2005 - 2012. The reason for including only indexed journals was to help ensure that the journals in the sample had been assessed for inclusion by at least one other journal database in addition to Latindex. The year 2005 was chosen because it marked the beginning of a six-year expansion in the coverage of WoS. During this period 2,906 journals were added to an initial base of 8,833 journals (Testa, 2011, p. 3). This expansion raised a discussion about the transparency of the criteria used by WoS for inclusion, suggesting that WoS was biased towards the inclusion of journals from specific countries (Gavel & Iselid 2008; Kosanović & Šipka 2013; Collazo-Reyes 2014; Utrobičić et al. 2014). In addition, only languages with more than ten journals were included. After these filters, there were 1,360 journals in the dataset, 270 of which were covered by WoS (20% of the population of journals identified).
3.2 Procedure
The initial and most recent date of coverage and the number of documents covered by each database were checked for each journal. Two groups were
3 http://www.latindex.org/ 2 3 4 5 6 7 8 9 10 11 12 13 14 15 16 17 18 19 20 21 22 23 24 25 26 27 28 29 30 31 32 33 34 35 36 37 38 39 40 41 42 43 44 45 46 47 48 49 50 51 52 53 54 55 56 57 58 59
classified: (1) journals indexed by WoS and (2) journals not indexed by WoS. Coverage was checked through the ISSNs of journals and also at the title level. Only journals with 100% match in their titles were included. Also, journals with 95% or more similarity in their titles4 were checked manually against their web pages and WoS. After this check, journals that matched WoS’ journal titles were classified as covered and other journals as excluded. Details on the start dates of the journals were collected from Latindex and all four databases (WoS, Scopus, Scielo, and RedALyC), as well as from the web pages of the journals. It is important to note that journals can have more than one version, such as paper and online versions. Only the versions of the journal that were covered by WoS, Scopus, Scielo, and RedALyC were included.
In addition to collecting data on coverage, Google Scholar was used as a third-party source to identify citation impact (a proxy for scientific impact) for all the journals gathered (Harzing & van der Wal 2009). It was chosen because it covers a wider range of journals than RedALyC, Scielo, WoS, and Scopus, thereby increasing the chances of finding citation information for the journals (more below). In order to gather information on as many journals as possible, we also used the software Publish or Perish (Harzing 2007). 937 journals were directly obtained from Google Scholar Metrics, and 423 through Publish or Perish.
3.3 Universalistic variables
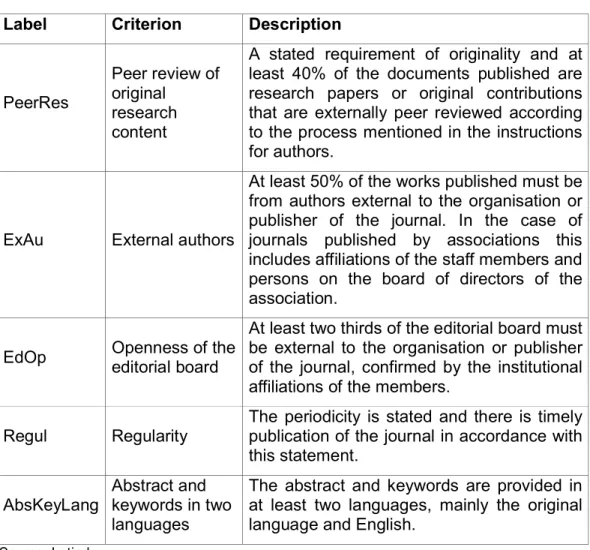
Editorial standards. We selected the characteristics provided by Latindex that are closer to the editorial standards stated by WoS in their web page (Testa 2014). These are: timeliness (i.e. regular periodicity), peer review, internationality of authors and editors, and whether titles and abstracts are available in English. Table 1 shows these variables.
4
For this procedure, the Levenshtein distance function was used. It calculates similarity as the minimum number of characters that have to be inserted, deleted, or replaced in order to transform one word into another word. The implementation was done in PhP language. The routine compared all titles and takes into account country, start year of the journal, and publisher, where available. The list was then manually checked.
2 3 4 5 6 7 8 9 10 11 12 13 14 15 16 17 18 19 20 21 22 23 24 25 26 27 28 29 30 31 32 33 34 35 36 37 38 39 40 41 42 43 44 45 46 47 48 49 50 51 52 53 54 55 56 57 58 59
Table 1 Selected variables based on editorial criteria of WoS Label Criterion Description
PeerRes
Peer review of original research content
A stated requirement of originality and at least 40% of the documents published are research papers or original contributions that are externally peer reviewed according to the process mentioned in the instructions for authors.
ExAu External authors
At least 50% of the works published must be from authors external to the organisation or publisher of the journal. In the case of journals published by associations this includes affiliations of the staff members and persons on the board of directors of the association.
EdOp Openness of the
editorial board
At least two thirds of the editorial board must be external to the organisation or publisher of the journal, confirmed by the institutional affiliations of the members.
Regul Regularity
The periodicity is stated and there is timely publication of the journal in accordance with this statement.
AbsKeyLang
Abstract and keywords in two languages
The abstract and keywords are provided in at least two languages, mainly the original language and English.
Source: Latindex
h-Index. The h-Index is expressed as the x number of papers with at least x
number of citations (Hirsch 2005). For instance, an h-Index of 15 for a journal means that it has published 15 papers with at least 15 citations. One problematic issue of this indicator is its size-dependency. This means that the calculation of the h-Index partially captures the citation impact of the journal and its size in terms of number of articles published. Many bibliometric analysts, e.g. Waltman and van Eck (2012), consider that size should not influence comparisons of journal scientific impact and recommend, instead, a size-independent indicator (Waltman & van Eck 2012, p. 409).
However, to use a size-independent indicator requires reconstructing the impact factor or number of citations for journals that are not covered by WoS. This would have required the very difficult effort of joining citations from WoS and Scopus, and Scielo (which are citation databases). Moreover it would have
2 3 4 5 6 7 8 9 10 11 12 13 14 15 16 17 18 19 20 21 22 23 24 25 26 27 28 29 30 31 32 33 34 35 36 37 38 39 40 41 42 43 44 45 46 47 48 49 50 51 52 53 54 55 56 57 58 59
omitted RedALyC, which is not a citation database. A possible solution is to use the ‘cited reference search’ available in WoS and Scopus but it is very inaccurate, restricts the citations to their journals, and requires manual identification. For these reasons this solution was not convenient.
The h-Index indicator provided by Google Scholar is empirically correlated with WoS’ impact factor (Bornmann & Daniel 2008; Harzing & van der Wal 2009; Franceschet 2010; Hodge & Lacasse 2011; Romero-Torres, Acosta-Moreno & Tejada-Gómez 2013). The impact factor, however, “can be the skewed result of many citations of a few papers rather than the average level of the majority” (Campbell, 2008, p.5). An advantage of using h-Index over the impact factor is that it compares all journals on their most cited papers, which provides a common ground for evaluation and “attenuates the impact of one highly-cited article, because the h-index is not based on mean scores” (Harzing & van der Wal, 2009, p. 43). Also, some preliminary tests on the use of h-Index for evaluative purposes have produced similar results to peer judgement (Bornmann & Daniel 2008), which indicates that the h-Index does not produce substantially unexpected results. Although not ideal because of its size-dependence, based on our previous considerations the h-Index of journals (Braun, Glänzel & Schubert 2006) was chosen to indicate scientific impact in terms of influence (Martin and Irvine 1983).
High editorial standards (HighQ). This variable was used to group journals into those that fulfil all the criteria in table 1 and those that do not fulfil the criteria. It was used to test variation in the sample according to the number of editorial criteria met.
Journal age. This variable shows the time in years from the start of the journal until its indexing in WoS for journals covered by it, or until 2012 for journals not covered by it. It can be expected that established journals are likely to be included in WoS in comparison to new journals (Testa 2014). The age of the journals in the sample is based on their start date as it appears in Latindex.
3.4 Particularistic variables
Country of publication is the nation state where the publisher is located, as reported in Latindex. This variable has been seen as a source of bias in the
2 3 4 5 6 7 8 9 10 11 12 13 14 15 16 17 18 19 20 21 22 23 24 25 26 27 28 29 30 31 32 33 34 35 36 37 38 39 40 41 42 43 44 45 46 47 48 49 50 51 52 53 54 55 56 57 58 59
coverage of WoS (Gibbs 1995; van Leeuwen et al. 2001). Even though some countries do not have journals indexed by WoS, they are kept in the dataset as they constitute part of the scientific production of academic community in Latin America, Spain, and Portugal.
The use of this variable is problematic because it does not always reflect the predominant country in terms of the editorial board or the affiliations of publications of journals. For instance, many Elsevier's journals are likely to appear as produced in the Netherlands but their editorial boards and their authors may be predominantly from other countries. In this case, however, Latin American journals tend to reflect more closely the country in which they are produced, as most of them are published by universities and national professional associations and have a strong national authorship (Chavarro, 2017, chapter 5).
Language. Language is also seen as a source for biased coverage in WoS (van Leeuwen et al. 2001; Lillis & Curry 2010). In this study it refers to the main language of the publication as found in Latindex. Only languages with more than ten journals listed, after the use of the filters, were included in the analyses. These are Spanish, Portuguese, English, and Catalan.
Discipline. The third variable that has been seen as being prone to bias is the discipline of the journal, mainly in the humanities and social sciences (Larivière & Macaluso 2011; Sivertsen & Larsen 2012, p. 572). We use the main Frascati Field of Science (FoS) classification (OECD 2006): natural sciences, social sciences, engineering and technology, medical and health sciences, agricultural sciences, humanities, and multidisciplinary, as found in Latindex.
Gross Domestic Product per Capita (GDPPC2005). GDP represents the monetary value of all goods and services produced in a country and it is a measure of economic performance. We used the 2005 GDP in US thousand dollars per capita. This variable tests whether journals in wealthier economies, which constitute an important market for WoS, are more likely to be covered. The economic information for the countries in the dataset was gathered from
2 3 4 5 6 7 8 9 10 11 12 13 14 15 16 17 18 19 20 21 22 23 24 25 26 27 28 29 30 31 32 33 34 35 36 37 38 39 40 41 42 43 44 45 46 47 48 49 50 51 52 53 54 55 56 57 58 59
the World Bank data series5. The normalisation per capita was used in order to make the GDP more comparable between countries. It has to be noted that this variable violated the linearity of the logit assumption. For this reason, we present the results using GDP per capita tertiles, with T1 identifying the lowest tertile.
3.5 Additional variables
During the course of this research additional variables were identified as potential determinants of indexing by WoS. These are: type of organisation and
type of publication. They could have an impact on coverage by WoS given its focus on commercial publishers and journals published by learned societies. For this reason, they have been included in the analysis, despite not being usually addressed by the literature on coverage.
Type of organisation. This refers to the organisation that publishes the journal. Importantly, most of the journals in WoS are published by commercial companies (Larivière, Haustein & Mongeon 2015), whereas most of the journals in the sample are published by universities. Therefore, one could expect some positive relationship between commercial publishing houses and coverage by WoS. The types of organisation found in Latindex are: governmental, international and educational organisations, learned societies, private companies6 and research institutes.
Type of publication. Most of the publication venues in WoS are academic journals. In the sample, however, there are also academic magazines and trade journals. This variable was used to control for these types of publications.
3.6 Models
We tested three models for inclusion in WoS using logistic regression implemented in R language 7. Logistic regression is suitable when the dependent variable is dichotomous, as is the case in this study (1= included, 0 = not included), and it is widely used in the bibliometrics literature (Thelwall &
5
http://data.worldbank.org/indicator
6
A global trend is the acquisition of information services such as SSRN, publishers such as Woodhead Publishing, journal portfolios such as IP Publishing’s, and other publication media by international publishing houses.
7 https://cran.r-project.org/ 2 3 4 5 6 7 8 9 10 11 12 13 14 15 16 17 18 19 20 21 22 23 24 25 26 27 28 29 30 31 32 33 34 35 36 37 38 39 40 41 42 43 44 45 46 47 48 49 50 51 52 53 54 55 56 57 58 59
Wilson 2014, p. 964). Other statistical techniques require strict conditions to be met with multivariate normality and equal distribution of variance and covariance matrices. This is the case of discriminant analysis. In contrast, logistic regression is robust when the data does not meet such conditions (Hair, Tatham & Black 2005, p. 276).
The initial explanatory variables were: editorial standards, scientific impact ( h-Index) of the journal, and journal age (universalistic criteria); country, language, and discipline (particularistic criteria); and type of publishing organisation and
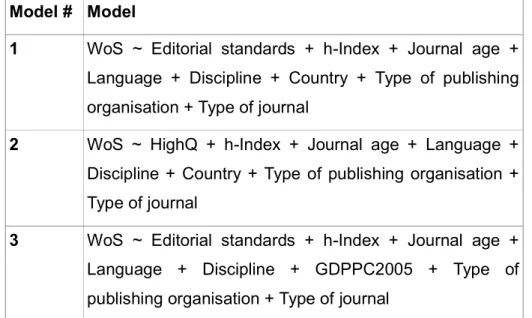
type of journal (additional variables) – model 1 in table 2. We also performed a second regression to differentiate journals fulfilling all editorial criteria (HighQ) from the others (model 2 in table 2), and a third regression in which we replaced the variable Country with 2005 GDP per capita tertiles (model 3).
Table 2 Models tested through logistic regression
Model # Model
1 WoS ~ Editorial standards + h-Index + Journal age + Language + Discipline + Country + Type of publishing organisation + Type of journal
2 WoS ~ HighQ + h-Index + Journal age + Language + Discipline + Country + Type of publishing organisation + Type of journal
3 WoS ~ Editorial standards + h-Index + Journal age + Language + Discipline + GDPPC2005 + Type of publishing organisation + Type of journal
3.7 Statistical analysis
A reduction of -2 times log-likelihood (-2LL) achieved by the models, and higher values of pseudo-ܴଶ (Hosmer & Lemeshow’s ܴଶ and Nagelkerke’s ܴଶ) were used to assess the models (Field, Miles & Field 2012, 315–316; 765). Also, classification accuracy by chance (Bayaga 2010, p. 293) was used as a
2 3 4 5 6 7 8 9 10 11 12 13 14 15 16 17 18 19 20 21 22 23 24 25 26 27 28 29 30 31 32 33 34 35 36 37 38 39 40 41 42 43 44 45 46 47 48 49 50 51 52 53 54 55 56 57 58 59
benchmark to measure the effectiveness of the models for the specific sample of journals. This measure is calculated as the sum of the squared proportion of records covered by WoS and the squared proportion of records not covered by it (0.22+0.82 = 68%).
To examine the issue of journal coverage in WoS through the universalistic and particularistic variables, we applied some recommendations from the approach known as estimation thinking (Cumming, 2014; Schneider, 2015). Estimation thinking is a way of formulating research questions and analysing data that allows for quantitative measures rather than dichotomous indicators of significance, which is the practice in null hypothesis testing. In short, hypothesis testing asks whether a phenomenon happens, or whether there is a significant relationship (the “truth” value of a premise), while estimation thinking asks about the extent to which a phenomenon happens or the magnitude of relationships. In line with estimation thinking, in this study we do not make use of p-values. The reasons for this (Cumming 2014) are, firstly, that our study is not based on a random sample; therefore p-values are inappropriate as indicators to generalise to the entire population of journals. Secondly, p-values do not show the extent of uncertainty in the findings, which must be acknowledged and reported especially in exploratory studies such as ours (Cohen, 1995, p. 1002; Ioannidis 2005). Thirdly, p-values exhibit high variation according to the sample size and selection ranging from significant to non-significant (Cumming 2014). For these reasons, instead of the common practice of reporting p-values we provide confidence intervals. This allows subsequent studies to measure the reduction of uncertainty and thus build on these exploratory results.
In order to have a qualitative indication of the effect size of the different variables, we used odd ratios and the likeliness that they are positively or negatively related to the dependent variable (Batterham and Hopkins 2006). One way to do this is to assess the odd ratio observed in regards to the overlap between positive and negative values of its confidence interval. If there is substantial overlap, the information provided is ambiguous and it is harder to understand its effect. Otherwise, when there is no substantial overlap it is clearer that the effect size observed is positive or negative. In this paper we
2 3 4 5 6 7 8 9 10 11 12 13 14 15 16 17 18 19 20 21 22 23 24 25 26 27 28 29 30 31 32 33 34 35 36 37 38 39 40 41 42 43 44 45 46 47 48 49 50 51 52 53 54 55 56 57 58 59
used the categories positive, trivial, and negative to describe each relationship within a 90% confidence interval. To these categories we assigned a probability based on the following thresholds: 0= most unlikely; 0.5% = very unlikely; 5% = unlikely; 25% = possibly; 75% = likely; 95% = very likely; 99.5% = most likely (Hopkins, 2007). For these calculations we used a spreadsheet developed by Hopkins (2007)8 which assumes that if a log-normally distributed study is repeated many times it approximates a normal distribution (for an application of a similar approach see Petersen, Wilson, & Hopkins 2004). However, as our study is not based on a random sample, we used these numbers only as indicators and not as inferences about the journal population. The chances that an effect is positive, trivial, or negative depend on an estimation of the smallest worthwhile value. In this work we use 1.1 odd ratio as the smallest worthwhile value, as suggested by Hopkins (2007).
4. Results
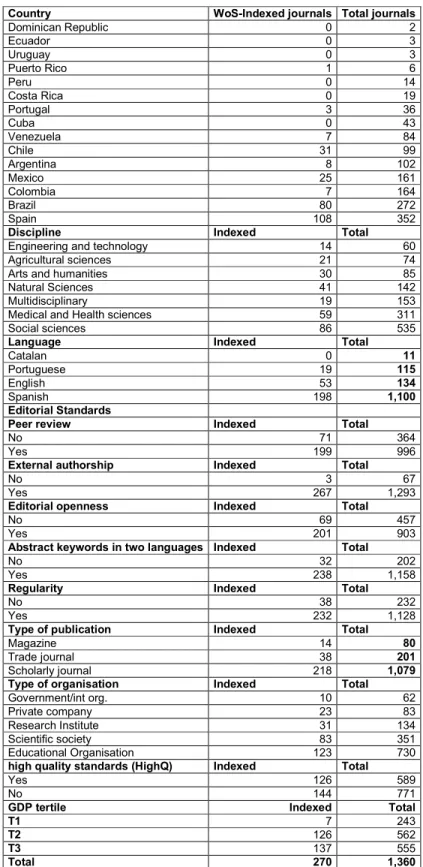
In this section we present the regression results, followed by an analysis of the goodness of fit of the models, and an exploration of predicted probabilities. According to the data, journals are concentrated on Spain, Brazil, Colombia, Mexico, Chile, and Argentina. These countries produce 85% of the journals in the sample. In terms of disciplines, the social sciences and medical and health sciences are the most prominent (62% of the journals). Spanish prevails as the main language for all journals produced (81%). It has to be noted that there are no journals in Catalan covered by WoS in the sample.
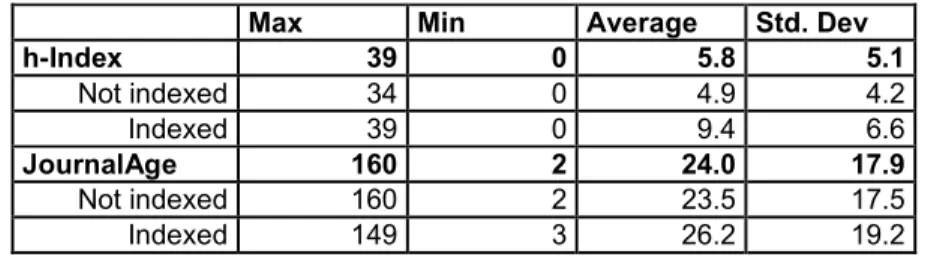
Regarding editorial standards, the ones with the highest variability are editorial openness (EdOp) and peer review (PeerRes). They are met by 66% and 73% of the journals, respectively. These two variables are related to the control of quality of the works published and the diversity in editorial policies. The other editorial variables exhibit a less obvious contrast and are met by at least 80% of the journals. Compliance with all standards, however, is shown by less than half of the journals. Table 3 shows the distribution of all the categorical variables. Table 4 shows the descriptive statistics for the numerical variables. The sample
8 Available at http://www.sportsci.org/resource/stats/xcl.xls 2 3 4 5 6 7 8 9 10 11 12 13 14 15 16 17 18 19 20 21 22 23 24 25 26 27 28 29 30 31 32 33 34 35 36 37 38 39 40 41 42 43 44 45 46 47 48 49 50 51 52 53 54 55 56 57 58 59
has diverse observations in terms of h-Index and journal age. Important differences are seen between the maximum and minimum values for these variables. 2 3 4 5 6 7 8 9 10 11 12 13 14 15 16 17 18 19 20 21 22 23 24 25 26 27 28 29 30 31 32 33 34 35 36 37 38 39 40 41 42 43 44 45 46 47 48 49 50 51 52 53 54 55 56 57 58 59
Table 3 Categorical variables
Country WoS-Indexed journals Total journals
Dominican Republic 0 2 Ecuador 0 3 Uruguay 0 3 Puerto Rico 1 6 Peru 0 14 Costa Rica 0 19 Portugal 3 36 Cuba 0 43 Venezuela 7 84 Chile 31 99 Argentina 8 102 Mexico 25 161 Colombia 7 164 Brazil 80 272 Spain 108 352
Discipline Indexed Total Engineering and technology 14 60 Agricultural sciences 21 74 Arts and humanities 30 85 Natural Sciences 41 142 Multidisciplinary 19 153 Medical and Health sciences 59 311 Social sciences 86 535
Language Indexed Total
Catalan 0 11
Portuguese 19 115
English 53 134
Spanish 198 1,100
Editorial Standards
Peer review Indexed Total
No 71 364
Yes 199 996
External authorship Indexed Total
No 3 67
Yes 267 1,293
Editorial openness Indexed Total
No 69 457
Yes 201 903
Abstract keywords in two languages Indexed Total
No 32 202
Yes 238 1,158
Regularity Indexed Total
No 38 232
Yes 232 1,128
Type of publication Indexed Total
Magazine 14 80
Trade journal 38 201
Scholarly journal 218 1,079 Type of organisation Indexed Total Government/int org. 10 62
Private company 23 83
Research Institute 31 134 Scientific society 83 351 Educational Organisation 123 730 high quality standards (HighQ) Indexed Total
Yes 126 589
No 144 771
GDP tertile Indexed Total
T1 7 243
T2 126 562
T3 137 555
Total 270 1,360
Source: Own elaboration based on Latindex, WoS, Scopus, Scielo, and RedALyC 2 3 4 5 6 7 8 9 10 11 12 13 14 15 16 17 18 19 20 21 22 23 24 25 26 27 28 29 30 31 32 33 34 35 36 37 38 39 40 41 42 43 44 45 46 47 48 49 50 51 52 53 54 55 56 57 58 59
Table 4 Numerical variables
Max Min Average Std. Dev
h-Index 39 0 5.8 5.1 Not indexed 34 0 4.9 4.2 Indexed 39 0 9.4 6.6 JournalAge 160 2 24.0 17.9 Not indexed 160 2 23.5 17.5 Indexed 149 3 26.2 19.2
Source: Own elaboration based on Latindex, WoS, Scopus, Scielo, RedALyC, and Google Scholar
4.1 Regression results
Table 5 shows the logistic regression results using exponential coefficients and confidence intervals (in brackets). To repeat, three models were calculated. The first model included all disaggregated variables. The second model substituted the individual editorial standards for a variable aggregating the journals which meet all five editorial standards. Finally, the third model aggregated countries according to GDP per capita tertile.
The three models show the extent to which universalistic and particularistic variables are related to being covered by WoS. Starting with the universalistic variables, the biggest positive effect is given by external authorship9. The odds for journals meeting this standard is 2.7 (CI 0.9 to 7.7) times that of journals without it. Another positive effect is shown by the variable editorial openness. The odds for journals fulfilling this standard are 1.4 (CI 0.9 to 2) times higher than for journals not complying with it. H-Index and journal age also had positive relationships with WoS coverage. For each unit increase in h-Index a journal increases its odds of being covered by 1.18 (CI 1.15 to 1.24) times. Although its effect might seem small, given that in theory the h-index of a journal can increase substantially, this variable could have a large effect on indexing. Conversely, journal age is likely to have a trivial effect on indexing as its change in odds for every year is 1.01 (CI 1 to 1.02). For other universalistic variables it was harder to establish a positive or negative effect. For instance, when considered alone, peer review, regularity, and Abstract/keywords in two
9
When describing results for variables that were used in different models, we averaged the mean effect sizes and reported the minimum and maximum confidence interval values among the models as an estimation of the widest margin of error. Meta-analysis techniques, which allow to mitigate uncertainty introduced by measurement error, were not used because the observations are not independent (Cumming, 2012, chapter 7).
2 3 4 5 6 7 8 9 10 11 12 13 14 15 16 17 18 19 20 21 22 23 24 25 26 27 28 29 30 31 32 33 34 35 36 37 38 39 40 41 42 43 44 45 46 47 48 49 50 51 52 53 54 55 56 57 58 59
languages could have negative or positive effects. However, when journals meet all editorial standards (HighQ), their odds are 1.7 (CI 1.3 to 2.2) times higher than journals failing to meet all standards.
In regards to particularistic variables, the biggest positive effects are seen for GDP: The odds of being included by WoS for journals in the middle and top tertiles are respectively 8 (CI 4 to 16) and 12 (CI 6 to 24) times higher than for journals in the lowest tertile. These results are further confirmed by the lower odd ratios found for journals from Argentina, Colombia, Brazil, Mexico, Venezuela, and Portugal in comparison to journals from Spain: the negative effect size of these journals range from 0.6 (CI 0.4 to 0.9) for Brazilian to 0.08 (CI 0.04 to 0.17) for Colombian journals. This means that they are between 2 and 12.5 times less likely to being covered than Spanish journals.
In terms of discipline, the clearest effect sizes are seen for the social sciences, health and medical sciences, and multidisciplinary sciences. Journals from these disciplines are less likely than journals from the natural sciences to be included by WoS. Their odds are between 2.5 and 3.3 times lower than journals from the natural sciences. Conversely, the odds of the arts and humanities are 2.13 (CI 0.85 to 3.72) times higher than the natural sciences journals although the result is more uncertain.
With regards to language, English shows a likely positive effect on indexing of 1.5 (CI 0.96 to 2.4) times the odds of Spanish language journals, while Portuguese has a likely negative effect of 0.6 (CI 0.3 to 1.2), i.e., around 1.6 times lower odds than Spanish journals. Finally, journals produced by private companies and research institutes seem to have some advantage over journals produced by universities. The odds of being included by WoS are 1.7 (CI 0.93 to 3.16) for private companies and 1.5 (CI 0.8 to 2.5) for research institutes.
2 3 4 5 6 7 8 9 10 11 12 13 14 15 16 17 18 19 20 21 22 23 24 25 26 27 28 29 30 31 32 33 34 35 36 37 38 39 40 41 42 43 44 45 46 47 48 49 50 51 52 53 54 55 56 57 58 59
Table 5 Results of the logistic regression
Dependent Variable: Indexed by WoS
Variables Model 1 Model 2 Model 3 Qualitative
overall effect size
Editorial Standards
Peer review 0.97 (0.70,1.34) 1.00 (0.73,1.37) Unclear External authorship 2.68 (0.93,7.74) 2.70 (0.95,7.69) Likely positive Editorial openness 1.31 (0.94,1.82) 1.47 (1.07,2.02) Likely positive Regularity 1.15 (0.77,1.71) 1.15 (0.78,1.70) Unclear Abstract / keywords in two languages 1.20 (0.77,1.85) 1.36 (0.89,2.10) Unclear Journal Characteristics
h5index 1.18 (1.15,1.22) 1.18 (1.15,1.22) 1.20 (1.17,1.24) Most likely positive journalAge 1.01 (1.01,1.02) 1.01 (1.01,1.02) 1.01 (1.00,1.02) Most likely trivial Magazine 1.44 (0.79,2.62) 1.41 (0.77,2.58) 1.48 (0.83,2.66) Unclear Trade Journal 0.79 (0.53,1.18) 0.77 (0.52,1.16) 0.86 (0.58,1.27) Unclear Government/int org. 1.41 (0.67,2.94) 1.35 (0.65,2.82) 1.33 (0.66,2.67) Unclear Private Company 1.61 (0.92,2.81) 1.62 (0.93,2.82) 1.84 (1.08,3.16) Likely positive Research Institute 1.55 (0.95,2.53) 1.54 (0.94,2.52) 1.31 (0.83,2.05) Likely positive Scientific society 0.82 (0.57,1.18) 0.80 (0.56,1.15) 0.86 (0.61,1.23) Unclear
Discipline
Agricultural sciences 1.14 (0.61,2.14) 1.11 (0.59,2.07) 1.18 (0.64,2.17) Unclear Arts and humanities 1.57 (0.88,2.8) 1.52 (0.85,2.71) 2.13 (1.22,3.72) Likely positive Engineer. and tech. 1.24 (0.6,2.55) 1.26 (0.62,2.57) 1.41 (0.70,2.85) Unclear
Med. and health sci. 0.3 (0.18,0.49) 0.29 (0.18,0.47) 0.34 (0.21,0.55) Most likely negative Multidisciplinary 0.26 (0.14,0.46) 0.25 (0.14,0.44) 0.30 (0.17,0.53) Most likely negative Social sciences 0.35 (0.22,0.54) 0.33 (0.21,0.51) 0.40 (0.26,0.62) Most likely negative
Language
English 1.45 (0.9,2.33) 1.53 (0.96,2.43) 1.48 (0.97,2.26) Likely positive Portuguese 0.62 (0.34,1.13) 0.64 (0.35,1.17) 0.61 (0.36,1.03) Likely negative
Country
Argentina 0.19 (0.1,0.38) 0.18 (0.09,0.36) Most likely negative Brazil 0.55 (0.35,0.87) 0.56 (0.36,0.89) Very likely negative Chile 0.75 (0.46,1.22) 0.68 (0.42,1.10) Unclear
Colombia 0.08 (0.04,0.17) 0.08 (0.04,0.16) Most likely negative Mexico 0.39 (0.24,0.62) 0.39 (0.25,0.63) Most likely negative Portugal 0.22 (0.07,0.68) 0.22 (0.07,0.69) Very likely negative Venezuela 0.30 (0.14,0.61) 0.30 (0.15,0.63) Very likely negative
Other variables
HighQ 1.66 (1.25,2.20) Very likely positive
GDPPC Tertile T2 7.92 (3.97,15.81) Most likely positive GDPPC Tertile T3 12.27 (6.17,24.42) Most likely positive
Constant 0.06 (0.02,0.22) 0.2 (0.11,0.35) 0 (0,0.01) Observations 1,360 1,360 1,360 Hosmer & Lemeshow R2 0.26 0.26 0.23 Nagelkerke R2 0.36 0.36 0.33 -2 Log Likelihood 1,007.82 1004.72 1,038.72
Note 1: The data show value and confidence interval (in parenthesis).
Note 2: Reference categories: Spain for country, Spanish for language, natural sciences for discipline, scholarly journal for type of journal, educational organisation for type of 2 3 4 5 6 7 8 9 10 11 12 13 14 15 16 17 18 19 20 21 22 23 24 25 26 27 28 29 30 31 32 33 34 35 36 37 38 39 40 41 42 43 44 45 46 47 48 49 50 51 52 53 54 55 56 57 58 59
organisation. Probabilities based on a minimum worth value of 1.1 odds ratio.
Note 3: only countries and languages with significant coefficients are shown. Countries excluded from the table are: Chile, Costa Rica, Cuba, Dominican Republic, Ecuador, Peru, Puerto Rico, and Uruguay. Language excluded: Catalan. Each one of the three models is specified in table 2. 2 3 4 5 6 7 8 9 10 11 12 13 14 15 16 17 18 19 20 21 22 23 24 25 26 27 28 29 30 31 32 33 34 35 36 37 38 39 40 41 42 43 44 45 46 47 48 49 50 51 52 53 54 55 56 57 58 59
4.2 Further interpretation of regression results based on examples and predicted probabilities
Some examples help to expand the results obtained from the regression. When exploring countries, the most extreme instance is that of journals such as Cuban, which are completely absent from WoS. However, there are some Cuban journals with h-Index and age equal to, or above, other journals covered by WoS. This is the case of the Revista Cubana de Salud Pública. This journal is 18 years old and has an h-Index of 14 (6 points above average in its field of medical and health sciences). WoS indexes 41 journals with equal or lower h-Index.
An interesting case is that of journals in a similar discipline that have comparable universalistic criteria but different indexing status. For instance,
Cadernos de pesquisa Fundação Carlos Chagas is a Brazilian journal on Education that has been published since 1971 and has an h-index of 12. The Spanish journal Revista de Educación (Madrid) started in 1952 and has an h-index of 11. Despite the similarity of their indicators, the Spanish journal was indexed10 while the Brazilian was not at the time of data analysis.
Other cases could be mentioned, such as the case of 21 Brazilian journals in the social sciences that despite having a higher h-Index than Spain’s average in the same field (avg = 8) are not indexed. This applies more generally to journals in the social sciences. They have a lower probability of being indexed by WoS as compared to journals in the natural sciences, despite similar average indicators on h-Index (8 for social sciences and 7 for natural sciences) and age (30 for social sciences and 25 for natural sciences). Below we present a general overview to further explore the above observations. Figure 1 shows graphically the predicted probability of inclusion in WoS at every level of h-Index for the top five producers of journals in the sample, keeping other variables at their means. It can be observed that other things being equal, journals produced in Spain are more likely than others to be covered by WoS at every level of h-index. It has to be noted that the probabilities of journals from Spain, Brazil, and Mexico in the
10
This journal has an impact factor in 2013 of 0.2 (Revista de Educación 2016) 2 3 4 5 6 7 8 9 10 11 12 13 14 15 16 17 18 19 20 21 22 23 24 25 26 27 28 29 30 31 32 33 34 35 36 37 38 39 40 41 42 43 44 45 46 47 48 49 50 51 52 53 54 55 56 57 58 59
sample tend to converge at the highest levels of h-Index. However, Colombia and Argentina show lower odds even at these h-Index levels.
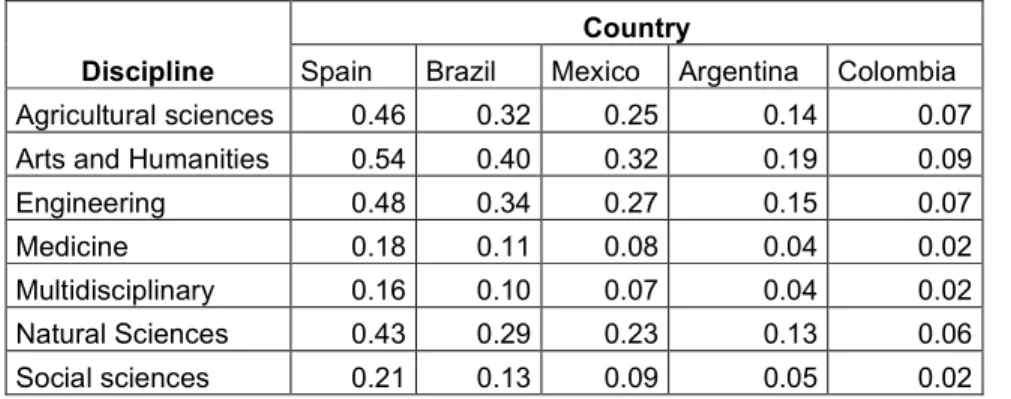
Figures 2 and 3 show differences in probability of being covered for disciplines and languages respectively. It can be seen that journals from arts and humanities and natural sciences have higher probabilities of being covered by WoS at every level of h-Index than journals from the social sciences and health and medicine. Meanwhile, English dominates as compared to Spanish and Portuguese. Finally, table 6 provides predicted probabilities by discipline and country, keeping other variables at their means. It can be seen that the probability of a journal from a certain discipline varies by country and vice versa.
2 3 4 5 6 7 8 9 10 11 12 13 14 15 16 17 18 19 20 21 22 23 24 25 26 27 28 29 30 31 32 33 34 35 36 37 38 39 40 41 42 43 44 45 46 47 48 49 50 51 52 53 54 55 56 57 58 59
Figure 1 Predicted probability of inclusion by WoS at every level of h-Index for the top five producers of journals in Latin America, Spain, and Portugal
Source: Own elaboration based on regression results from model 2, using software package R 2 3 4 5 6 7 8 9 10 11 12 13 14 15 16 17 18 19 20 21 22 23 24 25 26 27 28 29 30 31 32 33 34 35 36 37 38 39 40 41 42 43 44 45 46 47 48 49 50 51 52 53 54 55 56 57 58 59
Figure 2 Predicted probability of inclusion by WoS at every level of h-Index for journals from selected disciplines in Latin America, Spain, and Portugal
Source: Own elaboration based on regression results from model 2, using software package R 2 3 4 5 6 7 8 9 10 11 12 13 14 15 16 17 18 19 20 21 22 23 24 25 26 27 28 29 30 31 32 33 34 35 36 37 38 39 40 41 42 43 44 45 46 47 48 49 50 51 52 53 54 55 56 57 58 59
Figure 3 Predicted probability of inclusion by WoS at every level of h-Index journals published in English, Spanish, and Portuguese in Latin
America, Spain, and Portugal
2 3 4 5 6 7 8 9 10 11 12 13 14 15 16 17 18 19 20 21 22 23 24 25 26 27 28 29 30 31 32 33 34 35 36 37 38 39 40 41 42 43 44 45 46 47 48 49 50 51 52 53 54 55 56 57 58 59
Table 6 Predicted probability of inclusion by WoS for the top five producers of journals according to disciplines
Discipline
Country
Spain Brazil Mexico Argentina Colombia Agricultural sciences 0.46 0.32 0.25 0.14 0.07 Arts and Humanities 0.54 0.40 0.32 0.19 0.09 Engineering 0.48 0.34 0.27 0.15 0.07 Medicine 0.18 0.11 0.08 0.04 0.02 Multidisciplinary 0.16 0.10 0.07 0.04 0.02 Natural Sciences 0.43 0.29 0.23 0.13 0.06 Social sciences 0.21 0.13 0.09 0.05 0.02
Source: Own elaboration based on regression results from model 1, using software package R 2 3 4 5 6 7 8 9 10 11 12 13 14 15 16 17 18 19 20 21 22 23 24 25 26 27 28 29 30 31 32 33 34 35 36 37 38 39 40 41 42 43 44 45 46 47 48 49 50 51 52 53 54 55 56 57 58 59
4.3 Goodness of fit and accuracy of the models
Models 1 and 2 have an accuracy of 77% and model 3 has an accuracy of 76%, which constitute an improvement over an estimated accuracy by chance of 68%. Pseudo-ܴଶ measures are between 23% and 36%, and models 1 and 2 produced the highest reductions in -2LL. All the measures show that the three models improve classification by chance and are useful in understanding the relationships between universalistic and particularistic variables with regards to coverage by WoS.
4.4 Robustness
The results presented were shown to be robust after tests of variance inflation factor (VIF), linearity of the logit, and outlier detection (see supplementary material). Following Hosmer, Lemeshow and Sturdivant (2013, pp. 197, 360) outliers were detected by looking at standardised residuals greater than 3 or less than -3, as well as influential observations with Cook's distance greater than 1. The accuracy of the models improved after controlling for outliers by 3%, reaching approximately 80%. The coefficients remained stable in direction although they changed in strength for countries as most of the outliers were concentrated on countries with few indexed journals. After checking the outliers for correctness of their data, we confirmed that they are valid observations of journals produced in Latin America, Spain, and Portugal. In addition, all observations fell within accepted VIF and tolerance values of less than 10, indicating that multicollinearity is not a concern in this sample. For these reasons the models were kept without modification.
5. Discussion and conclusions
The findings in this article showed the extent to which different universalistic and particularistic variables are related to the inclusion of journals in WoS: given two journals from the same country, discipline, and language, universalistic characteristics such as h-index may have a large positive effect on their inclusion. However, given two journals with equal h-index, age, and editorial standards, one may have a large advantage over the other because of its place of publication, discipline, language or other ascribed characteristics.
2 3 4 5 6 7 8 9 10 11 12 13 14 15 16 17 18 19 20 21 22 23 24 25 26 27 28 29 30 31 32 33 34 35 36 37 38 39 40 41 42 43 44 45 46 47 48 49 50 51 52 53 54 55 56 57 58 59
Based on the results, it is possible to say that research assessments that rely too heavily on the assumption that WoS (and other bibliographic databases) assess journals only on the basis of universalism, fail to acknowledge that some journals are judged “more equally” than others by these databases. This confirms for journals what Zuckerman and Merton (1971, p. 86) and Cole and Cole (1973, p. 37) observed for peer review and appointment in academic positions: that both universalistic and particularistic standards may be involved in the evaluation of science (in this study we showed the degree to which this happens in the inclusion of journals in a well-established database). For this reason, attributing values of ‘quality’ only to journals based on assumptions of universalism in the assessment of science is misleading.
Our study showed different effect sizes for universalistic and particularistic variables. With regards to the positive effect size of h-Index, it was noted that it can be large in theory because this indicator can be increased by the number of papers and citations. However, given that journals in Latin America, Spain, and Portugal do not usually have high h-Indices and that increasing citation-based indicators has proven very difficult for non-English language journals, it is unrealistic to expect a qualitative jump on this indicator. Such an expectation is also exacerbated by the fact that these journals are published mainly by universities located in low and middle income countries. The option, in terms of universalistic characteristics, is for editors to increase the editorial standards of journals with the expectation that this will improve their chances of being covered by WoS. In fact, improvement of editorial standards has been one of the main objectives of regional initiatives such as Latindex (Cetto, Alonso-Gamboa & Cordoba Gonzalez 2010). Yet, as we have shown in model 2, fulfilling all editorial standards does not yield an improvement in odds comparable to, for instance, being produced in Spain.
Despite the above findings, WoS is promoted by policy makers in regions such as Latin America, and by WoS itself, as a point of reference for editors to improve editorial standards. This implies that they are being oriented in the direction of WoS’ particular coverage distribution. This coverage distribution, as it has been shown, favours certain types of journals. The negative coefficients for all countries as compared to Spain, coupled with the small but positive effect
2 3 4 5 6 7 8 9 10 11 12 13 14 15 16 17 18 19 20 21 22 23 24 25 26 27 28 29 30 31 32 33 34 35 36 37 38 39 40 41 42 43 44 45 46 47 48 49 50 51 52 53 54 55 56 57 58
size of English as compared to Spanish and Portuguese suggest that WoS is oriented towards specific research communities that are not the focus of the majority of journals in Latin America, Spain, and Portugal. Furthermore the advantage of Spanish over Portuguese and the different direction and effect sizes of the coefficients for disciplines reinforces this observation. Therefore, being covered by WoS is to a good extent an indicator of community belonging or readership and less an indicator of quality.
An objection to this argument could be that arts and humanities journals in the sample have higher odds on average than natural sciences journals, which does not seem to support the global analyses of coverage of WoS (see, for instance, Chavarro, 2017, chapter 5). As a preliminary answer, it could be argued that these results show some effect of the particular disciplinary composition of communities in Latin America, Spain, and Portugal on the coverage of WoS. This effect may be due to the market opportunity that emerging economies represent for database companies. In relation to this point, the large positive effect of GDP on indexing suggests that coverage decisions such as which disciplines to include and the extent of that inclusion (see Testa 2011) are affected by commercial interests. A more thorough study on how database coverage and market expansion are linked in the case of emerging economies could help to better understand this issue, and to predict whether the disciplinary distribution of journals in these databases is likely to change substantially in the near future.
Another possible reason for better representation of humanities journals, contributed by an anonymous reviewer to whom we are indebted, is that Area Studies (specifically Latin American studies) and Romance languages and literatures are worldwide research fields where the most important publication channels tend to be produced by countries with Spanish or Portuguese as their native language. Other explanations include international pressure from countries with a well-established scientific tradition such as Germany to cover more journals from non-traditional disciplines and changes of guidelines from new owners of the databases, or internal pressures from selection committees of journals that may recommend expansion of content in WoS. In any case, the
2 3 4 5 6 7 8 9 10 11 12 13 14 15 16 17 18 19 20 21 22 23 24 25 26 27 28 29 30 31 32 33 34 35 36 37 38 39 40 41 42 43 44 45 46 47 48 49 50 51 52 53 54 55 56 57 58 59
most likely explanation for changes in coverage is a combination of factors that have less to do with journal ‘quality’ than any of the aforementioned reasons. A relevant finding that helps to substantiate the above point is that private companies and research institutes have higher odds than universities to be covered by WoS11. Latin America has a journal publishing tradition that dates back to the 1960s. Since then, most journals have been produced by universities and made available openly, even before the term “open access” became popular. This contrasts with the US or the Netherlands in which big publishers play a dominant role.
Although the effect size of private companies in our study is small as compared to other effect sizes, it could signal the beginning of a radical change from public funding to private-funding in the journal publishing business in Latin America, Spain and Portugal. In these regions, publishing houses such as Emerald, Taylor and Francis, and Elsevier are acquiring journals like CLADEA (a business and management journal produced by Latin American business and management faculties). They also provide editorial services to journals in the region, which probably increases their publication costs. There are also some pharmaceutical companies, and other private organisations that produce journals classified in this category.
Empirically, our study has contributed to a more detailed understanding of the distribution of journals in WoS, which is one of the most important global data sources for research evaluation. Significantly, our analysis expands conventional coverage analyses because it tests the criteria for coverage, as prompted by Garfield (1997), rather than describing it only on the basis of the concentration of journals.
With respect to methodology, we used estimation thinking instead of conventional null hypothesis testing12. Estimation thinking allowed us to see some relationships that were absent in our initial analysis based on null hypothesis testing. Specifically, the use of p-values to assess statistical significance of relationships in our initial analysis underestimated the effect
11 We thank an anonymous reviewer for bringing this issue to our attention. 12
This was suggested by an anonymous reviewer, to whom we are indebted. 2 3 4 5 6 7 8 9 10 11 12 13 14 15 16 17 18 19 20 21 22 23 24 25 26 27 28 29 30 31 32 33 34 35 36 37 38 39 40 41 42 43 44 45 46 47 48 49 50 51 52 53 54 55 56 57 58 59