Swedish University of Agricultural Sciences (SLU)
Faculty of Landscape Planning, Horticulture and Agricultural Sciences Department of Horticulture
Coffee, a Fair Trade?
– A study about Fairtrade certified Gayo coffee farmers in Aceh,
Indonesia
Anna-Carin Almqvist
Självständigt arbete vid LTJ-fakulteten, SLU • 15 hp • Grund C Hortonomprogrammet
Alnarp 2011
Coffea arabica produced in Aceh, Indonesia. Photo: Anna-Carin Almqvist
2
Coffee, a Fair Trade?
– A study about Fairtrade certified Gayo coffee farmers in Aceh, Indonesia
Kaffe, en Rättvis Affär?
– En studie om Fairtrade-certifierade Gayo-kaffeodlare i Aceh, Indonesien
Anna-Carin Almqvist
Supervisor: Marie Olsson, Horticulture, SLU
Assistant Supervisors: Lena Ekelund, SLU
Yusya Abubakar, UNSYIAH Ashabul Anhar, UNSYIAH Heru Widayat, UNSYIAH
Examiner: Hans Lindqvist, Horticulture, SLU
Credits: 15 hec
Level: Basic C
Subject: Biology
Course title: Examensarbete inom Hortonomprogrammet
Course code: EX0369
Programme/education: Hortonomprogrammet
Place of publication: Alnarp
Year of publication: 2011
Picture Cover: Anna-Carin Almqvist
Online publication: http://stud.epsilon.slu.se
Key Words: Coffee, Coffea arabica, Fairtrade, certifications, Aceh, Indonesia, Gayo coffee
Swedish University of Agricultural Sciences (SLU)
Faculty of Landscape Planning, Horticulture and Agricultural Sciences Department of Horticulture
3
Acknowledgements
First I want to thank my supervisor, Marie Olsson, and all assistant supervisors for guiding through this project and thesis. Thanks to Asia-Link and the DOCUMAP project for participa-tion in the exchange programme as a sandwich student. Thanks to Koperasi Baitul Qiradh Baburrayyan for help during the interview process. Thanks to all interviewees for their wil-lingness to contribute as well as for valuable information to this study. Further on I want to thank all who has helped me during this project.
Anna-Carin Almqvist
4
Abstract
Today there are different types of certifications of different products. Fairtrade is the most common certification in the world. Fairtrade is a worldwide non-profit, multi-stakeholder organization. Fairtrade certified producer organizations represent over one million farmers and workers in Latin America, Africa and Asia. The vision of Fairtrade is a world in which all producers can enjoy sustainable livelihoods, secure, fulfill their potential and decide on their future. Fairtrade mean they offer their producers stable prices, premiums, partnership and em-powerment. There are many discussions if Fairtrade really are fair for the producers and if the producers will get what Fairtrade promises.
During later years the interest for Fairtrade certified products has increased. One of their most common certified products is coffee. As such coffee is the most important export from third world countries. Indonesia is one of the countries who had produced coffee for the longest time. Today Indonesia is the world’s third largest coffee producer and will answer for approx-imately 7% of the coffee production in the world.
The aim with this thesis was to investigate what the farming situation looked like for coffee farmers in Aceh, Indonesia and to see if there were any benefits for Fairtrade certified farmers as compared to farmers without certification. Further the aim was also to investigate if the certified farmers experienced any benefits. Factors of income and harvest were compared be-tween the farmers.
The investigation consists of a literature study and a field study made in the central of Aceh, Indonesia, were interviews with the farmers was included. The investigation area is famous for its Gayo Mountain Coffee which is cultivated on hills in a production area with an altitude of 1100-1300 meters. The farmers are small-scale producers with an average of one hectare land and many of the farmers are using intercropping.
The result from the investigation showed that the farmers without Fairtrade certification had a higher income per produced kilogram of coffee than the farmers who had Fairtrade certifica-tion, even if these experienced their income increased after certification. The certified farmers also experienced that the help and farming advice from the Fairtrade cooperative had helped them to increase their yield. The result also showed that the yield from the certified farmers was considerably larger, than for uncertified farmers, both calculated per hectare and per tree.
5
Sammanfattning
Det finns idag flera olika typer av certifieringar. Fairtrade är idag den vanligaste certifieringen i världen. Fairtrade är en organisation som ej är vinstdrivande, men som samtidigt är en multi-intressent på marknaden. Fairtrade-certifierade producentorganisationer representerar över en miljon arbetare och odlare i Latinamerika, Afrika och Asien. Fairtrades vision är att alla pro-ducenter ska kunna leva under hållbara förhållanden och säkerhet, samtidigt som de ska kun-na nå sikun-na mål och bestämma över sin framtid. Fairtrade mekun-nar att de erbjuder sikun-na producen-ter stabila priser, premier, partnerskap samt möjlighet till att bestämma själva. Det diskuproducen-teras på många håll om Fairtrade egentligen är rättvist för producenterna och om de verkligen får vad som lovas.
Under de senaste åren har intresset för Fairtrade-certifierade produkter ökat. En av deras största märkta produkter är kaffe. Kaffe i sig är även en av den mest viktiga exportvaran från länder i tredje världen. Ett av de länder som har producerat kaffe allra längst är Indonesien. Idag är Indonesien världens tredje största kaffeproducent och motsvarar ca 7 % av världens kaffeproduktion.
Syftet med detta arbete var att undersöka hur odlingssituationen såg ut för kaffeodlare i Aceh, Indonesien, samt att se om det var några fördelar för de Fairtrade-certifierade odlarna jämfört med odlare utan certifiering, och se om de certifierade odlarna upplevde fördelar. Faktorerna inkomst per producerat kilo kaffe samt mängden skörd jämfördes mellan odlarna.
Undersökningen består av en litteraturstudie samt en fältstudie gjord i centrala Aceh, Indone-sien, där intervjuer av kaffeodlare ingick. Undersökningsområdet är känt för sitt Gayo-kaffe, som odlas på sluttningar i ett produktionsområde med en altitud på 1110-1300 meter. Odlarna har småskalig produktion på ca 1 ha och många odlare odlar flera grödor.
Resultatet av den här undersökningen visade att de odlare som inte var certifierade med Fairt-rade hade en högre inkomst per producerat kilo kaffe än de odlare som var certifieFairt-rade, även om dessa upplevde att de fick ett högre pris för kaffet än innan de blev certifierade. De certifi-erade odlarna upplevde även att de fick odlingsråd och hjälp från Fairtrade-kooperativet, vil-ken hjälpte dem att öka deras skörd. Resultatet visade även att skörden hos de certifierade odlarna var betydligt större, både beräknat per träd och per hektar, än hos de odlare som sak-nade certifiering.
6
Table of Contents
1. Introduction
... 71.1 Background ... 7
1.2 Aim and Structure of the Thesis ... 7
1.3 Questions ... 8
2. Main Part
... 9 2.1 Theoretical Background ... 9 2.1.1 Coffee ... 9 2.1.2 Certification ... 15 2.2 Methods ... 202.2.1 Limitations of the Study ... 22
2.3 Results ... 22
2.3.1 The Farmers ... 22
2.3.2 The Farms ... 23
2.3.3 The Production ... 24
2.3.4 The Economy ... 28
2.3.5 The Certified Farmers ... 29
3. Discussion
... 33 3.1 Discussion ... 33 3.1.1 The Investigation ... 33 3.1.2 Fairtrade in General ... 36 3.2 Conclusions ... 384. References
... 395. Appendix 1:
Questionnaire Certified Farmers ... 427
1. Introduction
1.1 Background
Coffee is one of the most important Third World export commodities and 70% of the produc-ers are small scale farmproduc-ers (Milford, 2004). Fairtrade products represent only a small part of the world market (Raynolds et al., 2004). In Indonesia coffee is produced by small scale farmers, often organized in cooperatives (FLANZ, 2010).
By buying Fairtrade products the consumer is supposed to be able to both satisfy his or her demand and at the same time improve the well-being of poor producers elsewhere in the world (Arnould et al., 2009). According to the Fairtrade organization, Fairtrade offers stable prizes, premiums, partnership and empowerment for the farmers (FLO, 2009a).
There are different opinions about if Fairtrade is fair or not, and if the producers will get what they are promised according to the standards of Fairtrade. Some means that the producers do not get paid enough for their coffee and has to sell the coffee for a lower price than the pro-duction costs (Malmqvist and Wåhlsten, 2007). Other means that Fairtrade has become a successful dimension in different levels in coffee production (Murray et al., 2006).
1.2 Aim and Structure of the Thesis
The thesis consists of a literature study and a field study. The aim with the literature study was to collect and compile research information about coffee and certifications. The focus of the literature study was on Fairtrade, coffee and coffee production in the research area. In the literature part there will first be a description of coffee and its history, botany, ecology and production and on coffee in Indonesia, which is the country of the research. Secondly there will be a description of certifications, especially Fairtrade, and its certification process and promised benefits. There will also be a description of Fairtrade in Indonesia.
The literature study is presented as a background for the field study in central Aceh, Indone-sia. The field study consisted of interviews, by questionnaire, of Fairtrade certified and uncer-tified coffee farmers. There were also interviews with coffee collectors and coffee exporters both with, and without Fairtrade certification.
The aim of the study was to compare Fairtrade certified coffee farmers with uncertified coffee farmers to see if there are any benefits to be a certified farmer. The aim was also to see what the farming situation of producing coffee looked like in this geographic area.
8
1.3 Questions
What does the farming situation of Fairtrade certified and uncertified coffee farmers, in Aceh, Indonesia, look like?
Are there any benefits of being a Fairtrade certified coffee farmer in Aceh, Indonesia? What are the experiences of being a Fairtrade certified coffee farmer in Aceh, Indone-sia?
9
2. Main Part
2.1 Theoretical Background
2.1.1 Coffee
2.1.1.1 History
Coffee was first exploited in the forests of Ethiopia in the province Kaffa (ICO, n.d. a). The coffee was spread to Arabia by the slaves, who ate the coffee cherries, and it was spread, from formerly Sudan to Yemen and Arabia by the great port in Mocha. The coffee cultivation started in Yemen during the 15th century.
In the beginning coffee was a rare commodity considered as a religious beverage and it was also used for its medical qualities (NE, 2011; Svensk Kaffeinformation, 2006). It was first in the beginning of the 13th century the coffee bean was roasted before drinking. The Arabs spread the drinking of coffee to the Turks and from the Turks the Europeans succeeded the drinking of coffee, first by the trade routes to Venice, and during the middle of 17th century the coffee attained France and England (NE, 2011).
There was an attempt to prevent the cultivation of coffee at other places, and the Arabs tried to prohibit export of viable coffee beans (ICO, n.d. a). During this time viable beans and plants may have been smuggled from Arabia and has since then been planted throughout the world (Willson, 1999). In the beginning of the 17th century the Dutch brought vital coffee plants back to the Netherlands to grow them in greenhouses (ICO, n.d. a).
In the end of the 17th century the Dutch cultivated coffee in Malabar in India and in the very late end of this century coffee was brought to Batavia (current Jakarta) in Java, Indonesia, which was a Dutch colony (ICO, n.d. a). During a couple of years the Dutch colonies was the greatest coffee exporters to Europe. In the beginning coffee was sold only in small amounts and as pharmaceutical preparations (NE, 2011).
During the early 18th century the Dutch spread the coffee to Central and South America (ICO, n.d. a). The big expansion of the production in Java and Brazil caused a major fall of the world market price.
Today coffee is one of the most important primary products at the world market and the im-portance of coffee cannot be overestimated (ICO, n.d. a). Cultivation, processing, trade and marketing can employ millions of people over the world. In many developing countries coffee
10 is vital for economy and politics and the export of coffee can be equal to 50% of the incomes of the country.
2.1.1.2 Botany and Ecology
The genus Coffea belongs to the family Rubiaceae (Bigger et al., 2007). It is a large family with 550 genera and 9 000 species (Judd et al., 2008). The family is cosmopolitan, but most diverse in tropical and subtropical regions, and includes trees, shrubs, lians and herbs.
Only three species of Coffea are economically important (Bigger et al., 2007). These three species are C. arabica L. (arabica coffee) (Picture 1), C. canephora Pierre ex A. Froehner (robusta coffee) and C. liberica Bull ex Hiern (liberica coffee). Arabica coffee presently ac-counts for about 60% of the world trade and robusta coffee acac-counts for most of the rest of the trade. Liberica coffee contributes with less than 1% of the world trade.
Picture 1. Coffea Arabica with unripe cherries. Photo: Anna-Carin Almqvist
All species of Coffea are lignified and they are represented in diverse forms; from small shrubs to large trees over 10 meters high (ICO, n.d. b). Most species are adapted to forest habitat. The genera of Coffea are evergreen with leathery, glabrous and glossy leaves. The leaves are paired and elliptical with pointed tips. The colour varies in yellowish, dark green, bronze or shifting in lilac.
Flowers are small and white produced in clusters in leaf axils (Bigger et al., 2007). Flowering is mostly occurring throughout the year. The fruit is a red drupe, cherry, with a fleshy epicarp embaying two seeds, the coffee beans (NE, 2011). A coffee tree flowers first after about three years of growing (Svensk Kaffeinformation, 2006). Depending on the climate a coffee tree
11 can flower several times during a year. From flower to ripe cherry it takes 9-11 months, de-pending on species and climate factors (ICO, n.d. c). The optimal yield of a tree is reached when it is five to six years old (Milford, 2004). The production of quality beans can continue for 20 years and then followed by another 20 years with declining production.
The root systems differ somewhat between arabica and robusta. Arabica has a short tap root with 2-3 m extensive lateral roots and 1-2 m extensive horizontally roots (Bigger et al., 2007). Robusta has a shorter tap root and is more shallow-rooted. Leaves from robusta are usually larger than leaves from arabica and has also a more corrugated lamina. The leaves of liberica are much larger and with a leathery texture. Typical for arabica is seasonal flushes of flower-ing whereas flowerflower-ing of robusta tends to be less restricted by the season. Liberica flowers at irregular intervals.
Coffee is not a robust tree and requires very specific environmental conditions for commercial cultivation (Svensk Kaffeinformation, 2006). According to the varieties grown, the require-ments of temperature, rain, sunlight, soils and wind vary (ICO, n.d. d). Coffee is very sensi-tive for frost, which is a danger at higher altitudes. Ideal temperature for coffee averages be-tween 15 to 24ºC for arabica and 24 to 30ºC for robusta. Arabica is best grown in hilly areas at higher altitudes and robusta can be grown between sea-level and about 800 meters. Al-though limited by the demand of frost-free climate arabica can be grown at lower levels fur-ther from the equator. Arabica is more tolerant for lower temperatures and robusta for higher temperatures. Arabica needs lesser rainfall than other species, but in general coffee needs rainfall of 1 500 to 3 000 mm per year. Of importance for growth, budding and flowering is the pattern of rainy and dry periods. Good drainage is needed, but coffee can be grown on soils with different pH, mineral content and depths by suitable applications of fertilizer.
2.1.1.3 Production
How coffee is cultivated differs between different countries (Svensk Kaffeinformation, 2006). The differences depend on different factors such as climate, economy and supply of labour. Today different machinery can be used, but the major part of the work is made by hand. The majority of the coffee producers of the world are small scale farmers but there are also big plantations which enable use of machinery. Because coffee is sensitive for cold it is best cul-tivated in a warmer climate (Willson, 1999). The soil should be rich of clay and moisture; it also needs to be well drained to prevent the roots to rotten. As soil improvement peel and pulp from processed cherries can be used. The soil needs to be neutral to acid (Bigger et al., 2007).
12 If the pH is lower than 5.0 lime can be used to increase the pH. If the pH is higher than 7.0 the availability of growing may be impaired.
A coffee plant comes usually from plant nurseries before they are planted in the field (Will-son, 1999). Intercropping together with other agricultural crops is common. Because of coffee trees can grow up to several meters, they are pruned to be easy to handle and harvest (Bigger et al., 2007). Pruning is made by hand. To its purpose it is adapted to grow approximately 1200 coffee trees per hectare in a shaded plantation.
Unripe, ripe and overripe cherries grow close together in clusters at the branches during the same time as the tree flower (Svensk Kaffeinformation, 2006). Today there is machinery for harvesting, but most common is harvesting by hand (Picture 2) (Willson, 1999). This makes a more equable quality and ripeness of the harvested cherries. The coffee cherries are peeled by manually run machines to lay bare the beans. After harvest there are two methods for process-ing to get the beans: dry method and wet method.
Picture 2. Women harvesting coffee by hand in the field. Photo: Anna-Carin Almqvist
The dry method is the primary method mostly used in dry areas with shortage of water (Svensk Kaffeinformation, 2006). The process starts with clearing and cleaning of the peeled coffee beans in pouring water. Leaves, branches, soil and pebbles are taken away. The coffee beans are collected and are dried in the sun (Willson, 1999). To be sure the beans will dry properly they are turned several times during the day (Picture 3). After approximately three weeks the beans are dry and can be threshed to separate the pulp and skin from the beans be-fore the beans are sorted (Svensk Kaffeinformation, 2006).
13
Picture 3. Sun drying and turning of coffee beans. Photo: Anna-Carin Almqvist
The wet method is more difficult and expensive than the dry method (Svensk Kaffeinforma-tion, 2010). The coffee cherries are brought through channels, settling basins and collecting basins to a machine removing the pulp (Willson, 1999). In washing channels damaged beans are separated from good beans, which are passed to a fermentation basin. During the fermen-tation the beans will get through a chemical process giving the beans acidity. It is important to break the fermentation process at the right time to make the taste and quality as good as pos-sible. Before the coffee can be retailed it must be sorted. After procession and sorting, the beans are packed in bags before distribution.
2.1.1.4 Coffee in Indonesia
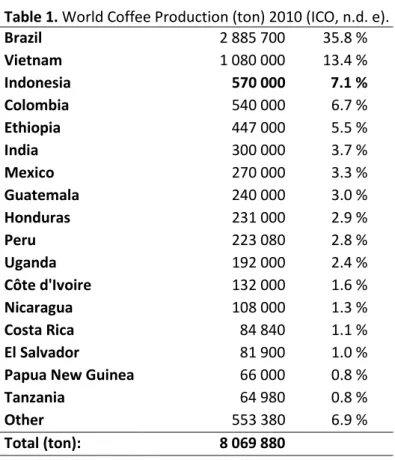
Indonesia is one of the oldest coffee growing countries (Bigger et al., 2007). The main areas of production are Sumatra, Java and Sulawesi which differ in procession methods and produc-tion of different varieties. The total producproduc-tion during a year is in average 11 400 000 bags (ICO, 2009). Every bag is 60 kg. Around 5% of the produced crop is arabica, but most of the exported crop is robusta. In average an Indonesian coffee farm is 1.4 hectares. Many farmers mix the coffee production in intercropping along with other perennial crops.
In 2010 Indonesia produced in average 570 000 ton of coffee (Table 1) (ICO, n.d. e). This will make Indonesia to the third biggest producer of coffee. The total planted area for coffee in
14 production was during 2009, 1 340 000 ha (ICO, 2009). Only Brazil and Vietnam are bigger producers of coffee.
Table 1. World Coffee Production (ton) 2010 (ICO, n.d. e).
Brazil 2 885 700 35.8 % Vietnam 1 080 000 13.4 % Indonesia 570 000 7.1 % Colombia 540 000 6.7 % Ethiopia 447 000 5.5 % India 300 000 3.7 % Mexico 270 000 3.3 % Guatemala 240 000 3.0 % Honduras 231 000 2.9 % Peru 223 080 2.8 % Uganda 192 000 2.4 % Côte d'Ivoire 132 000 1.6 % Nicaragua 108 000 1.3 % Costa Rica 84 840 1.1 % El Salvador 81 900 1.0 %
Papua New Guinea 66 000 0.8 %
Tanzania 64 980 0.8 %
Other 553 380 6.9 %
Total (ton): 8 069 880
Specialty coffee is coffee cultivated and harvested during ideal conditions to develop unique characteristics (SCAE Sweden, 2011). The number of quality beans for specialty coffee pro-duction is limited (Coffee Universe, 2011). A small part of the coffee considered best in the world comes from Indonesia. It is priced for their richness, full body, long finish, earthiness and gentle acidity.
One of all the specialty produced Indonesian coffees is the Gayo Mountain Coffee and is grown on the hillsides surrounding Lake Laut Tawar and the town Takengon (SCA, 2011.). The altitude in the production area averages between 1110 and 1300 meters. In this region almost all coffee is grown by smallholders under shade trees. The Gayo coffee uses the spe-cial semi-dry method (FLANZ, 2010). The wet parchment is spread out on tarpaulins to dry under the sun until it reaches a moisture content of about 22%. After hulling the coffee is fur-ther dried under the sun for a couple of days, to a moisture content of about 15%, before it is taken to the factory building, where it undergoes both mechanical and hand sorting proce-dures (Picture 4).
15
Picture 4. Hand sorting of dry coffee beans at coffee factory in Takengon. Photo: Anna-Carin Almqvist
2.1.2 Certification
In the global food market certification labels have been an important way of educating con-sumers (Gliessman, 2007). Certification means that a product will be valued from a special pre-determined standard (Andersson & Gullstrand, 2009). Certification of food is a growing phenomenon that has been coming as an answer to consumers’ demands of increased product information. Certification is mainly used to signalize that a product contains specially quali-ties that normally is difficult to find, for example social responsibility (environment-friendly, social development and health) or a special geographical ancestry. The simple existence of certification labels raises consciousness of the fact that consumers’ choices matter (Gliess-man, 2007). To make the certification more trustworthy the certification process is made from a third part who’s not having direct connections to the seller or the buyer of the product (Andersson & Gullstrand, 2009).
Certification to consumers is called free marking (Andersson & Gullstrand, 2009). Free mark-ing is used to make niche markets that work parallel to the conventional market. Examples are Marine Stewardship Council, Rainforest Alliance and Fairtrade. Fairtrade is the most common marking in the world (Johansson, 2009).
2.1.2.1 About Fairtrade
Fairtrade is a non-profit, multi-stakeholder organization with 24 member organizations worldwide (FLO, 2009a). In 58 producing countries there are 746 Fairtrade certified producer organizations representing over one million farmers and workers in Latin America, Africa and Asia (FLO, 2009b; Fairtrade Sverige, 2010a).
The umbrella organization that manages the Fairtrade system is Fairtrade Labelling Organiza-tions International (FLO) (FLO, 2009a). The system consists of key members and
stake-16 holders. FLO was founded in 1997 and connects marking initiative in 23 countries (Fairtrade Sverige 2010a). The main office is based in Bonn, Germany and has offices working in 42 countries, helping producers to gain the Fairtrade certification and develop market opportuni-ties (FLO, 2009a).
The vision of Fairtrade is a world in which all producers can enjoy sustainable livelihoods, secure, fulfil their potential and decide on their future (FLO, 2009a). Fairtrade’s mission is to connect disadvantaged producers and consumers, strengthen their position, promote fairer trading conditions and empower producers to combat poverty and take more control over their lives.
The standards for Fairtrade are established by the FLO (Fairtrade Sverige, 2010a). FLO is also working as reliance for farmers and workers through regional representatives around the world. In 2009 there were 35 representatives in 50 countries. The representatives have a close contact to producing organizations in a special region. They will offer information, advice and education and also help the farmers reach the international standards for Fairtrade and find new markets for their products.
2.1.2.2 Benefits
According to the Fairtrade organization, Fairtrade is unique in offering four important benefits for producers: stable prices, a Fairtrade premium, partnership and empowerment (FLO, 2009a). Fairtrade standard for coffee acts as a safety net against the unpredictable market (FLO, 2009c). Even when the world market prices fall the stable prices provide security to coffee producers to ensure that they will always get a price that covers their costs of sustain-able production (FLO, 2009d).
The Fairtrade premium will help producers to improve the quality of their lives (FLO, 2009d). It´s paid on top of the agreed Fairtrade price and the producers decide democratically how to invest it for community and business development projects (FLO, 2009a).
Through the partnership the producers are involved in decisions that affect their future (FLO, 2009a). Fairtrade certified producers jointly own and manage the FLO (FLO, 2009d). Produc-ers can influence prices, premiums, standards and overall strategy through their committees and consultation through the FLO’s board.
Empowerment of farmers and workers is a key goal of Fairtrade (FLO, 2009a). To be certified small groups must have a democratic structure and transparent administration in order (FLO,
17 2009d). The use of the Fairtrade premium is decided by a committee in which the workers are allowed to have representatives. Both groups are supported by FLO to develop their capacity in this area.
Fairtrade standards for coffee production ensure that the producer organizations are guaran-teed a floor price (Fairtrade Minimum Price) (FLO, 2009c). For Fairtrade certified organic coffee an extra minimum differential is being applied. A Fairtrade Premium is added to pur-chase price and is used by producer organizations for social and economic investments at the community and organizational level. The Fairtrade certification for coffee is currently open to small farmer organizations which they own and govern. Every member of a Fairtrade pro-ducer organization has equal right to vote. Democratic decision making is required. There are environmental standards restricting the use of agrochemicals and encourage sustainability. There are pre-export lines of credit given to the producer organizations.
2.1.2.3 The Fairtrade certification process
Fairtrade is an independent mark of products and a guarantee that the product will satisfy the international Fairtrade standard (Fairtrade Sverige, 2010b). FLO generates standard and ad-vice and will support farmers and workers in developing countries. The controls are made by the independent international certification organ FLO-Cert. The international Fairtrade stan-dard is based by conventions for human rights by the International Labour Organization (ILO) and aims to economical development and increased environmental consideration (Fairtrade Sverige, 2009). If the organization has a substantially part of regular or temporary employees there are also standards for condition of employment, organization rights, non discrimination, health and security.
There are two main types of control. The first is control of documentation for all actors, such as producer organizations, exporters, importers and licentiates (Fairtrade Sverige, 2010b). This control is made quarterly. The second is control of the fields which include visit by the producer and records of the activity. This control is made once a year.
FLO-Cert is responsible for the control and certification of producer organizations, importers and exporters (Fairtrade Sverige, 2010b). FLO owns FLO-Cert but it works as an independent international certification organ. The certification process will start with an application from the producer organization to FLO-Cert. For the application to be accepted, an inspector from Cert will make an inspection at place. After the inspection a report will be send to FLO-Cert for assessment and a decision will be taken if the organization will be certified or not.
18 To be certified as a producer organization the minimum standard has to be reached (Fairtrade Sverige, 2010b). When FLO-Cert will make the inspections they are starting from a model for group certifications. The central parts of the organization and randomized members will be inspected. The amount of members that will be inspected depends on the size of the producer organization. If the organization has 2 000 members or more a maximum of 100 members will be inspected.
When the organization has passed the certification process, there will be yearly inspections of the standards and demands on gradually improvement of the standards (Fairtrade Sverige, 2010b). The plan of improvements is made from the gain of the Fairtrade sale. The time for an inspection depends on the size of the organization (Fairtrade Sverige, 2010b). An inspection will take from four days up till seven weeks.
The Fairtrade standards are developed together by FLO and the producer networks that repre-sent the Fairtrade farmers (Fairtrade Sverige, 2010b). If a Fairtrade certified producer organi-zation gets an remark because of not implemented standards it will get a claim on correction during a special amount of time (Fairtrade Sverige, 2010b). If failure will be repeated the pro-ducer organization will lose their certification.
2.1.2.4 Fairtrade in Indonesia
According to the charity organisation Oxfam, in New Zealand, the majority of Indonesians live in poverty because of an inequitable economy system (Oxfam New Zealand, 2011a). Cur-rently more than half the Indonesian population lives in poverty (Oxfam New Zealand, 2011b). For most of these people agriculture is the main source of income. People living in poverty are always hardest hit by conflicts and disasters. In the Indonesian society Fairtrade is still an unfamiliar concept. Forum Fair Trade Indonesia (FFTI) is an umbrella organization for Fairtrade organizations in Indonesia and aims to promote movement to local consumers and the government (FFTI, 2008; Oxfam New Zealand, 2011a). The vision of FFTI is to develop the Fairtrade system to give more opportunities to producers in order to improve quality of live and welfare enhancement (FFTI, 2008).
FFTI has the authority to run the Fairtrade process in Indonesia (Oxfam New Zealand, 2011a). It is also a possibility for establishment of links between the rest of Asia and the global Fairtrade organization. To promote Fairtrade principles and benefits FFTI aims to de-velop educational materials in both English and Bahasa Indonesian.
19 The purpose of FFTI is not only to be an umbrella organization, it is also to coordinate and monitor activities in order to introduce, enhance and improve Fairtrade in regional, national and international levels (FFTI, 2008). There is also purpose to open market access to products and open connection and relationships with government, other organizations and relevant per-sons. This aims to enlarge and empower Fairtrade.
2.1.2.5 Koperasi Baitul Qiradh Baburrayyan (KBQB), Takengon, Indonesia
Koperasi Baitul Qiradh Baburrayyan was originally founded in 1995 with 4 or 5 members as an independent voluntary group providing loans for small-scale traders (FLANZ, 2010). The cooperative was set up to develop an effective central coffee production facility to improve wellbeing of small-scale farmers and to encourage environmentally sustainable techniques. As a coffee cooperative the cooperative was founded in 2004 (Husin, 2010). In 2006 the KBQB applied for Fairtrade certification and became members in December 2007. The KBQB started with 650 coffee farmers in 2004, divided in 17 villages. In March 2010 there were approximately 5 900 farmers in 117 villages. The farmers are organized in districts and sub districts. The average size of a farm in the cooperative is 1 hectare, with an average produc-tion of 650 kg green beans per hectare (Husin, 2010).
The cooperative is also certified for organic production. The costs for the certifications for the cooperative is 5 000 USD/year for the Fairtrade certification and 230 000 000 Rupiah per year for the organic certification (Husin, 2010). The cooperative employs approximately 250 peo-ple working administrative with the cooperative (Husin, 2010). Of these, 27 are full time workers, 30 temporary workers and the rest are seasonal workers (FLANZ, 2010). Almost half of the seasonal workers are women.
To be a member in the KBQB the cooperative will come to the farmers’ village with informa-tion (Husin, 2010). There has to be at least 20 farmers in the village who wants to join the cooperative. This is to use the time for the cooperative efficient. For the farmers there is a fee to entry the cooperative of 25 000 Rupiah and there is also a monthly fee of 10 000 Rupiah.
The cooperative provides the members with help such as information about cultivation and processing techniques, pest and weed management (Husin, 2010). The members are provided to participate in different workshops to get more information about the regulations from the cooperative and to improve their farming techniques. There is also a possibility for micro loans from the cooperative for the farmers. The maximum loan is three times as much as the
20 entrance fee per year. The amount of money is the same for all farmers independent of the size of the farm.
All members sign a contract about rules and regulations for the cooperative (Husin, 2010). If mismanagement of the signed contracts occurs, the farmers can still be members of the coop-erative and use the micro loan, but they are not allowed to sell the coffee beans through the cooperative. Since 2004, 1 600 members have been excluded.
Because the cooperative is a member of Fairtrade, they can take part of their premium system (Husin, 2010). Once a year the cooperative decide how to use the premium money. Examples of how the premium is used is to improve the infra structure, buy technical facilities for farm-ing and to restore the Mosque. The rest of the money is used to stabilize the coffee prize for the members.
2.2 Methods
This thesis is a product of an exchange programme through the DOCUMAP (Development of a Curriculum – Supply Chain Management and Post-Harvest Technology for Vegetables and Fruit) project in the Asia-Link programme. The project promotes higher education networking between Europe and Asia. Participators are eight universities in China, Vietnam, Indonesia, Germany, Denmark, Belgium, France and Sweden.
To find out the answer if there is a benefit to be a Fairtrade certified coffee farmer, interviews with different coffee farmers were made during a field study in April 2010, the Aceh Tengah district, near the town Takengon, in the northern tip of Sumatra, in the region of Aceh, Indo-nesia.
The initial plan was to collect data from 20 Fairtrade certified coffee farmers, 20 non-Fairtrade certified farmers, 2 certified village collectors, 2 non-certified village collectors, 1 certified exporter and 1 non-certified exporter, by a questionnaire.
To collect data from the interviewees a questionnaire was made and translated from English into Bahasa Indonesian (Picture 5). The questionnaires were made with help from supervisors at the Syiah Kuala University (UNSYIAH), who had knowledge about the research area and its production.
21
Picture 5. Interviews with translator and questionnaires. Left: Interview with farmer in the field. Right: Interview at a workshop for certified coffee farmers. Photo: Anna-Carin Almqvist
Because of language difficulties and differences in culture there were finally 15 answered questionnaires from certified farmers and 18 answered questionnaires from non-certified farmers in which the data could be used and analyzed. All questions were not answered by all the interviewees and a selection of the answered questions is therefore made.
In the field there was help from the Koperasi Baitul Qiradh Baburrayyan (KBQB), which is a Fairtrade certified coffee cooperative in Takengon, to visit certified farmers and non-certified farmers, collectors and exporters. The certified farms were connected to the KBQB and se-lected from four different sub-districts of Aceh Tengah. The non-certified farmers were not connected to either the KBQB or Fairtrade. During the visit a student from the UNSYIAH introduced and explained the purpose of the questionnaires and also worked as translator. The different coffee farmers were visited when working in their fields or in other coffee farmers’ fields.
To find out if there is a difference between uncertified and certified farmers, a comparison of different factors is made. First there is a general comparison with background about the farm-ers and their farms containing age of farmfarm-ers and number of family membfarm-ers. Second there is a comparison of the status of the farms between the uncertified farmers and certified farmers containing size of the farm, number of coffee trees per hectare and age of trees. Third there is a comparison of the production between the uncertified farmers and the certified farmers con-taining number of workers at the farms, working intensity with trees per worker, yearly vest per hectare, yearly harvest per tree, working days per hectare during harvest and har-vested trees per working day. The economy is compared by income per produced green beans of coffee and also a comparison of sampled data, without outlier data, of the income is made.
22 Finally there is a comparison between the certified farmers about years of connection to the cooperative, reasons for joining the cooperative, what benefits they feel as certified farmers and what factors helped them increase their yield.
2.2.1 Limitations of the Study
The investigation is focused on the situation of the coffee farmers in a specific geographic area.
In this investigation the certified coffee farmers are all members of the same coffee coopera-tive and the uncertified coffee farmers are only chosen from the same geographic area as the cooperative. Only a small number of farmers have been interviewed.
Due to the fact that no or mostly of the interviewees did not speak English, employees from UNSYIAH and KBQB translated the answers from Bahasa Indonesian into English. There is always a risk that there will be a lack of information by using nonprofessional as translators. This is the reason why all questions in the interviews will not be used in the result, since some of the answers given were not complete to use in the investigation.
2.3 Results
2.3.1 The Farmers
There was only a small difference in the mean age between certified and uncertified farmers (Figure 1). The mean age, based on 17 uncertified farmers and 13 certified farmers, is 43 years for uncertified farmers and 47 years for certified farmers. The age of the certified farm-ers were spread over a wider interval than the certified farmfarm-ers. The certified farmfarm-ers were between 30 and 80 years old and the uncertified farmers were between 29 and 60 years old.
80 75 70 65 60 55 50 45 40 35 30 25 20 15 10 5 0 Age % o f fa rm e rs
Age of Uncertified Farmers
80 75 70 65 60 55 50 45 40 35 30 25 20 15 10 5 0 Age % o f fa rm e rs
Age of Certified Farmers
Figure 1. Comparison of age (years) of farmers between uncertified farmers and certified farmers.
Left: Uncertified farmers. Right: Certified farmers.
23 When comparing numbers of family members between the uncertified and certified farmers there was only a small difference by about 0.5 persons per family (Table 2). In this investiga-tion in general uncertified farmers families tended to be a little larger than certified farmers families.
Table 2. Comparison of number of family members between uncertified farmers and certified
farm-ers.
Variable N Mean Standard Deviation
Uncertified Farmers 17 5.53 2.24
Certified Farmers 13 5.08 2.18
2.3.2 The Farms
The most common size for a coffee farm in this area has been found to be 1 hectare (Husin, 2010). The result in this investigation showed that the most common size for a farm, based on 17 uncertified farmers and 13 certified farmers, showed that the mean size for a certified farm was 1.5 hectares and an uncertified farm was 1.3 hectares (Figure 2). This is comparable with the average size for a coffee farm in Indonesia, which is 1.4 hectares (ICO, 2009). By com-paring the size of the farms between the certified and uncertified farmers it could be seen that the difference in mean size was very small.
4,0 3,5 3,0 2,5 2,0 1,5 1,0 0,5 60 50 40 30 20 10 0
Size of Farm (ha)
% o f Fa rm e rs
Size of Farm for Uncertified Farmers
4,0 3,5 3,0 2,5 2,0 1,5 1,0 0,5 60 50 40 30 20 10 0
Size of Farm (ha)
% o f Fa rm e rs
Size of Farm for Certified Farmers
Figure 2. Comparison of size (hectares) of farm between uncertified farmers and certified farmers.
Left: Uncertified farmers. Right: Certified farmers.
As mentioned before, it is suitably to grow approximately 1 200 coffee trees per hectare in a shaded plantation (Bigger et al., 2007). In this investigation different farmers had different amount of coffee trees per hectare. This result, based on 17 uncertified farmers and 12 certi-fied farmers, showed that the mean number of coffee trees per hectare for uncerticerti-fied farmers was 1670 trees and for certified farmers 1330 trees (Figure 3).
24 Certified Farmers Uncertified Farmers 3500 3000 2500 2000 1500 1000 500 0 Tr e e s
Coffee Trees per Hectare
Figure 3. Comparison of number of coffee trees per hectare between uncertified farmers and
certi-fied farmers. = mean
Coffee trees belonging to certified farmers in average tended to be in little older than coffee trees belonging to the uncertified farmers (Table 3). The result, based on 17 uncertified farm-ers and 13 certified farmfarm-ers, showed that the age of certified farmfarm-ers’ trees was higher than the uncertified farmers’ trees.
Table 3. Comparison of age (years) of coffee trees between uncertified farmers and certified farmers.
Variable N Mean Standard Deviation
Uncertified Farmers 17 10.1 6.1
Certified Farmers 13 11.7 4.5
2.3.3 The Production
Both uncertified and certified farmers had in average 3-4 workers at their farms (Table 4). This result, based on 15 uncertified farmers and 13 certified farmers, also showed that the difference between the numbers of workers between the uncertified farms and the certified farms was small.
Table 4. Comparison of numbers of workers at the farms between uncertified farmers and certified
farmers.
Variable N Mean Standard Deviation
Uncertified Farmers 15 3.4 3.4
25 The result, based on 15 uncertified farmers and 13 certified farmers, showed that workers on uncertified farms in average worked with a larger amount of trees than workers on certified farms (Table 5), though the range of number of trees were in each case large.
Table 5. Comparison of coffee trees per worker at the farm between uncertified farmers and
certi-fied farmers.
Variable N Mean Standard Deviation
Uncertified Farmers 15 0.7 *103 0.6*103
Certified Farmers 13 0.4*103 0.4*103
The yearly harvest per hectare, based on 10 uncertified farmers and 9 certified farmers, showed that the yearly harvest from the certified farms in average were almost the double to the yearly harvest from the uncertified farms (Figure 4). The mean harvest per hectare for uncertified farmers was 3.6*103 kg and 8.8*103 kg for certified farmers. This number was more than ten times bigger as compared to the information about the number for the produc-tion, in the KBQB, of green beans per hectare, which was 650 kg green beans per hectare (Husin, 2010). Certified Farmers Uncertified Farmers 20000 15000 10000 5000 0 K g
Yearly Harvest per Hectare (Kg)
Figure 4. Comparison of yearly harvest per hectare (kg) between uncertified farmers and certified farmers. = mean *= outlier data
The comparison of harvest per tree showed, in this investigation, the yearly harvest from the certified coffee farmers trees in average were more than four times larger than the yearly har-vest from uncertified farmers’ coffee trees (Figure 5). The mean for yearly harhar-vest was 2.1 kg
26 per tree for uncertified farmers and 8.7 kg for certified farmers. The result was based on 9 uncertified farmers and 9 certified farmers.
Certified Farmers Uncertified Farmers 18 16 14 12 10 8 6 4 2 0 K g
Yearly Harvest per Coffee Tree (Kg)
Figure 5. Comparison of yearly harvest per coffee tree (kg) between uncertified farmers and certified
farmers. = mean
Both uncertified and certified farmers employed people during harvest. It was more common that certified farmers employed people during harvest than uncertified farmers. In this investi-gation in average 88 % of the uncertified farmers and 80 % of the certified farmers employed people during harvest. The rest of the farmers harvested their coffee by themselves.
In average there was almost the double number of working days for uncertified farmers per hectare than for certified farmers during harvest (Figure 6). For uncertified farmers the mean number of working days per hectare was 26.5 and for certified farmers 13.4 during harvest. The comparison is based on 11 uncertified farmers and 9 certified farmers.
27 Certified Farmers Uncertified Farmers 70 60 50 40 30 20 10 0 W o rk in g D ay s p e r H e ct ar e
Working Days per Hectare during Harvest
Figure 6. Comparison of number of working days per hectare between uncertified farmers and
certi-fied farmers. = mean *= outlier data
To see how intense the harvest was for the workers a comparison of harvested trees per work-ing day was made (Figure 7). The mean of harvested trees per working day were in average almost the double for certified farmers, as compared to uncertified farmers. The mean number of harvested trees per working day was 62.0 trees for uncertified farms and 115.8 trees for certified farms. Certified Farmers Uncertified Farmers 250 200 150 100 50 0 W o rk in g D ay s
Harvested Trees per Working Day
Figure 7. Comparison of harvested coffee trees per working day between uncertified farmers and certified farmers. = mean
28
2.3.4 The Economy
By making a comparison of yearly income per kilogram harvested coffee between uncertified and certified farmers the mean income for uncertified farmers was 11.4*103 Rupiah and for certified farmers 3.5*103 Rupiah (Figure 8). In this investigation a comparison of all data showed that the yearly income for uncertified farmers was almost triple to the income for cer-tified farmers. The result was based on 9 uncercer-tified farmers and 14 cercer-tified farmers and was calculated on the harvest of green beans.
Certified Farmers Uncertified Farmers 60000 50000 40000 30000 20000 10000 0 R u p ia h
Income per Kilogram Harvested Coffee
Figure 8. Comparison of income (Rupiah) per kilogram harvested coffee between uncertified farmers
and certified farmers. = mean *= outlier data
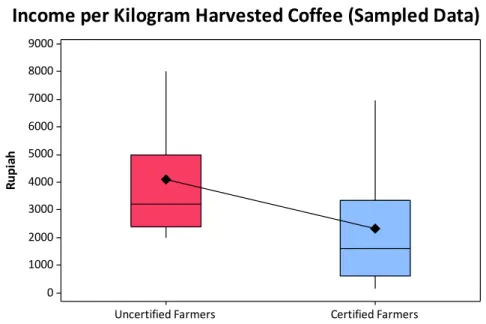
By making a comparison of the yearly income per kilogram harvested coffee without outlier data the comparison between uncertified and certified farmers looked a little bit different (Figure 9). The result was based on 7 uncertified farmers and 13 certified farmers and was calculated on the harvest of green beans. The yearly mean income for uncertified farmers was in this comparison instead 4.1*103 Rupiah per kilogram harvested coffee and for certified farmers 2.3*103 Rupiah per kilogram harvested coffee.
29 Certified Farmers Uncertified Farmers 9000 8000 7000 6000 5000 4000 3000 2000 1000 0 R u p ia h
Income per Kilogram Harvested Coffee (Sampled Data)
Figure 9. Comparison of sampled data of income (Rupiah) per kilogram harvested coffee between uncertified farmers and certified farmers. = mean
Both uncertified and certified farmers produced more crops than coffee to gain the total in-come. The result, based on 17 uncertified farmers and 15 certified farmers, showed that 76.5 % of the uncertified farmers and 66.7 % of the certified farmers produced more crops than coffee. Examples of other crops produced by the farmers are areca nut, avocado, betel nut, chilli, cocoa, durian, guava, nutmeg, orange, pepper, tomato, tree tomato, vanilla and different vegetables.
2.3.5 The Certified Farmers
The time for membership in the KBQB varied between the interviewees, but a major part (28.6%) of the farmers had been connected between 2-3 years (Figure 10). Almost the same amount of interviewees had been members for a shorter time. Few of the interviewed farmers had been connected for more than 5 years.
30
Figure 10. Comparison of certified farmer’s years of connection to the cooperative, KBQB.
The reasons for being a member of the KBQB were mostly to get a higher price for the coffee, which 71.4 % of the farmers answered (Figure 11). The result was based on 21 answers from 14 farmers and there was an opportunity for the farmers to have more than one answer. An-other reason to join the KBQB was to get better technology for growing and harvesting the coffee. Of the certified farmers 14.3 % of them had other reasons to join the cooperative.
Figure 11. Comparison of certified farmer’s reasons for joining the cooperative, KBQB.
14,3% 14,3% 28,6% 14,3% 21,4% 7,1% 0,0% 5,0% 10,0% 15,0% 20,0% 25,0% 30,0% <1 1-2 2-3 3-4 4-5 >5 Years of connection
How long have you been
connected to the cooperative?
71,4% 14,3% 42,9% 0,0% 21,4% 0,0% 10,0% 20,0% 30,0% 40,0% 50,0% 60,0% 70,0% 80,0%
Better price for coffee
Be a part of the community
Better technology Micro loan Other
31 In the question about if the farmers felt like they were having any benefits as Fairtrade certi-fied farmers there were 15 answering farmers and all answered that they felt like they had benefits as certified farmers. It was possible for the farmers to answer more than one option of the question. From 30 answers 86.7 % of the farmers felt they had a better price for the coffee, 46.7 % of the farmers felt they had better agronomy advice and 33.3 % felt the premium sys-tem was a benefit (Figure 12). Other benefits the farmers felt was better techniques for proc-essing and better opportunities to sell the beans.
Figure 12. Comparison of certified farmers benefits the feel as certified farmers.
By all Fairtrade certified interviewees all, except one farmer, answered they were satisfied with the Fairtrade premium system and thought it was a good system that worked democrati-cally. They knew where the decision was taken and felt that they have had the part in the deci-sion.
After joining the cooperative 12 certified farmers answered the question if their yield had in-creased afterwards and they all agreed. In the question about what factors had helped the farmers to increase their yield more than one answer was possible for the farmer. From 12 farmers there were 21 answers which told that 91.7 % of the farmers felt the agronomy advice had helped them, 50.0 % felt better technology and 33.3 % felt the information and work-shops about pest and weed control helped them to increase their yield (Figure 13).
86,7% 20,0% 13,3% 46,7% 33,3% 0,0% 0,0% 10,0% 20,0% 30,0% 40,0% 50,0% 60,0% 70,0% 80,0% 90,0% 100,0%
Better price Better
processing technique Better opportunities to sell the beans Better agronomy advice Premium system Other
32
Figure 13. Comparison of factors helped certified farmers to increase their yield. 50,0% 33,3% 91,7% 0,0% 0,0% 10,0% 20,0% 30,0% 40,0% 50,0% 60,0% 70,0% 80,0% 90,0% 100,0%
Better technology Information/workshop
about pest/weed control
Better agronomy advice Other
33
3. Discussion
3.1 Discussion
3.1.1 The Investigation
There was a small difference between uncertified and certified farmers comparing age of the farmers and the number of their family members. The status of the families seemed to be quiet similar to both uncertified and certified farmers, even if certified farmers in general were little older and had a wider spread over the ages than uncertified farmers. The uncertified farmers also tended to have a little larger family in mean than certified farmers, but the family status seemed to be quiet similar to both. Because all these factors of status and family are quiet similar they can have affected the result of harvest and income minimally.
The comparison of the status of the farms showed that there were no big difference in mean size of the farm between uncertified and certified farmers, but for both was the mean size larger than the mean size for this geographic area. Because both uncertified and certified farms in general have similar mean size, it do not matter in this investigation, that both are larger than the mean size for this geographic area. Even the mean age of the coffee trees did not differ a lot. At this age of the trees, this difference, should not affect factors as yearly harvest and working intensity. It is rather other factors affecting the yield such as soil, nu-trients, water and sun (Willson, 1999).
There were no general differences with either status of farmers or status of farms so with this background information it can be concluded that the major difference in this investigation is if the farmers are certified with Fairtrade or not. The majority of the certified farmers have been connected to the cooperative more than two years and should during this time get an insight in how the cooperative works.
Factors that differ in this investigation, if the farmers are certified or not, are comparisons of harvest, working intensity and income. The majority of the interviewed certified farmers are satisfied with the certification and experiences that the membership in a Fairtrade cooperative has helped them to both increase their income and their harvest. Theoretical this will mean that the farming conditions were better for the certified farmers.
The yearly harvest for certified farmers were in average more than double per hectare and more than four times per tree than for uncertified farmers. A reason for this result could be the agronomy advice the cooperative provides the certified farmers, which also the majority of
34 these felt had helped them increasing their yield. Other reasons are technology the cooperative provides the farmers or information about pests and weeds.
The working intensity is another factor that differs. Both uncertified and certified farmers have 3-4 workers at their farms. By calculating the number of trees per worker it was shown that in average uncertified farmers had more trees per worker than certified farmers. Uncerti-fied farmers also have almost the double number of working days per hectare during harvest than certified farmers, even if the harvest of the certified farmers was more than the double per hectare and four times bigger per tree. Certified farmers and their workers do also harvest the double number of trees per working day. This will mean that uncertified farms are more working intensive than certified farms which can be a result of the agronomy advice and the technology the cooperative provides. It can also be that certified farmers and their workers have learned from experience of other members in the cooperative and know how to work effective. Experience from investigations in Africa is that employees in the field often are so poorly paid that they cannot feed their families (Lindqvist, 2011). This is one reason making them less interested of doing a good job. According to the Fairtrade standards, the salaries will be the same or above the statutory minimum salary for each country or region (Fairtrade Sverige, 2011). The employees will have a salary due to their job.
The majority of the certified farmers have chosen to join the cooperative because they want to get a better price for their coffee. This investigation showed that the uncertified farmer’s in-come from the coffee was at least the double as compared to the certified farmers’. In spite of this, the majority of the certified farmers feel that their income has increased since they joined the cooperative. The certified farmers have also the yearly fees to the cooperative. None of the certified has chosen to join the cooperative because of the microloan, which the cooperative promoted. By being certified the income will be least the minimum price for Fairtrade and this will make a safer income. To supplement the income most of the farmers produced other crops. More uncertified farmers produced more crops than coffee as compared to uncertified farmers.
It may seem surprising that the incomes for the certified farmers are lower even if they have larger harvests. The result of the income is calculated per price per kilogram and it has noth-ing to do with the yield of the harvest. The income depends on who are willnoth-ing to buy the coffee and to which price. It depends on the supply and the demand. If the supply is bigger than the demand the price will be lower to make it easier to be sure to sell all coffee.
35 New questions which can be raised are if the income would have been higher if the certified farmers did not have joined the cooperative or if there are other benefits from the cooperative the certified farmers do not want to be without. It can also be discussed if there is better to have an economical loss and other benefits from the certification and the cooperative, than higher income and no benefits from certifications or cooperatives. One reason that the income for the certified farmers are lower could be that they, after joining of the cooperative, are un-informed about the situation of prices and practices in uncertified farms.
A similar investigation, by Werkander and Wondollek (2009), in the same research area com-paring two different Fairtrade certified cooperatives, showed that there was no significant increase of the income or of social conditions of the farmers. The farmers did not get any in-formation about prices, practices and regulations outside the cooperatives. Similar investiga-tions are also made in Ethiopia and in Mexico and Latin America, which both showed that Fairtrade certification increased the income for the farmers (Bäckman, n.d.; Murray et al, 2006; Raynolds, 2002; Raynolds, 2004). The investigation from Ethiopia also showed that lack of information and education to the farmers prevented the economical development (Bäckman, n.d.). Also here did the farmers not get any information about prices, regulations and practices outside the cooperative. In large cooperatives there was a higher risk for free-riders in participation of activities of the cooperative, which undermines the cooperative. The investigations in Mexico and Latin America showed that the income was higher and more stabile for certified farmers (Murray et al, 2006; Raynolds, 2002; Raynolds, 2004).
Another investigation in Latin America showed that the members derive benefits in terms of standard social indicators (Arnould et al, 2009). The investigation was made in Latin America across randomly sampled populations and showed mixed result.
It can also be discussed if Fairtrade hold their promises in large cooperatives. Because KBQB is a cooperative with over 2 000 members a maximum of 100 farmers will be controlled per year. This will make it easier for members to not fill the standards of the cooperative (Bäckman, n.d.). The risk will be higher to not control all farmers to fill the standard of Fair-trade.
The truth and the trustworthiness of the result, in this kind of investigations, can be discussed. In this investigation the interviews was made by help from staff from a certified coffee coop-erative. There was a risk, that the truth not was answered during the interviews, both from certified and uncertified farmers. The farmers could not directly see where their answers
36 would come up in the end. The certified farmers might not told any bad things about being a member of a certified cooperative in front of staff from the cooperative, where they are mem-bers, and the uncertified farmers might not told correct answers to hide information of their production in front of staff from a certified cooperative.
3.1.2 Fairtrade in General
There are about 880 million poor people on the countryside in the World (Johansson, 2009). Most of these people are directly or indirectly dependent of farming for their livelihood. There are only 1.5 million farmers that are a part of Fairtrade and together with their family mem-bers there will be about 5 million people are a part of Fairtrade. It is not uncommon that the producers need economical help to manage the certification process.
It’s not only poor people taking a part of Fairtrade (Andersson & Gullstrand, 2009). A certifi-cation process is quiet expensive and makes extra costs for the farmer. There are fees to FLO to use the market “Fairtrade” on their products and some costs for adaption to gain the de-mands of production. Only the one who have enough money to join a cooperative or a mem-ber organization can take a part of Fairtrade. There has been some criticism against that the certification of producers can only be done through producer organizations or cooperatives. If a producer not is a member of an organization this farm cannot be certified. The cooperatives or organizations that will be certified tend to be the strongest and most established on the market and not the most marginalized producers. This does not mean that the producers that will be certified are not poor, just that there will always be producers that are even poorer.
Small producers in poor countries will risk getting it more difficult to export their products because certification will increase the given export costs (Andersson & Gullstrand, 2009). Studies have shown that there is a positive effect on the income for certified farmers when the world market price is low as compared with uncertified farmers. When the world market price is the same as or higher than the world market price the difference between certified and un-certified farmers can be expected to be smaller (Johansson, 2009).
Studies have shown that the minimum price from Fairtrade will work as a buffer when the world market prices are low (Johansson, 2009). The reason to the prices had fallen was that the production was too high. If there is a minimum price the decrease in price will be con-fined. If there is a crisis the ones who are covered by the minimum price will not be in trouble as much as others. The effect is smaller than the minimum price will show, because only a
37 small part of the certified production will be sold as Fairtrade. The minimum price will cover the signal to the producers that there is an overbalance of products on the market.
Certification is a risk to make the salesman to price setter, because Fairtrade is a kind of dif-ferentiation (Andersson & Gullstrand, 2009). To use the consumers’ willingness of payment for special product, the salesman may put the prices over the margin costs and will increase their income. It is rather the salesman and not the producers that will gain money from the certified products. This concept gives the intermediaries an opportunity to use the good will-ing by the consumers to gain their own income (Johansson, 2009). If the salesman increases the price only a small amount will reach the producer. This is an ineffective way to transfer money to the producer from the consumer. The money that will reach the producer is not a part of the price in the store or a decided supplement charge that will reach the producers di-rectly. The producers are guaranteed a minimum price from Fairtrade. When the market prices of provisions are growing over the minimum price there will be no price premium for Fair-trade certified products. The economical gain for the certified farmers will be lower. The costs for the certification will still be the same and only a social premium will be given. If people would like to help poor people in the developing countries as Fairtrade claims that they do, perhaps a more efficient way would be that people should pay the extra amount of money that they pay for a Fairtrade product in the supermarket to a help organization. Then the help or-ganization can help the farmers on the field with develop the farming, agriculture advise and so on. In this way more of the money would reach the people in need. The best way to in-crease people’s income is to give them money so directly in their pockets as possible (Johans-son, 2009). It is easy for the money to disappear when they will go through intermediaries.
Fairtrade is a growing organization, but even if the growth in percent still is increasing, Fair-trade is just a small part of the total export volume (Johansson, 2009). In 2006 the amount of Fairtrade certified coffee were only 0.9 percent of the total export of green coffee beans. In Sweden during 2008 only 3.4 percent of the coffee was certified with the criterions from FLO. Even if the Fairtrade market is fast growing market, it is a niche market for a small part of the developing countries.
A common problem is that the demand of Fairtrade produced coffee is smaller than the amount that is produced (Johansson, 2009). It is not often that the cooperatives can sell all their production as Fairtrade. This will make the mean income smaller than what Fairtrade