This is an Accepted Manuscript, which has been through the Royal Society of Chemistry peer review process and has been accepted for publication.
Accepted Manuscripts are published online shortly after
acceptance, before technical editing, formatting and proof reading. Using this free service, authors can make their results available to the community, in citable form, before we publish the edited article. We will replace this Accepted Manuscript with the edited and formatted Advance Article as soon as it is available.
You can find more information about Accepted Manuscripts in the Information for Authors.
Please note that technical editing may introduce minor changes to the text and/or graphics, which may alter content. The journal’s standard Terms & Conditions and the Ethical guidelines still apply. In no event shall the Royal Society of Chemistry be held responsible for any errors or omissions in this Accepted Manuscript
or any consequences arising from the use of any information it contains.
Accepted Manuscript
Dalton
Transactions
1
Influence of lithium concentration on the structure and Li+ transport properties of cubic phase lithium garnets
S. Ramakumar, N. Janani and Ramaswamy Murugan*
Abstract
In order to understand the influence of lithium concentration on structure and Li+ transport properties of cubic lithium garnets systematic AC impedance, Raman and powder X-ray diffraction (PXRD) investigations have been carried out on lithium garnets with nominal compositions LixA3B2O12 (A = Y3+, La3+, Sr2+, Ba2+; B = Te6+, Ta5+, Zr4+ and 3≤ x ≤7.5). The size of the three dimensional A3B2O12 frame is found to be an important factor in determining the capacity of housing and nature of distribution of lithium atomsamong available tetrahedral and octahedral sites in the cubic LixA3B2O12 lithium garnets. The Li+ conduction in a cubic phase lithium garnet is primarily dependent upon the concentration of lithium and nature of distribution of lithium atoms among tetrahedral and octahedral sites. AC impedance analysis of cubic phase LixA3B2O12 revealed an increase in the hopping of Li+ with the increase in Li+ concentration and reaches a maximized value for the nominal composition Li7La3Zr2O12 then decreases with further increase of lithium concentration.
Dalton
Transactions
Accepted
2
1.
IntroductionAmong the various electrochemical energy storage devices, rechargeable Li+ batteries have received top priority in the past decade because of their high energy density and wide range of application in portable electronic devices.1-3 The liquid and organic polymer electrolytes used in rechargeable Li+ batteries have several disadvantages and also lead to severe safety problems. Hence the recent research focuses on solid-state lithium ion conductors (SSLICs) that offer general advantages such as high mechanical performance, safety and low toxicity. Though solid electrolytes offer many advantages they exhibit much less ionic conductivities compared to that of liquid electrolytes. An essential requirement for the successful fabrication of safe, high power and high capacity all-solid-state lithium battery for heavy duty application like electric vehicle (EV) is to identify a solid electrolyte with high Li+ conductivity, low electronic conductivity and excellent chemical stability against potential electrodes. Among the reported inorganic solid Li+ conductive oxides, garnet-like structural compounds reported by Weppner and his group received considerable attention in recent times as prospective electrolyte for the fabrication of all-solid-state lithium battery.4-15
Garnets are orthosilicates with general formula A3B2(SiO4)3 (A = Ca, Mg, Fe; B = Al, Cr, Fe), in which A and B refer to eight- and six-coordinated cation sites, respectively.16 Lithium containing garnets are obtained by replacing silicon with lithium to provide the general composition A3B2(LiO4)3. Neutron diffraction studies on lithium-containing garnets with the conventional garnet stoichiometry Li3Ln3Te2O12 (Ln = Y, Pr, Nd, Sm, Eu, Dy, Er and Tm)17 and Li3Nd3W2O1218, 19 revealed that these compounds crystallizes in cubic phase (Ia3d; No. 230). The Ln3+ and Te6+/W6+ occupies eight-coordinate A sites and six-coordinate B sites of
Dalton
Transactions
Accepted
3 A3B2(LiO4)3, respectively. Neutron diffraction studies on lithium-containing garnets with the conventional garnet stoichiometry also indicated that lithium is exclusively found on the tetrahedrally coordinated position (24d site). Conventional lithium garnet Li3Nd3Te2O12 exhibits poor Li+ conductivity of around 10-5 S cm-1 at 600 °C and large activation energy (1.22 eV) for Li+ conduction.17
Lithium stuffed garnets LixA3B2O12 with x > 3 (in which A and B refer to 8- and 6-coordinated cation sites, respectively) have attracted interest in recent times due to the observation of fast Li+ conduction.4, 7, 8, 20-22 The rigid three-dimensional framework produced by A3B2O12 moiety helps to distribute Li+ across available seventy two tetrahedral and octahedral sites in the conventional unit cell of eight formula units. In order to understand the fast Li+ transport properties in lithium stuffed garnets a knowledge of difference in the distribution of lithium between conventional garnet and that of lithium stuffed garnets is necessary. Owing to the limitations of X-ray diffraction towards lithium there exists an uncertainty in the determination of occupancy of lithium in the available tetrahedral and octahedral sites. Lithium arrangement in lithium stuffed garnets was reliably predicted using neutron diffraction method.17, 18, 20, 23-25
The tetrahedral (24d)site does not allow more than three lithium per formula unit and hence for lithium stuffed garnets (i.e., lithium content greater than three) the extra lithium must contribute to the population of crystallographic octahedral (48g/96h) sites that are empty for the standard garnet structure. Thus the major difference observed between conventional lithium garnet and that of lithium stuffed garnet is that in conventional garnet Li+ occupies exclusively in tetrahedral coordination site whereas in case of lithium stuffed garnet Li+ occupies both tetrahedral and octahedral coordination sites.17, 18, 23
Dalton
Transactions
Accepted
4 The first report of fast Li+ conduction in Li5La3B2O12 (B = Nb, Ta) by Weppner and his co-workers4 stimulated further investigations on synthesis, structure and Li+ conducting properties of several lithium stuffed garnets with nominal composition like Li5La3B2O12 (B = Sb, Bi),4, 10, 12 Li6ALa2B2O12 (A = Ca, Sr, Ba; B = Nb, Ta, Sb)9, 10, 21 and Li7La3B2O12 (B = Zr, Hf, Sn).7, 8, 15, 26 Based on neutron diffraction data Xie et al. forecasted that x = 7.5 is the upper limit of x that can be tolerated in LixA3B2O12 garnet framework.27 Though there were lot of work on structure, microstructure and Li+ conducting properties of various lithium containing garnets a systematic experimental studies to divulge the influence of lithium concentration on modifications in structure, Li+ transport properties and the origin of transition from poor Li+ conduction in conventional garnet (x = 3) to that of fast Li+ conduction in cubic phase lithium stuffed garnet(x > 3) is lacking.
In this work powder X-ray diffraction (PXRD), Raman and AC impedance investigations have been carried out to understand the influence of lithiumconcentration on the structure and Li+ transport properties of cubic lithium garnets with nominal compositions LixA3B2O12 (A = Y3+, La3+, Sr2+, Ba2+; B = Te6+, Ta5+, Zr4+; x = 3, 5, 6, 6.5, 7 and 7.5). Also an attempt has been made to explore the basis for the transition from poor lithium conduction in the conventional garnet to that of fast Li+ conduction in lithium stuffed garnets.
2.
ExperimentalLithium garnets with nominal compositions LixA3B2O12 (A = Y3+, La3+, Sr2+, Ba2+; B = Te6+, Ta5+, Zr4+) with 3≤ x ≤7.5 were prepared by conventional solid state ceramic route. The lithium content in LixA3B2O12 increased systematically (3≤ x ≤7.5) by proper substitution for A and B site as shown in Fig. 1 to derive following lithium garnets with nominal compositions;
Dalton
Transactions
Accepted
5 Li3Y3Te2O12, Li5La3Ta2O12, Li6La2BaTa2O12, Li6.5La1.5Ba1.5Ta2O12, Li7La3Zr2O12 and Li7.5La2.5Sr0.5Zr2O12.
LiNO3 (Sigma–Aldrich, >99%; 10 wt.% excess had been added to compensate the loss of lithium during sintering), Y2O3 (Sigma–Aldrich, 98%), La2O3 (Merck, >99% pre dried at 900 °C for 24 h), TeO2 (Himedia, 97%), Ta2O5 (Alfa Aesar, >99%), Sr(NO3)2 (Lobachemie, 99%), Ba(NO3)2 (Merck, >99%), ZrO2 (Acros, 98%) were used as reactants to prepare the lithium stuffed garnets LixA3B2O12 with 3≤ x ≤7.5 (Li3Y3Te2O12, Li5La3Ta2O12, Li6La2BaTa2O12, Li6.5La1.5Ba1.5Ta2O12, Li7La3Zr2O12 and Li7.5La2.5Sr0.5Zr2O12). Appropriate amount of reactants were mixed initially in a ball mill using zirconia balls in 2-propanol for about 6 h using a Pulverisette 7, Fritsch, Germany. After the evaporation of the solvent at room temperature, the mixtures were heated from room temperature to 700 °C in an open alumina crucible and held at this temperature for 6 h and then cooled down to room temperature. The resultant powders were ground again for 6 h using zirconia balls in 2-propanol. After the evaporation of the solvent the powders were pressed into pellets. The pellets were covered with the similar powder to reduce possible lithium loss and sintered in a closed alumina crucible at various maximum possible temperatures to derive dense and phase pure cubic garnets. The experimental conditions maintained for the preparation of investigated samples are shown in Table 1.
The phase purity and crystal structure of the prepared samples were examined by Powder X-ray diffraction (PXRD) using X’pert PANalytical X-ray diffractometer with Cu-Kα radiation of λ = 1.5418 Å from 2θ = 10° to 70° with a step size of 0.02°.The elemental analysis for the prepared samples were carried out using Energy Dispersive Analysis by X-ray (EDAX) using Hitachi, S-3400N and wavelength Dispersive X-ray fluorescence spectrometer (WD-XRF). Confocal micro-Raman spectra were recorded at room temperature in the range 75-1000 cm−1
Dalton
Transactions
Accepted
6 using a Renishaw in via Reflex spectrometer having a 50 mW internal Ar+ laser source at the excitation wavelength 514 nm. Electrical conductivity measurements of the prepared pellets were performed in the frequency range (20 Hz to 15 MHz) using Li+ blocking Au-electrodes (Au paste cured at 600 °C for 1 h) in the temperature range (room temperature (RT) to 300 °C) using a Precision Impedance analyzer (Wayne kerr 6500B).
3.
Results and discussion 3.1. Structural analysisFig. 2 shows the measured PXRD patterns for the investigated compositions sintered at different elevated temperatures together with the standard pattern of cubic phase Li3Y3Te2O12 (JCPDS-25-1433). The PXRD patterns of Li3Y3Te2O12, Li5La3Ta2O12, Li6La2BaTa2O12, Li6.5La1.5Ba1.5Ta2O12 and Li7La3Zr2O12 sintered at different elevated temperatures as shown in Fig. 2(a)-2(e) could be indexed to a garnet-like structure with cubic phase (space groupIa3d; No. 230). The PXRD pattern of Li7.5La2.5Sr0.5Zr2O12 (Fig. 2 (f)) exhibited slightly broadened diffraction peaks. The PXRD pattern of the investigated compounds LixA3B2O12 with 3≤ x ≤7.5 indicates that the garnet-like structure is quite tolerant to the substitutions of varying metal cations over the investigated compositional range.
The PXRD patterns of compositions LixA3B2O12 with 3< x ≤ 6.5 shown in Fig. 2 indicate shift in peak positions towards the lower diffraction angle compared with that of a standard Li3Y3Te2O12 (JCPDS-25-1433) with the increase of x, suggesting an increase in the lattice parameter. The variation of calculated cubic lattice parameter with x in LixA3B2O12 is shown as Fig. 3. The lattice parameter increase initially and reaches a maximum of 13.0458 Å for the nominal composition Li6.5La1.5Ba1.5Ta2O12 and then decreases with further increase of x in
Dalton
Transactions
Accepted
7 LixA3B2O12. The observed increase in lattice parameter might be not only due to the increasing lithium content but also due to the larger ionic radii of the dopants for A and B. The calculated cubic lattice parameters of LixA3B2O12 along with the ionic radii of the cations are tabulated in Table 2.28 Attempt made to synthesize Li3La3Te2O12 (relatively larger ionic radii La instead of Y in Li3Y3Te2O12) and Li7Y3Zr2O12 (Y instead of La in Li7La3Zr2O12) was unsuccessful, which indicates that the size of the rigid-three dimensional framework produced by A3B2O12 determine the capacity of housing and distribution of lithium atoms across available tetrahedral and octahedral sites in LixA3B2O12.
The preliminary energy dispersive analysis by X-ray (EDAX) and XRF studies on the investigated cubic phase lithium garnets Li3Y3Te2O12 sintered at 825 oC and Li5La3Ta2O12, Li6La2BaTa2O12 and Li6.5La1.5Ba1.5Ta2O12 sintered at 900 oC indicated absence of detectable Al in these samples. However the inclusion of Al from alumina crucible during the preparation of cubic phase lithium garnets Li7La3Zr2O12 and Li7.5La2.5Sr0.5Zr2O12 at high sintering temperature around 1200 oC was indicated by EDAX and XRF. The amount of Al content in the cubic phase lithium garnets with nominal compositions Li7La3Zr2O12 and Li7.5La2.5Sr0.5Zr2O12 sintered at 1200 °C was estimated to be 0.92 wt.% and 0.81wt.%, respectively, by XRF investigation. LLZ has two different crystal phases, one is the cubic and another is the tetragonal phase.7,29,30,31 The LLZ crystal in tetragonal phase (space group I41/acd; No. 142) is an ordered structure with lithium on tetrahedral 8a site and octahedral 16f and 32g sites.29 On the other hand the LLZ crystal in cubic phase (space groupIa3d; No. 230) is disordered structure with lithium on tetrahedral 24d Li(1) and octahedral 96h Li(2) sites.30 The distorted arrangement of Li+ in cubic phase LLZ compared to complete ordering of Li+ across all of the octahedral and one third of the tetrahedral in the tetragonal LLZ leads to two orders of higher Li+ conductivity in the cubic
Dalton
Transactions
Accepted
8 phase LLZ.7,29 However, sintering at high temperature around 1230 °C for 36 h in alumina crucible is needed to obtain high Li+ conductive cubic LLZ (Ia3d).7 Studies suggest that the unintentional incorporation of Al3+ from alumina crucibles into Li7La3Zr2O12 pellet during the high-temperature solid state synthesis helps to stabilize the cubic phase against the tetragonal one.31-34 Recent studies on Li7La3Zr2O12 suggested that the phase stability of high Li+ conductive cubic phase is influenced by both the Al and Li concentration.35 The amount of Al3+ incorporated from the Al2O3 crucible to stabilize LLZ sample in high Li+ conductive cubic phase was estimated to be around 0.9 wt.%.35 Precaution to avoid the inclusion of Alduring the preparation of lithium garnets Li7La3Zr2O12 and Li7.5La2.5Sr0.5Zr2O12 and the determination of exact lithium content in the investigated lithium garnets were not considered in this work since the major objective of this work is to understand the influence of increasing lithium concentration on the Li+ transport properties of cubic phase lithium garnets with nominal compositions LixA3B2O12. However a detailed chemical analyses using atomic absorption spectroscopy (AAS) and inductively coupled plasma mass spectrometry (ICP-MS) to estimate the proper stoichiometry of the prepared samples including lithium and also a detailed studies on the role of Al in Li7La3Zr2O12 and Li7.5La2.5Sr0.5Zr2O12 are in progress and will be published elsewhere.
Raman scattering is a very powerful and useful technique for acquiring structural information on the Li+ conductive oxides. For a deeper understanding of the Raman spectra of lithium garnets, detailed Raman spectroscopic studies on single crystals along with a group-theoretical analysis of vibrational modes are essential. Unfortunately attempt to grow single crystals of lithium garnets with appreciable size for polarized Raman studies were unsuccessful. The earlier Raman studies on lithium garnets and other related systems suggested that the bands observed between 100 cm-1 and 150 cm-1 for the investigated LixA3B2O12 corresponds to
Dalton
Transactions
Accepted
9 vibration of the heavy La or Y cation and the band above 600 cm correspond to the Te-O, Zr-O, Ta-O bond stretching.36-38 It has been demonstrated in several lithium metal oxide materials and in lithium garnets that internal modes of LiO6 appears in the range 200-300 cm-1, whereas the internal modes of LiO4 occurs in the range 350-500 cm-1.39, 40 The Raman spectra of lithium garnet particularly in the range 200-500 cm-1 becomes complicated because of the considerable mixing between internal vibrational modes of LiO4, LiO6 and the other coordinated groups. The Raman spectra of LixA3B2O12 with 3≤ x ≤7.5 sintered at different elevated temperatures measured in the range 75-1000 cm-1 shown as Fig. 4 indicate appreciable variation in peak positions, line width and integrated intensity of the various internal modes. The A3B2O12 array is a host framework in cubic lithium garnets LixA3B2O12. In this frame, Band A ions are located in the center of octahedral BO6 (16a sites) and dodecahedral AO8 (24c sites), respectively. On the other hand, there are two kinds of sites to accommodate Li+, the tetrahedral sites [Li(1), 24d sites] and the octahedral sites [Li(2), 48g/96h sites]. For better understanding of the nature of distribution of lithium atoms among tetrahedral and octahedral sites the Raman spectra of the investigated lithium garnets measured in the range 200-500 cm-1 corresponding to that of the internal modes of LiO6 and LiO4 are shown as Fig. 5. Investigations on structure of the conventional cubic garnet Li3Nd3Te2O12 indicates that lithium housed exclusively on a filled tetrahedral site.17 Hence in the cubic garnet Li3Y3Te2O12 all the Li+ are expected to occupy the tetrahedral Li(1) 24d site and no ion in the octahedral Li(2) sites, which is well reflected in the Raman spectrum of Li3Y3Te2O12 shown as Fig. 5(a). The relatively well defined sharp Raman bands observed at 421 cm-1 and 457 cm-1 in the expected LiO4 internal mode region for the Li3Y3Te2O12 compared to that of the remaining investigated samples indicates the arrangement of Li+ only in the tetrahedral site.
Dalton
Transactions
Accepted
10 As the Li+ concentration i.e., the x value in these garnet-type ion conductors LixA3B2O12 increases there is a redistribution of the Li+ over the available Li(1) and Li(2) sites. Earlier neutron diffraction studies on LixA3B2O12 with x = 5 - 6.6reveals the reduction in the occupancy of the tetrahedral site with an associated increase in the octahedral site along with the displacement off their original central 48g sites to the distorted 96h sites.24 Percival et al. suggested that the distorted octahedral site may be described appropriately in terms of distorted tetrahedral arrangement with two longer bonds.25 Hence the Raman bands observed in the region 300 to 450 cm-1 may correspond to the expected internal modes of LiO4 and distorted octahedral site for the samples Li5La3Ta2O12, Li6La2BaTa2O12 and Li6.5La1.5Ba1.5Ta2O12. The presence of broad band in the region 300 to 450 cm-1 of the Raman spectra of Li5La3Ta2O12, Li6La2BaTa2O12 and Li6.5La1.5Ba1.5Ta2O12 compared to Li3Y3Te2O12 in Fig. 5 supports this prediction.
Group theory analysis predicts 81 modes for the tetragonal (space group I41/acd; No. 142) and 51 modes for the cubic (space groupIa3d; No. 230) Li7La3Zr2O12 garnet, respectively. The foremost difference observed between the Raman spectra of cubic and tetragonal phase of lithium garnets is the presence of larger number of Raman bands for tetragonal than that of the cubic phase mainly in the spectral region 200-500 cm-1. Raman spectrum of cubic phase LLZ in the region 200-500 cm-1 exhibit few broad and fairly overlapping bands associated to degenerate Raman modes, which turn out partly split in tetragonal phase, due to its lower symmetry, thus originating a higher number of observed peaks. The broad spectral features of the cubic garnet in the region 200-500 cm-1 might be due to the static or dynamic disorder of highly mobile Li+ compared to the ordered arrangement in tetragonal phase.41
Dalton
Transactions
Accepted
11 The structure analysis by Xu et al. indicated that the tetrahedral occupancy is destabilized and reduced to 50% in cubic phase Li7La3Zr2O12, while the occupancy of mobile Li+ in octahedral sites increases to 90%.42 They also predicted that when two or more Li(2) ions move concurrently toward their common Li(1) neighbor, the Li(1) ion will be pushed to the Li(1)-Li(2) border and further into the nearby empty Li(2) sites.42 The Raman spectrum of cubic phase Li7La3Zr2O12 shown in Fig. 5(e) indicates a broad band centered at around 370 cm-1 and a shoulder band at around 420 cm-1. The Raman spectrum of Li7.5La2.5Sr0.5Zr2O12 shown as Fig. 5(f) do not show any major change except a slight change in the position, decrease in intensity and increase in the broadness of the bands compared to that of Li7La3Zr2O12. The Raman spectra of Li7La3Zr2O12 (Fig. 5(e)) and Li7.5La2.5Sr0.5Zr2O12 (Fig. 5(f)) indicated the changes in the nature of the lithium environment compared to that of the other investigated lithium garnets.
3.2.Electrical properties
Temperature dependent (room temperature to 300 °C) AC impedance measurements were performed on all the prepared samples in the frequency range 20 Hz to 15 MHz using Li+ blocking Au-electrodes. For direct comparison among the samples with different geometrical sizes, real and imaginary parts of impedance Z′ and Z″ multiplied by a factor of A/t, where A and t are surface area and thickness of each pellet, respectively. The room temperature (33 °C) impedance data collected from Li3Y3Te2O12 revealed it as highly resistive material. Typical AC impedance plot (Cole-Cole) measured at 300 °C for Li3Y3Te2O12 shown as Fig. 6(a) has well resolved shapes i.e., a semicircle in the high frequency region corresponding to that of bulk and relatively a larger semicircle in the low frequency region corresponding to that of grain-boundary. The bulk and total (bulk + grain-boundary) Li+ conductivity of Li3Y3Te2O12 was found
Dalton
Transactions
Accepted
12 to be 3.94 x 10⁻⁶ S cm-1 and 1.48 x 10⁻⁶ S cm-1, respectively at 300 °C. The experimental impedance data points of Li3Y3Te2O12 measured at 300 °C was fitted with an equivalent circuit consisting of two parallel resistances and constant phase elements (CPEs) representing the electrical bulk and grain-boundary (RbCPEb)(RgbCPEgb). Corresponding capacitance value were calculated by using the formula
n n n Q R C 1 1 − =
where R represents the resistance, Q represents the constant phase element and n is the parameter with a value close to 1.
Typical AC impedance plots (Cole-Cole) measured at room temperature (33 °C) for the nominal compositions Li5La3Ta2O12, Li6La2BaTa2O12, Li6.5La1.5Ba1.5Ta2O12, Li7La3Zr2O12 and Li7.5La2.5Sr0.5Zr2O12 are shown as Fig. 6(b)-(f). The impedance plots of Li5La3Ta2O12, Li6La2BaTa2O12 and Li6.5La1.5Ba1.5Ta2O12 (Fig. 6(b)-(d)) exhibit only one semicircle at a higher frequency regime and an obvious tail at a lower frequency domain, which is quite different from the two obviously separated bulk and grain-boundary semicircles observed in the impedance spectrum of Li3Y3Te2O12 (Fig. 6(a)). The appearance of a low-frequency tail in case of ionically blocking Au electrodes (Fig. 6(b)-(f)) is an indication that the investigated garnet type material is ionic in nature at room temperature and similar behavior has been observed for the most of the reported high Li+ conductive lithium garnets.7-9,43
Careful analyses on the impedance spectra of Li5La3Ta2O12, Li6La2BaTa2O12 and Li6.5La1.5Ba1.5Ta2O12 indicated that the observed semicircle is slightly compressed in fact, implying that both the bulk and grain-boundary resistances contribute to the impedance plots. The experimental impedance data points measured at room temperature (33 °C) for
(1)
Dalton
Transactions
Accepted
13 Li5La3Ta2O12, Li6La2BaTa2O12 and Li6.5La1.5Ba1.5Ta2O12 were fitted with an equivalent circuit consisting of parallel resistance-constant phase element for bulk conductance. It is difficult to separate bulk and grain-boundary contribution accurately from the impedance plots measured at room temperature (33 °C) for the nominal compositions Li7La3Zr2O12 and Li7.5La2.5Sr0.5Zr2O12 as shown in Fig. 6(e)-(f). The contribution of grain-boundary resistance to the total resistance for the nominal compositions Li7La3Zr2O12 and Li7.5La2.5Sr0.5Zr2O12 appears to be negligible. The bulk Li+ conductivity extracted by fitting a circular arc to the high frequency data and the total (bulk + grain-boundary) Li+ conductivity is calculated from the inverse of the resistivity derived from the intercepts of the semicircle with the real axis in the low frequency region. The bulk and total (bulk + grain-boundary) Li+ conductivity derived from the impedance plots and the resultant fitting parameters of the investigated samples are tabulated in Table 3 and Table 4, respectively.
Complex impedance spectra are dominated mostly by the resistive components of the sample whereas the modulus spectra highlight those with smaller capacitance. The real (M′) and imaginary (M″) part of the complex electric modulus (M*) have been calculated from the values of real (ε′) and imaginary (ε″) part of dielectric constant using the relation
(
ε 2 ε 2)
ε ′′ + ′ ′ = ′ M(
)
2 2 ε ε ε ′′ + ′ ′′ = ′′ MFor deeper understanding of the contribution of the grain-boundaries to the total resistance of the samples Li5La3Ta2O12, Li6La2BaTa2O12 and Li6.5La1.5Ba1.5Ta2O12 the impedance data are presented as combined imaginary part of the impedance Z″ and electrical modulus M″
(2) (3)
Dalton
Transactions
Accepted
Manuscript
14 against log (f) as shown in Fig. 7(a)-(c) in addition to the conventional complex impedance (Cole–Cole) plots (Fig. 6(b)-(d)). The impedance plot emphasizes the most resistive elements of the sample while the modulus plot highlights those elements with the smallest capacitance because the peak height of M˝ is proportional to 1/C for that element.44 Though both the plots of Z″ and M″ vs log (f), shown in Fig. 7(a)-(c) show a single peak, there is a difference in the peak frequency. Since the capacitance corresponding to the grain-boundary response is relatively large compared to that of bulk response, the peaks of M″ in Fig. 7(a)-(c) correspond to the bulk.44 The difference in the peak frequencies of Z″ and M″ decrease in the order Li5La3Ta2O12 < Li6La2BaTa2O12 < Li6.5La1.5Ba1.5Ta2O12, which indicates the reduction in the contribution of grain-boundary resistance to the total resistance with increase of lithium content in LixA3B2O12.10,21 The combined impedance Z″ and electrical modulus M″ against log (f) plots for the samples Li7La3Zr2O12 and Li7.5La2.5Sr0.5Zr2O12 were not presented since they did not exhibit peaks due to the limitation in the measured high frequency range (15 MHz).
A stepwise increase in the room temperature bulk and total (bulk + grain-boundary) Li+ conductivity was observed as the lithiumcontent increased in LixA3B2O12 with 3≤ x ≤7.0 i.e., from Li5La3Ta2O12 to Li7La3Zr2O12. Among the investigated compositions the room temperature maximized total (bulk + grain-boundary) as well as bulk ionic conductivity was observed for the nominal composition Li7La3Zr2O12. The total (bulk + grain-boundary) Li+ conductivity was found to decrease with further increase of x in LixA3B2O12 i.e., Li7.5La2.5Sr0.5Zr2O12.
The total Li+ conductivity (including bulk and grain-boundary) was considered uniformly for the presentation of temperature dependent conductivity over the investigated temperature range since it is very difficult to separate the contribution from the grain-boundary and bulk at higher temperatures. Arrhenius plot for total (bulk + grain-boundary) Li+ conductivity of
Dalton
Transactions
Accepted
15 Li3Y3Te2O12 (100 °C to 300 °C), Li5La3Ta2O12, Li6La2BaTa2O12, Li6.5La1.5Ba1.5Ta2O12, Li7La3Zr2O12 and Li7.5La2.5Sr0.5Zr2O12 measured in the temperature range 33 °C to 300 °C are shown in Fig. 8. The activation energies (Ea) for the ionic conductivity of LixA3B2O12 3≤ x ≤7.5 are determined from the Arrhenius plots employing the equation:
− = kT E A T a exp σ
where, A is the pre-exponential parameter, k is Boltzmann’s constant and T is the absolute temperature.
The composition dependencies of bulk and total (bulk + grain-boundary) Li+ conductivity measured at 33 °C and activation energy (temperature range RT to 300 °C) for LixA3B2O12 with x > 3 is shown as Fig. 9(a). The composition dependencies of total (bulk + grain-boundary) Li+ conductivity measured at 300 °C and activation energy (temperature range 100 °C to 300 °C for LixA3B2O12 with x = 3 and RT to 300 °C for LixA3B2O12 with x > 3) for composition LixA3B2O12 with 3≤ x ≤7.5 is shown as Fig. 9(b). It is clear from both the Fig. 9(a) and 9(b) that the Li+ conductivity increase initially with an increase of x in LixA3B2O12 and reaches a maximized conductivity for x = 7, i.e., Li7La3Zr2O12 and then decreases with further increase of x. Among the investigated compositions x = 7, i.e., Li7La3Zr2O12 exhibitsamaximized total (bulk + grain-boundary) Li+ conductivity of 5.10 x 10⁻⁴ S cm-1 at 33 °C. In contrast the activation energy initially decreases with an increase of x and reaches a minimum of 0.32 eV for x = 7, i.e., for the nominal composition Li7La3Zr2O12 and then increases with the further increase of x in LixA3B2O12. The high activation energy obtained in the case of Li3Y3Te2O12 gives a clear
(4)
Dalton
Transactions
Accepted
16 indication that the Li+ transport mechanism of Li3Y3Te2O12 might be different from those of stuffed lithium garnets LixA3B2O12 with x > 3.
The diffusivity (D) of Li+ can be calculated from the electrical conductivity using the equation
where q is the elementary charge (1.6 x 10⁻¹⁹ C), K is Boltzmann’s constant (1.38 x 10⁻²³ J K−1), c is the concentration of charge carriers calculated using the relation c = n/V, where n is number of Li+ per unit cell and V is the volume of the unit cell and T is absolute temperature. Change in Li+ conductivity (σ) and diffusivity (D) of LixA3B2O12 (3≤ x ≤7.5) at 33 °C for composition LixA3B2O12 with 5≤ x ≤7.5 and for composition LixA3B2O12 with 3≤ x ≤7.5 at 300 °C are shown as Fig. 10(a) and 10(b), respectively. It can be noted from both the Fig. 10(a) and 10(b) that the values of conductivity and diffusivity increases with increase in lithium concentration in LixA3B2O12 and reaches a maximized value for the nominal composition Li7La3Zr2O12 and then decreases with further increase of x in LixA3B2O12.
The imaginary part of electrical modulus M″ measured as a function of frequency for LixA3B2O12 (3≤ x ≤7.5) at various temperatures are shown in Fig. 11(a)-11(f). The electrical modulus graphs shown as Fig. 11(a)-11(f) reveal that at low frequencies the M″ values approach to zero, which indicates that the electrode polarization does not make any significant contribution to the modulus plot. It can be noted that the electrical modulus graph of Li3Y3Te2O12 showed as Fig. 11(a) exhibits double peaks in the patterns. The most intense peaks are associated with the grain effect which shifts toward higher frequencies with increasing temperature. The other peaks may be associated with the grain boundaries. The electrical modulus graphs (Fig. 11(a)-11(d)) exhibit resolved peaks at unique frequency in the low temperature. The appearance of peak in modulus
2 · · · q c T k D Li σ = + (5)
Dalton
Transactions
Accepted
Manuscript
17 spectrum may be attributed to the charge re-orientation relaxation process of mobile Li . The position of the peaks (M″max) in Fig. 11(a)-11(d) shift towards higher frequencies as the temperature is increased. This behavior suggests that the relaxation rate of this process would increase with the increase in temperature which is due to the domination of hopping mechanism of charge carriers. Other than room temperature the modulus peaking were not observed for the composition x > 6.5 in LixA3B2O12 in the frequency range employed (20 Hz to 15 MHz) as shownin Fig.11(e)-11(f). The shape of the curves of Fig. 11(e)-11(f) for temperatures other than room temperature indicates that the modulus peaks representing the bulk relaxation may takes place at still higher frequencies. The absence of peak indicates that the Li+ performs long-range order migration process in LixA3B2O12 with x > 6.5.
Fig. 12 shows the compositional variation of conductivity relaxation (peak) frequency of LixA3B2O12 (5≤ x ≤7.5) obtained at room temperature from the Fig. 11(b)-11(f). Since we were unable to measure the room temperature impedance data for Li3Y3Te2O12 we considered the conductivity relaxation (peak) frequency data obtained at 100 °C (Fig. 11(a)) for the sake of comparison. A minimum in the conductivity relaxation frequency is obtained for the conventional garnet Li3Y3Te2O12 (even for the data obtained at 100 °C) and then the value of the conductivity relaxation frequency increases with increase in lithium concentration and reaches a maximum for the Li7La3Zr2O12 then decreases for the composition Li7.5La2.5Sr0.5Zr2O12. This behavior suggests the increase in the hopping mechanism of charge carriers with the increase in lithium concentration and reaches a maximized value for the nominal composition Li7La3Zr2O12 then decreases with further increase of lithium concentration i.e., for the nominal composition Li7.5La2.5Sr0.5Zr2O12.
Dalton
Transactions
Accepted
18 The modulus scaling behavior shown in Fig. 13 gives an insight into the dielectric character of the material. We have scaled M″ by M″max and each frequency by fmax, where fmax corresponds to the frequencies of the peak positions in M″max vs log(f) plots. Fig. 13(a)-13(f) shows the normalized imaginary part of the modulus (M″/M″max vs normalized log(f/fmax)) measured at various temperatures of LixA3B2O12 with 3≤ x ≤7.5. The data obtained at different temperatures are almost found to superimpose with one another. The superimposition of the curves at different temperatures indicates that the distribution of relaxation process is independent of temperatures for the given composition of lithium garnet.
3.3. Li+ dynamics
The detailed AC impedance and Raman investigations provide reasonable information on the correlation of Li+ transport mechanism with the lithium concentration in LixA3B2O12 with 3≤ x≤ 7.5. Since lithium inLi3Y3Te2O12 are exclusively housed on tetrahedrally coordinated site (24d) the only possible way for Li+ migration is to activate it from tetrahedrally coordinated site (24d) through empty octahedrally coordinated site, which is not possible at room temperature for the conventional garnet Li3Y3Te2O12. The lack of mobile Li+ at room temperature is the basis for the observed low Li+ conductivity in the conventional garnet Li3Y3Te2O12.
Increase of lithium concentration in the stuffed lithium garnets (i.e., 3< x ≤ 6.5 in LixA3B2O12) led to an increase in the population of octahedrally coordinated site with simultaneous introduction of vacancies in both the tetrahedral and octahedral coordinated sites. The presence of mobile lithium ions and vacancies help to increase the Li+ conductivity with the
decrease of activation energy through the diffusion of Li+ in the low energy barrier route 96h 96h. When the Li+ content reach x = 7 in LixA3B2O12 the occupancy of distorted
octahedrally coordinated site reaches maximum, resulting a maximized total (bulk +
grain-Dalton
Transactions
Accepted
19 boundary) Li conductivity of 5.10 x 10 S cm at 33 °C for the nominal composition Li7La3Zr2O12. The maximized Li+ conductivity observed in Li7La3Zr2O12 might be originated from the diffusion of Li+ between sites 96h 96h and as well as relatively much lower energy three dimensional diffusion path 96h-24d-96h. Since the occupancy of mobile Li+ at octahedrally coordinated site reaches maximum for x = 7 in LixA3B2O12 a further increase of x in LixA3B2O12 leads to an insufficient vacancies for the ion migration hence a decrease in Li+ conductivity was observed for x > 7, i.e., Li7.5La2.5Sr0.5Zr2O12.
Conclusions
The lithium garnets in cubic phase with nominal compositions Li3Y3Te2O12, Li5La3Ta2O12, Li6La2BaTa2O12, Li6.5La1.5Ba1.5Ta2O12, Li7La3Zr2O12 and Li7.5La2.5Sr0.5Zr2O12 were synthesized successfully through solid state reaction by increasing the lithium content in LixA3B2O12 systematically (3≤ x ≤7.5) by proper substitution for A and B. The Raman spectroscopic technique has been utilized primarily to identify the phase and also to probe the nature of distribution of Li+ in the prepared lithium garnets LixA3B2O12 (3≤ x ≤7.5). The temperature required for the stabilization of cubic phase LixA3B2O12 (3≤ x ≤7.5) was found to be dependent on the Li+ concentration. Particularly the Li7La3Zr2O12 and Li7.5La2.5Sr0.5Zr2O12 required much elevated temperatures to stabilize the high Li+ conductive cubic phase with distorted lithium sublattice.
The cubic lattice parameter increases initially with the increase of lithium concentration and reaches a maximized value of 13.0458 Å for Li6.5La1.5Ba1.5Ta2O12 and then decreases with further increase of x in LixA3B2O12. The Li+ conductivity increase with increase in lithium concentration and reaches a maximized value for the nominal composition Li7La3Zr2O12 and then
Dalton
Transactions
Accepted
20 decreases with further increase of x in LixA3B2O12. In contrast the activation energy initially decreases with an increase of lithium concentration and reaches a minimum of 0.32 eV for the nominal composition Li7La3Zr2O12 and then increases with the further increase of x in LixA3B2O12. Although the size of the three dimensional framework produced by A3B2O12 is an important parameter in determining the capacity of housing and nature of distribution of Li+, the dependence of Li+ conduction in cubic LixA3B2O12 could not be explained as a function of lattice parameter alone.
Raman spectroscopic investigations and detailed AC impedance studies provide reasonable information on the correlation of Li+ transport mechanism with the lithium concentration in lithium garnet oxides LixA3B2O12 (3≤ x ≤7.5). The lack of mobile Li+ is the major reason for the observed low Li+ conductivity at room temperature in the conventional garnet Li3Y3Te2O12. Since lithiumare exclusively housed on tetrahedrally coordinated site (24d) in the conventional garnet Li3Y3Te2O12 the only possible way for Li+ migration is to activate it from tetrahedrally coordinated site through empty octahedrally coordinated site, and hence require high activation energy (0.83eV). On the other hand the three-dimensional lithium sub-network formed through the partitioning of lithium atoms among tetrahedral and octahedral sites along with an introduction of optimal vacancies in tetrahedral and octahedral coordinated sites are the reasons for the observed fast Li+ conduction with lesser activation energy in the stuffed lithium garnets. The maximized Li+ conductivity observed in lithium garnet with nominal composition Li7La3Zr2O12 might be originated from the diffusion of Li+ between two distorted octahedral sites (96h-96h) and as well as relatively much lower energy three dimensional distorted octahedral-tetrahedral-distorted octahedral (96h-24d-96h) diffusionpath.
Dalton
Transactions
Accepted
21
Acknowledgements
Authors thank DRDO, New Delhi, India for the financial support (No:
ERIP/ER/0804415/M/01/1183/4.11.2009).
Notes and references
Department of Physics, Pondicherry University, Puducherry - 605 014 *Email: [email protected]
1 J. M. Tarascon and M. Armand, Nature London, 2001, 414,359-367. 2 J. R. Owen, Chem. Soc. Rev., 1997, 26, 259-267.
3 M. Wakihara and O. Yamamoto (Eds.), Lithium Batteries-Fundamentals and Performance, Wiley-VCH, Germany, 1998, p.26.
4 V. Thangadurai, H. Kaack and W. Weppner, J. Am. Ceram. Soc., 2003, 86, 437– 440.
5 V. Thangadurai, S. Adams and W. Weppner,Chem. Mater., 2004, 16, 2998-3006. 6 V. Thangadurai and W. Weppner, Adv. Funct. Mater., 2005, 15, 107-112.
7 R. Murugan, V. Thangadurai and W. Weppner, Angew. Chem., Int. Ed.,2007, 46, 7778-7781.
8 R. Murugan, V. Thangadurai and W. Weppner, Angew. Chem., 2007,119,
7925-7928.
9 V. Thangadurai and W. Weppner, J. Am. Ceram. Soc., 2005, 88, 411-418.
10 R. Murugan, W. Weppner, P. Schmid-Beurmann and V. Thangadurai, Mater. Res. Bull., 2008, 43, 2579-2591.
11 V. Thangadurai and W. Weppner, J. Solid State Chem., 2006, 179, 974-984. 12 R. Murugan, W. Weppner, P. Schmid-Beurmann and V. Thangadurai, Mater. Sci.
Eng. B, 2007, 143,14-20.
13 R. Murugan, V. Thangadurai and W. Weppner, Ionics, 2007, 13, 195-203.
14 R. Murugan, V. Thangadurai and W. Weppner, Appl. Phys. A, 2008, 91, 615-620. 15 T. Zaib, M. Ortner, R. Murugan and W. Weppner, Ionics, 2010, 16, 855-858. 16 A. F. Wells, in Structural Inorganic Chemistry, Clarendon, Oxford, U.K.,1984. 17 M. P. O’Callaghan, D. R. Lynham and E. J. Cussen, Chem. Mater., 2006, 18,
4681-4689.
18 E. J. Cussen and T. W. S. Yip, J. Solid State Chem., 2007, 180,1832-1839. 19 E. J. Cussen, J. Mater. Chem., 2010, 20, 5167-5173.
20 M. P. O’Callaghan, A. S. Powell, J. J. Titman, G. Z. Chen and E. J. Cussen, Chem. Mater.,2008, 2, 2360-2369.
21 R. Murugan, V. Thangadurai and W. Weppner, J. Electro Chem. Soc., 2008, 155, A90-A101.
22 L. J. Miara, S. P. Ong, Y. Mo, W. D. Richards, Y. Park, J. M. Lee, H. S. Lee and
Dalton
Transactions
Accepted
22 G. Ceder, Chem. Mater., 2013, 25, 3048-3055.
23 E. J. Cussen, Chem. Commun., 2006, 412-413.
24 M. P. O’Callaghan and E. J. Cussen, Chem. Commun., 2007, 2048-2050. 25 J. Percival, E. Kendrick and P. R. Slater, Mater. Res. Bull. 2008, 43, 765-770. 26 J. Percival, E. Kendrick, R. I. Smith and P. R. Slater, Dalton Trans., 2009,
5177-5181.
27 H. Xie, J. A. Alonso, Y. Li, M. T. Fernandez-Díaz and J. B. Goodenough, Chem. Mater., 2011, 23, 3587-3589.
28 R. D. Shannon, Acta Crystallogr., Sect A: Cryst. Phys., Diffr., Theor. Gen. Cryst. 1976, 32, 751-767.
29 J. Awaka, N. Kijima, H. Hayakawa and J. Akimoto, J. Solid State Chem., 2009,182, 2046-2052.
30 J. Awaka, A. Takashima, K. Kataoka, N. Kijima, Y. Idemoto and J. Akimoto, Chem. Lett., 2011, 40, 60-62.
31 C. A. Geiger, E. Alekseev, B. Lazic, M. Fisch, T. Armbruster, R. Langner, M. Fechtelkord, N. Kim, T. Pettke and W. Weppner, Inorg. Chem., 2011, 50, 1089-1097.
32 M. Kotobuki, K. Kanamura, Y. Sato and T. Yoshida, J. Power Sources, 2011, 196, 7750-7754.
33 S. Kumazaki, Y. Iriyama, K. H. Kim, R. Murugan, K. Tanabe, K. Yamamoto, T. Hirayama and Z. Ogumi, Electrochem. Commun., 2011, 13, 509-512.
34 A. Duevel, A. Kuhn, L. Robben, M. Wilkening, P. Heitjans and P. Mechano, J. Phys. Chem. C, 2012, 116, 15192-15202.
35 H. Buschmann, J. Do¨ lle, S. Berendts, A. Kuhn, P. Bottke, M. Wilkening, P. Heitjans, A. Senyshyn, H. Ehrenberg, A. Lotnyk, V. Duppel, L. Kienle and J. Janek, Phys. Chem. Chem. Phys., 2011, 13, 19378–19392.
36 C. J. Hill and A. Jha, J.Non-Cryst. Solids, 2007, 353, 1372-1376.
37 G. Larraz, A. Orera and M. L. Sanjuan, J. Mater. Chem. A, 2013, 1, 11419-11428. 38 Y. S. Chen, J. L. G. Fierro, T. Tanaka and I. E. Wachs, J. Phys. Chem. B,
2003,107, 5243-5250.
39 C. Julien, Ionics, 2000, 6, 30-46.
40 C. M. Julien and M. Massot, Mater. Sci. Eng. B, 2003, 100, 69-78.
41 F. Tietz, T. Wegener, M. T. Gerhards, M. Giarola and G. Mariotto, Solid State Ionics, 2013, 230, 77-82.
42 M. Xu, M. S. Park, J. M. Lee, T. Y. Kim, Y. S. Park and E. Ma, Phys. Rev. B, 2012, 85, 052301-1-052301-5.
43 R. Murugan, S. Ramakumar and N. Janani, Electrochem.Commun., 2011, 13, 1373-1375.
44 J. T. S. Irvine, D. C. Sinclair and A. R. West, Adv. Mater., 1990, 2, 132-138.
Dalton
Transactions
Accepted
23
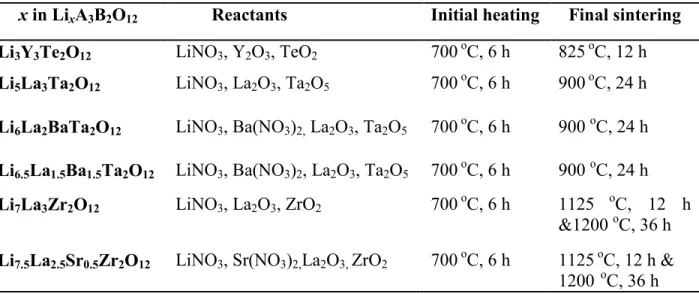
Table 1 Experimental conditions maintained for the preparation of investigated lithium garnets with nominal compositions LixA3B2O12 with 3≤ x ≤7.5
x in LixA3B2O12 Reactants Initial heating Final sintering
Li3Y3Te2O12 LiNO3, Y2O3, TeO2 700 oC, 6 h 825 oC, 12 h
Li5La3Ta2O12 LiNO3, La2O3, Ta2O5 700 oC, 6 h 900 oC, 24 h
Li6La2BaTa2O12 LiNO3, Ba(NO3)2, La2O3, Ta2O5 700 oC, 6 h 900 oC, 24 h
Li6.5La1.5Ba1.5Ta2O12 LiNO3, Ba(NO3)2, La2O3, Ta2O5 700 oC, 6 h 900 oC, 24 h
Li7La3Zr2O12 LiNO3, La2O3, ZrO2 700 oC, 6 h 1125 oC, 12 h &1200 oC, 36 h
Li7.5La2.5Sr0.5Zr2O12 LiNO3, Sr(NO3)2,La2O3, ZrO2 700 oC, 6 h 1125 oC, 12 h & 1200 oC, 36 h
Table 2 The calculated cubic lattice parameters of LixA3B2O12 along with the ionic radii of the cations 28
x in LixA3B2O12 Ionic radius (Å) Lattice parameter, a(Å)
Li3Y3Te2O12 Y=0.9 Å; Te=0.56 Å 12.2834
Li5La3Ta2O12 La=1.18 Å; Ta=0.64 Å 12.8574
Li6La2BaTa2O12 La=1.18 Å; Ta=0.64 Å; Ba=1.42 Å 12.9826
Li6.5La1.5Ba1.5Ta2O12 La=1.18 Å; Ta=0.64 Å; Ba=1.42 Å 13.0458
Li7La3Zr2O12 La=1.18 Å; Zr=0.72 Å 12.9682 Li7.5La2.5Sr0.5Zr2O12 La=1.18 Å; Sr=1.25 Å; Zr=0.72 Å 12.9646
Dalton
Transactions
Accepted
Manuscript
24
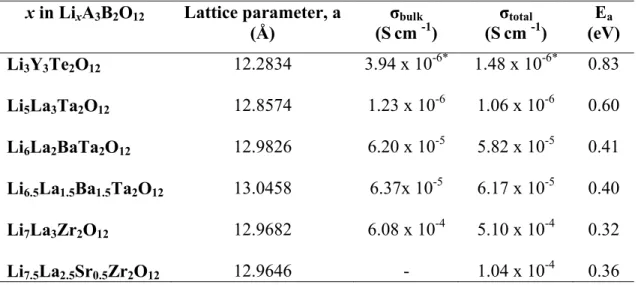
Table 3 Lattice parameter, bulk Li+ conductivity, total (bulk + grain-boundary) Li+ conductivity, and activation energy for the composition LixA3B2O12 with 3≤ x ≤7.5 sintered at different elevated temperatures x in LixA3B2O12 Lattice parameter, a (Å) σbulk (Scm -1) σtotal (Scm -1) Ea (eV) Li3Y3Te2O12 12.2834 3.94 x 10-6* 1.48 x 10-6* 0.83 Li5La3Ta2O12 12.8574 1.23 x 10⁻⁶ 1.06 x 10⁻⁶ 0.60 Li6La2BaTa2O12 12.9826 6.20 x 10⁻⁵ 5.82 x 10⁻⁵ 0.41 Li6.5La1.5Ba1.5Ta2O12 13.0458 6.37x 10⁻⁵ 6.17 x 10⁻⁵ 0.40 Li7La3Zr2O12 12.9682 6.08 x 10 -4 5.10 x 10⁻⁴ 0.32 Li7.5La2.5Sr0.5Zr2O12 12.9646 - 1.04 x 10⁻⁴ 0.36
*conductivity measured at 300 °C and others measured at room temperature (33 °C).
Table 4 Parameters obtained from the fitting of experimental AC impedance data of Li3Y3Te2O12 (300°C) and Li5La3Ta2O12, Li6La2BaTa2O12 and Li6.5La1.5Ba1.5Ta2O12 (33 °C) by using suitable equivalent circuit elements.
Compound Rb (ΩΩΩΩcm) Cb (F) Rgb (ΩΩΩΩcm) Cgb (F) Rtotal (ΩΩΩΩcm) Rgb/Rtotal [a] Li3Y3Te2O12 253824 4.76 x 10⁻¹⁰ 441281 2.55 x 10⁻⁸ 695105 0.63 Li5La3Ta2O12 810030 2.2x 10 -10 136670 - 946700 0.14 Li6La2BaTa2O12 16000 1.84 x 10⁻¹⁰ 1180 - 17180 0.07 Li6.5La1.5Ba1.5Ta2O12 15600 2.12 x 10⁻¹⁰ 602 - 16202 0.04
Dalton
Transactions
Accepted
Manuscript
25
Figure captions
Fig. 1. Systematic increase of lithium content in LixA3B2O12 (3≤ x ≤7.5) by proper substitution for A and B to derive lithium garnets with nominal compositions; Li3Y3Te2O12, Li5La3Ta2O12, Li6La2BaTa2O12, Li6.5La1.5Ba1.5Ta2O12, Li7La3Zr2O12 and Li7.5La2.5Sr0.5Zr2O12.
Fig. 2. PXRD patterns for the nominal compositions (a) Li3Y3Te2O12, (b) Li5La3Ta2O12, (c) Li6La2BaTa2O12, (d) Li6.5La1.5Ba1.5Ta2O12, (e) Li7La3Zr2O12 and (f) Li7.5La2.5Sr0.5Zr2O12 sintered at different elevated temperature along with the standard pattern of cubic phase Li3Y3Te2O12 (JCPDS-25-1433).
Fig. 3. Variation of cubic lattice parameters with the increase of lithium concentration in LixA3B2O12.
Fig. 4. Raman spectra of (a) Li3Y3Te2O12, (b) Li5La3Ta2O12, (c) Li6La2BaTa2O12, (d) Li6.5La1.5Ba1.5Ta2O12, (e) Li7La3Zr2O12 and (f) Li7.5La2.5Sr0.5Zr2O12 sintered at different elevated temperatures measured in the range 75-1000 cm-1.
Fig. 5. Raman spectra of (a) Li3Y3Te2O12, (b) Li5La3Ta2O12, (c) Li6La2BaTa2O12, (d) Li6.5La1.5Ba1.5Ta2O12, (e) Li7La3Zr2O12 and (f) Li7.5La2.5Sr0.5Zr2O12 sintered at different elevated temperatures measured in the range 200-500 cm-1.
Fig. 6. Typical AC impedance plots of (a) Li3Y3Te2O12 measured at300 °C and (b) Li5La3Ta2O12, (c) Li6La2BaTa2O12, (d) Li6.5La1.5Ba1.5Ta2O12, (e) Li7La3Zr2O12 and (f) Li7.5La2.5Sr0.5Zr2O12 (pelletssintered at different elevated temperatures) measured at room temperature (33 °C) using Li+ blocking Au electrodes. The solid line represents the fitted data with an equivalent circuit consisting of (RgQg)(RgbQgb) for (a) Li3Y3Te2O12 and (RgQg) for (b) Li5La3Ta2O12, (c) Li6La2BaTa2O12 and (d) Li6.5La1.5Ba1.5Ta2O12 (where R is the resistance and Q is the constant phase element and the subscripts g and gb refer to the grain and grain-boundary, respectively).
Dalton
Transactions
Accepted
26
Fig. 7. Spectroscopic plots of the imaginary components of the impedance Z″ (solid square) and electric modulus M″ (open square) against log (frequency) obtained at 33 °C for (a) Li5La3Ta2O12, (b) Li6La2BaTa2O12 and (c) Li6.5La1.5Ba1.5Ta2O12.
Fig. 8. Arrhenius plots of (a) Li3Y3Te2O12 measured in the temperature range from 100 °C to 300 °C and (b) Li5La3Ta2O12, (c) Li6La2BaTa2O12, (d) Li6.5La1.5Ba1.5Ta2O12, (e) Li7La3Zr2O12 and (f) Li7.5La2.5Sr0.5Zr2O12 measured in the temperature range from 33 °C to 300 °C.
Fig. 9. (a) Composition dependencies of bulk (solid triangle) and total (solid square) Li+ conductivity measured at 33 °C and activation energy (solid circle) for the composition LixA3B2O12 with 5≤x≤7.5.(b) Composition dependencies of total Li+ conductivity (solid square) measured at 300 °C and activation energy (solid circle) for composition LixA3B2O12 with 3≤x≤7.5.
Fig. 10. Change in Li+ conductivity (σ) (solid square) and diffusivity (D) (solid circle) of (a) LixA3B2O12 (5≤ x ≤7.5) at 33 °C and (b) LixA3B2O12 (3≤ x ≤7.5) at 300 °C.
Fig. 11. Plots of imaginary part of modulus (M″) with frequency of (a) Li3Y3Te2O12, (b) Li5La3Ta2O12, (c) Li6La2BaTa2O12, (d) Li6.5La1.5Ba1.5Ta2O12, (e) Li7La3Zr2O12 and (f) Li7.5La2.5Sr0.5Zr2O12.
Fig. 12. The compositional variation of conductivity relaxation frequency of LixA3B2O12 (for x = 3 measured at 100 °C (half up circle); 3< x ≤7.5 measured at 33 °C, (half up square)).
Fig. 13. Modulus scaling behavior of (a) Li3Y3Te2O12, (b) Li5La3Ta2O12, (c) Li6La2BaTa2O12, (d)
Li6.5La1.5Ba1.5Ta2O12, (e) Li7La3Zr2O12 and (f) Li7.5La2.5Sr0.5Zr2O12.
Dalton
Transactions
Accepted
27
Figures
Fig. 1.
3La3+ 2.5La3++0.5Sr2++0.5Li+ 2Ta5+ 2Zr4++2Li+
3Y3++2Te6+ 3La3++2Ta5++2Li+
3La3+ 2La3++Ba2++Li+
2La3+ 1.5La3++0.5Ba2++0.5Li+
Li3Y3Te2O12 Li5La3Ta2O12 Li6La2BaTa2O12 Li7La3Zr2O12 Li6.5La1.5 Ba1.5Ta2O12 Li7.5La2.5Sr0.5Zr2O12
Dalton
Transactions
Accepted
Manuscript
28 Fig. 2. 10 20 30 40 50 60 70 In te n s it y ( a rb .u n it s ) 2θ θ θ (degree)θ (f) (e) (d) (c) (b) (a) Li 3Y3Te2O12 (JCPDS-25-1433)
Dalton
Transactions
Accepted
Manuscript
29 Fig. 3. 3 4 5 6 7 8 12.2 12.4 12.6 12.8 13.0 13.2 x inLi xA3B2O12 L a tt ic e P a ra m e te r (Å )
Dalton
Transactions
Accepted
Manuscript
30 Fig. 4.
200
400
600
800
1000
(e) (d) (c) (b) (a)In
te
n
si
ty
(
a
rb
.
u
n
it
s)
Raman shift
(cm
-1) (f)Dalton
Transactions
Accepted
Manuscript
31 Fig. 5.
200 250 300 350 400 450 500
(e) (d) (c) (b) (a)In
te
n
s
it
y
(
a
rb
.
u
n
it
s
)
Raman shift
(cm
-1) (f)Dalton
Transactions
Accepted
Manuscript
32 0 40000 80000 120000 160000 200000 0 -40000 -80000 -120000 -160000 -200000 33 οοοοC 0 1000 2000 3000 4000 5000 0 -1000 -2000 -3000 -4000 -5000 Z '' (ΩΩΩΩ c m ) Z' (ΩΩΩΩ cm) Z " ( ΩΩΩΩ c m ) Z' (ΩΩΩΩ cm) (e) σ σσ σ bulk = 6.08x10 -4 S cm-1 σ σσ σtot = 5.10x10⁻⁴ S cm-1 Fig. 6. 0 150000 300000 450000 600000 750000 0 -150000 -300000 -450000 -600000 -750000 σ σσ σtot = 1.48x10⁻⁶ S cm-1 Experimental − Fit σ σσ σ bulk = 3.94x10 -6 S cm-1 Z '' ( ΩΩΩΩ c m ) Z' (ΩΩΩΩ cm) (a) 300οοοοC 0 300000 600000 900000 1200000 0 -300000 -600000 -900000 -1200000 33 οοοοC Experimental − Fit Z " ( ΩΩΩΩ c m ) Z'(ΩΩΩΩ cm) (b) σ σσ σtot = 1.06x10⁻⁶ S cm-1 σ σσ σ bulk = 1.23x10 -6 S cm-1 0 6500 13000 19500 26000 32500 0 -6500 -13000 -19500 -26000 -32500 33 οοοοC Experimental − Fit Z " (ΩΩΩΩ c m ) Z' (ΩΩΩΩ cm) (c) σ σσ σtot = 5.82x10⁻⁵ S cm-1 σ σσ σ bulk = 6.20x10 -5 S cm-1 0 12000 24000 36000 48000 60000 0 -12000 -24000 -36000 -48000 -60000 33 οοοο C Experimental − Fit Z " ( ΩΩΩΩ c m ) Z' (ΩΩΩΩ cm) (d) σ σσ σ bulk = 6.37x10 -5 S cm-1 σ σσ σtot = 6.17x10⁻⁵ S cm-1 0 250000 500000 750000 10000001250000 0 -250000 -500000 -750000 -1000000 -1250000 33 οοοοC 0 20000 40000 60000 80000100000120000 0 -20000 -40000 -60000 -80000 -100000 -120000 Z '' ( ΩΩΩΩ c m ) Z' (ΩΩΩΩ cm) Z " (ΩΩΩΩ c m ) Z' (ΩΩΩΩ cm) (f) σ σσ σtot = 1.04x10⁻⁴ S cm-1
Dalton
Transactions
Accepted
Manuscript
33 Fig. 7. 100 101 102 103 104 105 106 107 0 -360000 -720000 -1080000 -1440000 -1800000 Z " (ΩΩΩΩ ) logf (Hz) 0.000 0.005 0.010 0.015 0.020 0.025 M " (a) 101 102 103 104 105 106 107 0 -600 -1200 -1800 -2400 -3000 Z " (ΩΩΩΩ ) logf (Hz) (b) 0.0000 0.0014 0.0028 0.0042 0.0056 0.0070 M " 101 102 103 104 105 106 107 0 -650 -1300 -1950 -2600 -3250 Z " ( ΩΩΩΩ ) logf (Hz) (c) 0.0000 0.0012 0.0024 0.0036 0.0048 0.0060 M "
Dalton
Transactions
Accepted
Manuscript
34 Fig. 8. 1.6 2.0 2.4 2.8 3.2 3.6 -5.4 -3.6 -1.8 0.0 1.8 (a) (b) (c) (d) (e) (f) 1000/T (K-1) lo g 1 0 (σσσσ T ) ( S c m -1 K )
Dalton
Transactions
Accepted
Manuscript
35 Fig. 9(a). Fig. 9(b). 3 4 5 6 7 8 0.0 2.0x10⁻² 4.0x10⁻² 6.0x10⁻² 8.0x10⁻² 1.0x10⁻¹ 300oC (b) x inLi xA3B2O12 T o ta l C o n d u c ti v it y ( S c m -1 ) 0.2 0.4 0.6 0.8 1.0 A c tiv a tio n E n e rg y ( e V ) 5 6 7 8 0.0 2.0x10⁻⁴ 4.0x10⁻⁴ 6.0x10⁻⁴ 33oC A c tiv a tio n E n e rg y ( e V ) C o n d u c ti v it y ( S c m -1 ) x in Li xA3B2O12 (a) 0.3 0.4 0.5 0.6 0.7 Total Conductivity Bulk Conductivity Activation Energy
Dalton
Transactions
Accepted
Manuscript
36 Fig. 10(a). Fig. 10(b). 5 6 7 8 0.00 1.30x10⁻⁴ 2.60x10⁻⁴ 3.90x10⁻⁴ 5.20x10⁻⁴ σσσσ33 οοοο C ( S c m -1 ) x inLi xA3B2O12 0.0 1.0x10⁻⁹ 2.0x10⁻⁹ 3.0x10⁻⁹ 4.0x10⁻⁹ 33oC D 3 3 οοοο C ( c m -2 S -1 ) (a) 3 4 5 6 7 8 0.0 2.0x10⁻² 4.0x10⁻² 6.0x10⁻² 8.0x10⁻² 1.0x10⁻¹ σσσσ33 οοοο C ( S c m -1 ) D 3 0 0 οοοο C ( c m -2 S -1 ) x inLi xA3B2O12 300oC 0.00 2.80x10⁻⁷ 5.60x10⁻⁷ 8.40x10⁻⁷ 1.12x10⁻⁶ (b)
Dalton
Transactions
Accepted
Manuscript
37 Fig. 11. 101 102 103 104 105 106 0.0000 0.0058 0.0116 0.0174 0.0232 0.0290 0.0348 100 οC 120 οC 140 οC 160 οC 180 οC 200 οC 220 οC 240 οC 260 οC 280 οC 300 οC M " logf (Hz) (a) 102 103 104 105 106 107 0.000 0.002 0.004 0.006 0.008 0.010 33 o C 50 o C 80 o C 100 o C 120 o C 140 o C 160 o C 180 o C 200 o C 220 o C 240 o C 260 o C 280 o C 300 o C M " logf (Hz) (b) 102 103 104 105 106 107 0.000 0.001 0.002 0.003 0.004 0.005 0.006 0.007 logf (Hz) 33 o C 50 o C 80 o C 100 o C 120 o C 140 o C 160 o C 180 o C 200 o C 220 o C 240 o C 260 o C 280 o C 300 o C (c) M " 102 103 104 105 106 107 0.0000 0.0014 0.0028 0.0042 0.0056 0.0070 logf (Hz) 33 o C 50 o C 80 o C 100 o C 120 o C 140 o C 160 o C 180 o C 200 oC 220 o C 240 o C 260 o C 280 o C 300 o C (d) M " 102 103 104 105 106 107 0.0000 0.0016 0.0032 0.0048 0.0064 0.0080 logf (Hz) 33 oC 50 o C 80 o C 100 oC 120 o C 140 o C 160 o C 180 o C 200 o C 220 o C 240 o C 260 oC 280 o C 300 o C (e) M " 102 103 104 105 106 0.000 0.002 0.004 0.006 0.008 0.010 0.012 logf (Hz) 33 o C 50 o C 80 o C 100 o C 120 oC 140 o C 160 o C 180 o C 200 o C 220 o C 240 oC 260 o C 280 o C 300 o C (f) M "
Dalton
Transactions
Accepted
Manuscript
38 Fig. 12. 3 4 5 6 7 8 104 105 106 107 lo g 1 0 f m a x ( H z ) x inLi xA3B2O12
Dalton
Transactions
Accepted
Manuscript
39 Fig. 13. 10-6 10-4 10-2 100 102 104 106 0.0 0.2 0.4 0.6 0.8 1.0 M " /M "m a x log(f/fmax) 100 o C 120 o C 140 oC 160 o C 180 o C 200 oC 220 o C 240 oC 260 o C 280 o C 300 oC (a) 10-6 10-4 10-2 100 102 104 106 0.0 0.2 0.4 0.6 0.8 1.0 M " /M "m a x log(f/fmax) 33 o C 80 o C 100 o C 120 o C 140 o C 160 o C 180 o C 200 o C 260 o C 300 o C (b) 10-6 10-4 10-2 100 102 104 106 0.0 0.2 0.4 0.6 0.8 1.0 1.2 M " /M "m a x log (f/fmax) 33 o C 80 oC 100 o C 120 oC 140 oC 160 o C 180 oC 200 o C 260 o C 300 oC (d) 10-6 10-4 10-2 100 102 104 106 0.0 0.2 0.4 0.6 0.8 1.0 1.2 M " /M "m a x log (f/fmax) 33 o C 80 o C 100 o C 120 o C 140 o C 160 o C 180 o C 200 o C 260 oC 300 o C (c) 10-6 10-4 10-2 100 102 104 106 0.0 0.2 0.4 0.6 0.8 1.0 1.2 M " /M "m a x log(f/fmax) 33 oC 80 oC 100 oC 120 oC 140 oC 160 oC 180 oC 200 oC 260 oC 300 oC (e) 10-6 10-4 10-2 100 102 104 106 0.0 0.2 0.4 0.6 0.8 1.0 1.2 M " /M "m a x log(f/fmax) 33 o C 80 o C 100 oC 120 o C 140 o C 160 oC 180 o C 200 o C 260 o C 300 o C (f)