A final rejoinder on the Stern Review
Simon Dietz, Dennis Anderson, Nicholas Stern,
Chris Taylor & Dimitri Zenghelis
1. Introduction
In this, our final rejoinder on the debate about the Stern Review that has been published by World Economics,1we respond to comments in this issue
by Robert Carter et al., by David Henderson, and by Richard Tol and Gary Yohe.2 Carter et al. continue to argue against a growing body of scientific
evidence and a growing consensus on that same evidence: the climate sys-tem is now warming significantly; this warming is more likely than not to continue and could be rapid; human activities are the major cause of it; potentially very large risks are involved; hence it is an immediate priority for public policy to pursue both greenhouse gas (GHG) emission reduc-tions (mitigation) and adaptation. The source of their critique is, first, a distinctly partisan, and increasingly untenable, position on the broad range of available scientific evidence and, second, a mistrust of the international consensus-building exercise centred on the Intergovernmental Panel on Climate Change (IPCC). Henderson is also largely preoccupied with the
Simon Dietzis Lecturer in Environmental Policy at the London School of Economics and
Political Science, and a Visiting Fellow at the Tyndall Centre for Climate Change Research.
Dennis Andersonis Emeritus Professor of Energy and Environmental Studies at Imperial College
London. Nicholas Sternwas Head of the Stern Review of the Economics of Climate Change, and Head of the UK’s Government Economic Service. In June 2007, he took up a new appointment as the first holder of the IG Patel Chair in Economics and Government at the London School of Economics and Political Science. Chris Tayloris an Economic Advisor to the Stern Review of the Stern Review, HM Treasury. The authors would like to acknowledge helpful comments from Siobhan Peters and Leonard Smith.
1See the various contributions to issue four of volume seven and issue one of volume eight.
2Robert M. Carter, C. R. de Freitas, Indur M. Goklany, David Holland & Richard S. Lindzen, ‘Climate Science
and the Stern Review’, pp. 161–182; David Henderson, ‘Governments and Climate Change Issues: The case for rethinking’, pp. 183–228; Richard S. J. Tol & Gary W. Yohe, ‘A Stern Reply to the Reply to the Review of the
Economics of Climate Change, HM Treasury. Dimitri Zenghelis is Senior Economist on the
latter, procedural issues. Tol and Yohe focus on economic arguments. It is important to remind readers that, in sharp contrast to Carter et al., Tol and Yohe support our interpretation of the current scientific evidence. Their critique is rather narrower in focus and concerns the way in which abate-ment costs were calculated in the supporting work carried out by one of us (Anderson, 2006). It rests on basic confusions and misconceptions, many of which were explained in our previous contributions (Anderson, 2007; Dietz et al., 2007).
However, we think readers of World Economics will be more interested in a broader reflection. How would we, following the debate of the last eight months, assess the approach, policies and arguments set out in the Review? In our view, our analyses and policy proposals, and the arguments in support, are sound and have stood up well to scrutiny. In other words, we were right and for the right reasons. In summary, what are those posi-tions? First, that the cost of strong and urgent action is much less than the cost of delayed or timid action. Second, that policy should give priority to a time path of emissions that can lead to stabilisation of the atmospheric stock of GHGs in the range of 450 to 550 parts per million carbon dioxide equivalent (ppm CO2e), and that this requires emissions to peak within twenty years and to fall by at least 30% by 2050.3Third, that market
mech-anisms will be a crucial element in guiding emission reductions in a cost-effective way, together with appropriate regulation and standards, including for energy efficiency. Fourth, strong action on research, devel-opment and the deployment of new techniques will be required. Fifth, action on deforestation is urgent and very cost-effective. Sixth, adaptation will be of great importance for both developing and developed countries, with the former hit earliest and hardest. Seventh, any global deal should embody the above principles, be constructed in a way that takes strong account of equity between rich and poor nations, both on mitigation and adaptation, and promote an understanding of the risks to economic com-petitiveness and the opportunities, where early action is taken by individ-ual states, regions and companies.
Central to many critiques of the Review (e.g. Dasgupta, 2006; Mendelsohn, 2006; Neumayer, forthcoming; Nordhaus, 2006; Tol and Yohe, 2006 and 2007; Weitzman, forthcoming) is a fundamental misunderstanding of the
3By up to 70% for stabilisation at 450 ppm CO 2e.
role of formal, highly aggregated economic modelling in evaluating a pol-icy issue characterised by the very long run, by profound ethical consider-ations, great uncertainty, market imperfections, limited policy instruments and a requirement for international collaboration. It is this misunder-standing, which sometimes fosters the claim that the Review is in fact right, but for the wrong reasons. Disproportionate attention is thus drawn to the small part of the Review devoted to such formal modelling, espe-cially of the impacts of climate change, so that critics fail to consider the full range of evidence we presented (e.g. Weitzman, forthcoming). At the same time, excessive focus on the formal modelling implies that real-world policy prescriptions become hostage to choosing the values of highly aggregated and simplified parameters within the models, together with the relationships between them (e.g. Nordhaus, 2006). Formal models can and should play an important role in the systematic and transparent explo-ration of assumptions and value judgements, and how they affect the scale and structure of policy. But it is misleading and dangerous to base policy primarily on the results of such models. That is why just one of the 13 chapters comprising the first half of the Review (the second half was on the details of policy instruments) was devoted to ‘integrated assessment models’ of the monetary cost of climate change,4why we were so clear on
their limitations, and why our emphasis was on the more detailed regional effects on the many relevant dimensions of human welfare.
Nevertheless, we have argued strongly and in our view convincingly (see the Postscript to the Review5and Dietz et al., 2007) that, even within
the confines of formal economic modelling, the concerns raised by a small group of commentators do not overturn our basic conclusion that the cost of action is much less than the cost of inaction. Our critics here fall short by failing to simultaneouslyafford the necessary importance to issues of risk
and ethics. The case for strong and urgent action set out in the Review is based, first, on the severe risks that the science now identifies (together with the additional uncertainties6that it points to but that are difficult to
quantify) and, second, on the ethics of the responsibilities of existing
4Chapter 10 analysed macroeconomic models of the costs of emission reductions.
5References to the Review are to “The Economics of Climate Change: The Stern Review”, 2007, published in
January by Cambridge University Press. The Review was published on the web, at www.sternreview.org.uk, at the end of October 2006 and a Postscript added around a month later (and included in the CUP book).
6Where we distinguish between risk and uncertainty, we adopt the Knightian approach to the latter concept:
generations in relation to succeeding generations. It is these two things that are crucial: risk and ethics. Different commentators may vary in their emphasis, but it is the two together that are crucial. Jettison either one and you will have a much reduced programme for action—and if you judge risks to be small and attach little significance to future generations you will not regard global warming as a problem. It is surprising that the earlier eco-nomic literature on climate change did not give risk and ethics the atten-tion they so clearly deserve, and it is because we chose to make them central and explicit that we think we were right for the right reasons.
The implications of following a slow ‘policy ramp’, with meagre emis-sion reductions over the next quarter of a century, would, on our reading of the evidence, be very risky indeed, yet this is implicit in the arguments of, for example, Nordhaus (2006) and Tol and Yohe (2006 and 2007). They do not seem ready to acknowledge the riskiness of the paths they suggest. Our conclusion, that global efforts should be directed at stabilising GHG concentrations in the range of 450 to 550 ppm CO2e, is robust to a variety of considerations (Dietz et al., 2007). If our critics are prepared to allow GHG concentrations to rise to 650 ppm CO2e, 750, or beyond, with sig-nificant associated risks of eventual temperature increases in excess of 5°C above pre-industrial levels (a transformation in global climate, taking it way beyond human experience, and making radical relocations of popula-tions likely), then they should say so. They would have to explicitly argue that the risks brought about by such temperature changes are small, or confidently state that we can adapt to the huge changes in environment brought about by 5°C warming and that we can do so cheaply, or that we simply do not care about these risks and costs, because they are a problem for future generations.
2. The scientific critique
Recent observations of climatic changes, together with improvements to the historical record from multiple data sources, have put beyond any rea-sonable doubt the conclusion that the climate system is warming, and sig-nificantly so (e.g. table 3.2 of Trenberth et al., 2007). The conclusions of Carter et al. (2007) are untenable given this growing body of evidence, because they continue to rely on earlier research, notably Lindzen (1990), which were important contributions to the science at the time, but which
are now remarkably inconsistent with observed warming over the past two decades or so. Eleven of the twelve warmest years on record since 1850 have been between 1995 and 2006, after Lindzen’s paper (Solomon et al., 2007).7Furthermore, as Mitchell et al. (2007) explained, this warming
can-not be attributed to natural forcing alone: we can be very confident8that
most of this warming is due to GHG emissions from human activities. This conclusion is drawn on the basis of running numerical atmosphere/ ocean General Circulation Models (GCMs) against the observational record. Only with GCMs can the various sources of warming, natural and from human activities, be considered separately and in combination. Only when GHG emissions from human activities are included can the observed increases in temperature over the 20th century be reproduced.
In return, Carter et al. (2007) attempt to cast doubt on the value of GCMs. They seek to characterise climate modelling as fitting a curve to the observational data, so that a good fit between a GCM and the obser-vational record apparently proves nothing at all. We certainly do not have the evidence to directly validate exercises in modelling future states of the climate system over long time-scales. Climate prediction is an exercise in extrapolation to states of the world that have, to all intents and purposes, never been experienced before. But modellers do not fit curves in the way Carter et al. suggest. On the contrary, our physical understanding of the key processes represented within GCMs constrains their structure strongly (see also Mitchell et al., 2007). This is not model and parameter manipulation to achieve a perfect fit. Indeed, it is important to note that, despite several decades of developing models and a million degrees of freedom with which to obtain explanatory power, GCM simulations are far from an adequate fit to the observational record, on its many dimensions. While models may replicate changes in global mean temperature quite well (Rahmstorf et al., 2007), they continue to represent other processes, more directly relevant to predicting the future impacts of climate change, either badly (e.g. hurricanes), or not at all (e.g. many characteristics of the El Niño–Southern Oscillation: for a general discussion see Stainforth et al., forthcoming).
7Carter et al. attempt to suppress this evidence by benchmarking recent changes in global mean temperature
against the exceptionally warm year 1998.
890% confident according to the Summary for Policymakers of Working Group I of the IPCC’s Fourth
Thus risk and uncertainty are, and are likely to remain, at the heart of the science and in turn the economics of climate change, and this was indeed a message that the Review repeatedly emphasised. One needs only to look, for example, at the confidence intervals around the estimates of the monetary cost of climate change in Figure 6.5, or to those around the eventual temperature change resulting from various stabilisation lev-els in Figure 13.4 (both in Stern, 2007). While these confidence intervals recognise that, on the basis of the most recent evidence (see e.g. Box 10.2 of IPCC, 2007), there is a small chance that business-as-usual GHG emis-sions could result in negligible warming, there is also a small chance that such increases could warm the Earth by significantly more than 5°C on average. It is precisely because the analysis of the Review entertains all
these possibilities that the burden of proof lies, as Mitchell et al. (2007) propose, with the climate sceptics to demonstrate the basis of their confi-dence that warming caused by human sources of GHG emissions is small and there is trivial risk of substantial damage. At the core of the critique offered by Carter et al. (2007) and echoed by Henderson (2007) is a pecu-liar contradiction. While current syntheses of the evidence, of the type provided by IPCC and the Review, are charged with paying insufficient attention to uncertainty (an accusation that cannot in any case be squared with the analysis and presentation), climate sceptics immediately proceed to ignore all evidence to suggest that there may be a risk of rapid warming as a response to GHG emissions, making categorical assertions that there is, essentially, negligible risk.
The fundamental question that anyone considering the debate in the pages of this journal needs to ask is, what decisions to make in the face of such risk and uncertainty? The central tenets of the economics of risk, including recent extensions to uncertainty (explained in Chapter 2 of the Review), emphasise the importance of reducing the risks of severe climate impacts. If that is accepted, then as we set out in the Review and in our previous paper (Dietz et al., 2007), the flow-stock mechanics driving the accumulation of GHGs in the atmosphere mean that delay in cutting back emissions is costly. Stocks are very difficult to reduce and thus the great uncertainties about future climate change are a reason to act, not to wait and see. In reality, of course, we do not face a once-and-forever decision. Rather we expect to revise policy on emission abatement as new informa-tion on both the costs and benefits of mitigainforma-tion comes to light.
Nevertheless, the prospect of learning does not support a wait-and-see strategy either (e.g. O’Neill et al., 2006; Yohe et al., 2004). Indeed, it is very plausible that some learning will increase uncertainty around key climate parameters, as we improve our understanding of the way in which models represent reality (Stainforth et al., forthcoming). The atmospheric stock of GHGs is currently around 430 ppm CO2e and the rate of addition to that stock is around 2.5 ppm CO2e per annum and rising quickly. Together, these imply that delayed action would probably increase the stock to above 500 ppm in 25 years, making it very difficult to keep below 550 ppm. As we argued in the Review, 550 ppm CO2e is itself a risky place to be, with around a 50% probability that temperature increases will even-tually exceed 3°C relative to pre-industrial times. Put simply, action, even in the unlikely event that the science is wrong, will give us some useful new technologies and investments. Timid action or inaction will, in the likely event that the science is right, put us in a very dangerous position, from which it will be extremely difficult to extricate ourselves. The eco-nomics of risk clearly points to strong action.
Carter et al. (2007) and Henderson (2007) are often preoccupied with procedural concerns about the conduct of the IPCC and about standards of peer review and data disclosure. We believe these concerns have been blown to a proportion far beyond their actual importance to the evaluation of climate policy and to policy-making. As we noted in our previous con-tribution (Dietz et al., 2007), the IPCC Assessment Reports are the most important synthesis of scientific (and other) evidence on climate change. The process is complicated and may not be perfect—so that Henderson’s suggestions on strengthening the process deserve consideration—but the outputs are carefully compiled and presented, and are extraordinarily com-prehensive. The wide variety of evidence presented, on each and every side of the ledger, helps to build confidence. And, notwithstanding the current limits which modelling places on climate prediction, the diligence displayed by the IPCC in compiling the evidence is obvious. In a recent paper, Rahmstorf et al. (2007) show that IPCC projections of climatic changes for the period 1990 to 2005, based on GCMs, track the actual observational record very closely for atmospheric CO2concentrations and global mean temperature.9 If anything, the observational record actually
9These climate models were developed over many years prior to the period of comparison, and they are, as we have
indicates that the climate system, in particular sea-level, is responding more quickly to GHG emissions than the IPCC projections would have predicted. There is no evidence to suggest the IPCC process distorts the presentation of evidence in such a way as to exaggerate the risks of future climate change.
3. Abatement costs
We respond here and in the Appendix to Tol and Yohe (2007) on the costs of emission abatement. They put forward a curve describing the global marginal costs of abatement, in which the marginal costs rise with the square of the amount of abatement at any point in time, but the curve as a whole shifts downwards at an exponential rate with exogenous technical progress, which is assumed to apply to all technologies equally. From this they deduce that, for our estimates to be reconciled with their view, our estimates of costs have to decline by factors of 1015to 1037over a 45-year
period. This is, of course, an absurd exaggeration, which stems from an over-simplified—indeed a flawed—view of how innovation affects costs.
Mitigation technologies such as fossil fuels with carbon capture and storage, nuclear power, solar energy, wind power, biofuels, hydrogen derived from carbon-neutral resources, low-carbon vehicles and several others are all at very different stages of development and show different rates of technical progress. Furthermore, technical progress does not appear exogenously with the ‘passage of time’, as Tol and Yohe assume, but endogenously with investment in R&D, demonstration and deploy-ment. Although constraints will be encountered in some cases, acting to increase costs (the land requirements of biofuels is an obvious case in point, the need for storage technologies is another), ways round these con-straints through substitution and technical progress can be anticipated, and indeed are already the subject of much scientific and engineering research in the universities, national research laboratories and industry. Progress will be uneven, but in general, the more we abate pollution the better we should become at it. The evidence on learning curves, for exam-ple for electricity generation, was set out in Chapter 9 of the Review. Moreover, the wide variety and scope of mitigation options across sectors and technologies is what allows expensive constraints in any one sector to be avoided. The ability to spread the burden of abatement across so many
sectors is precisely what limits the total costs of stabilisation and hence it is essential that coordination and flexibility be achieved in global efforts to reduce emissions.
Different approaches provide different insights and that is why the Review chose to draw on accessible, bottom-up estimates of costs based on an analysis of technological options (Chapter 9 and Anderson, 2006) and to complement this with the findings of the macroeconomic models that we thought captured behavioural effects well, while not misrepre-senting (as Tol and Yohe have done) the importance of technical progress on pollution abatement (Chapter 10).
A glance at Table 2 in the Appendix to this paper shows that our assumptions about technical progress are modest—and also differ between technologies—over the 45-year period; the assumed changes in costs are measured in percentage shifts, not by the astronomical orders of magnitude Tol and Yohe assert. These assumptions, which are also mod-est in relation to historical norms for the industry, were fully reported in the Review (Chapter 9) and the background paper by Anderson (2006) and are easy to compare with those of many other sources. Indeed, that was our intention: to set out the estimates and assumptions in ways that readers of the Review may easily check for themselves. We have re-tabu-lated them once more such that the readers may indeed form their own judgements.
4. Ethics and risk
4.1. A broad range of evidence
Many critiques of the Stern Review are wide of the mark, because they fail either to recognise or to acknowledge the broad range of evidence that supported our conclusions. To read these critiques is to form the mistaken impression that formal economic modelling was the mainstay of the Review. Tol and Yohe (2007) appear to be particularly confused as to the role of our formal modelling, a confusion they are keen to foster through selective quotation from our Executive Summary. The Review’s assess-ment was built on three lines of investigation. The simplest and most important comparison to be made is between our disaggregated analysis of the physical impacts of climate change on multiple metrics (e.g. water and food availability, health and infrastructure: Chapters 1, 3, 4 and 5), and
‘bottom-up’ estimates of the costs of specific mitigation strategies, based on different portfolios of technologies (Chapter 9 and Anderson, 2006). As we re-emphasised in our previous paper (Dietz et al., 2007), the key ques-tion that policy makers should ask is whether paying an insurance pre-mium of around 1% of GDP over much of this century is worthwhile to reduce the risks and uncertainties described.
This question is central, because it presents the basic policy problem as simply and transparently as possible, thereby avoiding the process of aggregation of risks and uncertainties across all nations and dimensions, a process for which data are extremely thin and which ignores or suppresses so much of what is important. Nevertheless, formal economic models are useful for exploring particular, stylised aspects of the problem, such as the role of attitudes to intergenerational equity and risk in estimating the cost of climate change, and the role of behavioural changes in the economy as a whole in determining the cost of mitigation. Thus the second line of investigation in the Review compared the results of integrated assessment models of the cost of future climate change (impacts and adaptation: Chapter 6), with macro-economic models of the cost of mitigation (Chapter 10). The third approach, in Chapter 13 of the Review, set out an informal price-based approach, comparing the expected marginal costs of shifting from one path of emission reductions to another (e.g. moving from a stabilisation target of 650 to 550 ppm CO2e), with the expected marginal benefits of doing so.10
In thinking about the role of formal models in climate change, ments for trade liberalisation provide a useful analogy. These trade argu-ments are based on a range of perspectives, from detailed studies of experiences with different trade policies in different times and contexts, to basic conceptual notions, in particular comparative advantage. On top of this, there are a number of computable general equilibrium (CGE) mod-els of trade, which attempt to directly estimate gains from liberalisation. Most economists are much more convinced by the former range of argu-ments than by the CGEs, because the latter leave out too much that is cru-cial and are often rather sensitive to assumptions concerning what they do include. Furthermore, in thinking about the analogy, we should recognise that CGE models of trade are probably much fitter for the purpose of
10The three approaches are, of course, logically related in a formal sense, but they represent different
capturing trade effects than integrated assessment models are for captur-ing the economic effects of climate change.
But even within the narrow confines of formal economic modelling, the concerns raised by many commentators do not overturn our basic conclu-sion that the costs of timid or delayed action are very high and substan-tially exceed the costs of timely, measured and well-planned emission reductions. Ultimately, the debate turns on the fundamental structure of the problem defining climate-change policy: on the one hand, ethics, both in terms of the ethical status of future generations and the distribution of income and wealth, and on the other, risk.
4.2. Ethics and discounting in formal economic modelling
In formal economic modelling, the ethical discussion has been primarily focused on attitudes to inequality (via the elasticity of the social marginal utility of consumption, η) and the weight given to future generations (via the rate of pure time preference, δ). This is, of course, already a very nar-row view of ethics, which for example omits notions of rights and respon-sibilities between and within generations. Nevertheless, in these highly aggregated models, ethical considerations usually boil down to these very simplistic concerns.
But there is another problem that cannot be made to disappear even in these narrow models. That is, the consequences of climate change can be very large for the world as a whole. In a context where we must consider major non-marginal changes, the marginal approach of standard invest-ment appraisal, which depends on seeing ‘projects’ as small perturbations around a given path of economic growth, is inadequate. The risks that cli-mate change poses could significantly reduce economic growth in the future, so we cannot simply take growth as given. Instead, we have to use the same economic and ethical principles, but go back to the overall objec-tive of social welfare and the overall model structure that underpins the special case of the marginal approach. We must be clear on this: the trans-formation of the planet at issue here cannot be considered marginal. It is therefore a basic mistake to start the ethical analysis with an initial view of ‘appropriate’ discount rates (e.g. Nordhaus, 2006; Weitzman, forthcoming).
There are very difficult issues in starting a numerical discussion from market discount rates even within standard, medium-term cost–benefit analysis of marginal changes. In other words, even in this context, it is a
mistake to believe that we know from market observation what those dis-count rates should be. Capital markets are full of distortions related to the role of information. Further, market rates of return to investments are not social rates of return—they generally take no account, for example, of environmental damages or other market distortions. But most importantly, we do not see any markets that can reveal clear answers to the question “how do we, as a generation, value benefits to collective action to protect the climate for generations a hundred or more years from now?” (see Hepburn, 2006, and Dietz et al., 2007, for further discussion).
All this is not to argue that the markets contain no information. The problem is that they contain too much information on the one hand (real interest rates on 50-year, government-indexed bonds in the UK have been around half a percentage point recently and some investment rates of return are, say, 15% or 20% over the short or medium term) and too little information on the other (there are no substantive markets for the very long run). The interpretation of the data that are there needs very strong assumptions, which essentially force the answers. Notice too that govern-ments vary greatly in what they impose as required rates of return on investments: for example, the UK government uses 3.5% for medium-term projects (falling over the long medium-term) and the US 7%. There are all sorts of institutional reasons for making these choices of required rates of return, including gaming and ‘optimism bias’ from project sponsors. All this implies that for this type of non-marginal, very long-term issue, we must go back to first principles.
With the restrictive assumption of marginal changes in the absence of uncertainty, the social discount rate r in these models is, where g is the growth rate:
r= ηg+ δ (1)
Each element on the right-hand side of (1) has a different role. First, η captures attitudes, in this framework, to risk and to intra-generational dis-tribution, as well asto inter-generational distribution. Second, gis a feature of model structures and assumptions, not ethics. Higher ggives not only a higher social discount rate but also earlier emissions and hence earlier and higher damages from GHGs. Third, in the context of climate-change pol-icy, δis largely about ethical discrimination by date of birth (apart from the probability of planetary demise: see Chapter 2 of the Review).
Let us consider some of these elements in turn. First, we examine δ. We would still insist that we have not heard a serious ethical argument in favour of extreme values of δ of 2% or 3%, which Nordhaus (2006) and Weitzman (forthcoming) appear to support. Different values of δ will be appropriate in different circumstances. The circumstances here are collec-tive choices today to reduce global emissions of GHGs, providing poten-tially very large benefits across many generations. Seen in this light, it is very clear thatδshould largely be interpreted in terms of ethical discrim-ination by birth date. It is not a question of an individual’s impatience with respect to his/her own consumption in his/her own lifetime, nor should it include the larger set of risks to the survival of individual government
proj-ects, with a marginal effect relative to the overall growth path.11
Interpreted as discrimination by birth date, extreme values of δare diffi-cult to justify. If δ= 2%, then someone born in 1972 would have twice the ethical weight of someone born in 2007 (for δ= 1.5%, the date correspon-ding to 2007 is 2020). In other words, if they were both expected to have the same income, an extra unit of consumption to the latter would have half the weight to that of the former. Would many regard this as ethically acceptable in terms of responsible social action? We think not. Further, high δcan lead to a version of time inconsistency—each generation post-pones action, because with high δit will also seek to minimise short-term mitigation costs, passing the burden on to the next generation, and so on. Beckerman and Hepburn (2007), drawing on the moral philosophy of David Hume, describe how ‘agent-relative ethics’ may be justified by observing that such ethics have over the centuries protected us from anar-chy and encouraged cooperation, first and foremost with those close to us. But, again, context is key: in climate change we face unprecedented risks to human development, where the causes and consequences of these risks are generations apart. Ultimately, strong international collective action can only be sustained by support from people around the world, but they must consider directly questions like “how do we, as a generation, value bene-fits to collective action to protect the climate for generations a hundred or more years from now?” For all the reasons we have given, it is simply mis-taken to use market rates, or required rates on government projects, as an answer to questions of how people approach this issue.
Next, we examine growth, g. The growth assumptions in the formal modelling of Chapter 6 of the Review were fairly conservative: global growth starts at around 2.5% on aggregate (0.9% per capita, due to rapid population growth) and falls to around 1.8% (1.4% per capita) in the latter half of the 22nd century. However, it is certainly plausible that over a period of time global growth rates could be higher than this. This would have two effects, working in opposite directions, on the assessment of future damages: first, higher growth brings both earlier emissions and thus damage; second, higher future incomes bring greater discounting (before the effects of climate damages kick in hard). We have not formally mod-elled these effects but our judgement and preliminary assessments sug-gest that both effects are strong.
Let us now turn to η. Some have argued (e.g. Dasgupta, 2006) that η= 1 is too low. This is also an ethical parameter and as such it is important to look at alternatives—as we did in the Postscript to the Review. What is an appropriate range? Many cost–benefit analyses use essentially η = 0: i.e. they weight an extra dollar to all individuals in the same way. That is prob-lematic over an infinite horizon, since with growth it can lead to divergent welfare integrals (see the Appendix to Chapter 2 of the Review). On the other hand, η= 2, as some seem to propose, does not appear to be credi-ble. Those who argue η= 2 are by implication saying that taking one dol-lar from an individual A, who has five times the income of individual B, is a social improvement, provided no more than 96% gets lost on the way (in other words, an extra dollar to individual B is worth 52or 25 times that to
individual A). That would be the ethical position implied and because η captures attitudes to inequality both within and between generations, con-sistency demands that we see such a redistribution as a social improve-ment not only between generations, but between individuals today.
We have to go back to first principles in considering a range of values of ηand δ. For η, we would suggest that the above discussion points to, for sensitivity analysis, a reasonable range of between 1 and 2, although we would suggest that the range 1 to 1.5 is likely to be of greater interest to most ethical observers. We do recognise that the combination of η= 1 and δ = 0.1% places a very high weight on the future (see the Appendix to Chapter 2 of the Review on convergence of utility integration). And we recognise that there is a plausible ethical case for higher η.It is a mistake, however, to argue that η = 1 together with low δ necessarily imply very
high savings rates if incorporated into an optimum savings model (as Dasgupta, 2006, and Nordhaus, 2006, have done). The reason is that the optimum savings rates in such models also depend on assumptions about the structure of production, including technical progress. If, for example, technical progress contributes significantly to growth, then η= 1 together with low δare consistent with current rates of savings.
Overall, we would argue that, in focussing on discounting, our critics have shown little understanding of the great body of literature on applied welfare economics and project appraisal (a notable exception is Dasgupta, 2007). And they have taken little account of the very big differences between marginal and non-marginal analysis, between collective action and individual action, between the short to medium term and the long term (and the appropriate role of market data in that distinction), and between risk and uncertainty (although Weitzman, forthcoming, has much that is valuable on risk and uncertainty).
4.3. Risk in formal economic modelling
The structure of risks included in our formal modelling was cautious. In its Fourth Assessment Report, the IPCC is very careful not to include in its probability distributions of temperature increase the effects of phenomena that, although they appear to be real possibilities, have not yet been suffi-ciently modelled to provide relevant probabilities. Nevertheless it is recognised that such possibilities are there. Examples include abrupt, dis-continuous and large-scale positive natural feedbacks that would amplify the warming caused by GHG emissions, such as the thawing of the per-mafrost to release the potent GHG methane, the collapse of the Amazon ecosystem and thus the loss of a major carbon sink, and the decline in the absorptive capacity of the oceans and other features of the carbon cycle. In the Review, we illustrated the effects of introducing a modest scenario of such positive feedbacks, based on studies that have explored methane releases from wetlands and melting permafrost, as well as weakened car-bon sinks (see Box 6.1, on p. 175 of the Review). This modest scenario, which we called the ‘high-climate’ scenario, added 0.4°C to mean warm-ing in 2100 compared with the Review’s baseline-climate scenario (which replicates the range of warming projections in the IPCC’s Third Assessment Report), and an additional 1.2°C in 2200. The mean estimate of the total
discounted cost of business-as-usual (BAU) climate change increased from around 11% to around 14%.12
Other possible effects that have been identified in the scientific litera-ture might exert still more powerful influences. Thus, there are strong grounds for thinking that the models of Chapter 6 of the Review underes-timaterisk. And we have seen that the effects of including just one of the relevant extra causes of risk may be high. The lines of argument on risk set out by Weitzman (forthcoming) are very interesting and indicate some agreement with this view.
4.4. Putting ethics and risk together
In this paper, we have emphasised that the two fundamental issues guid-ing the appropriate strength and timguid-ing of climate-change policy are ethics and risk. The more hostile commentators on the Review’s formal model-ling usually adopt one of two positions. The first is that our basic conclu-sion is wrong. The second is that it is right, but for the wrong reasons. Those who believe our conclusion is wrong neglect, or adopt a misguided position on, one or both of ethics and risk. We discussed their objections above. Those who believe we are right but for the wrong reasons are merely choosing to emphasise one (usually risk) at the expense of the other (ethics).
But both are necessary foundations of the case for strong action, as we argued in the Review and demonstrated in the Postscript and in Dietz
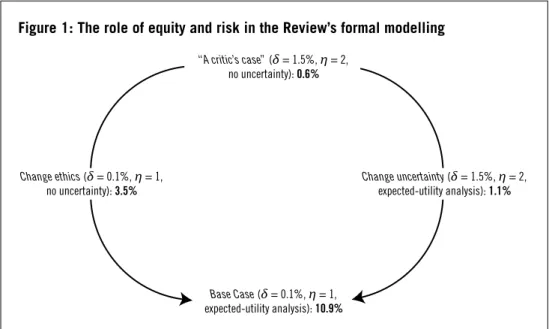
et al. (2007). Figure 1 offers a different way to make the point. At the bot-tom of the diagram is the Review’s estimate of the mean total discounted cost of BAU climate change, using the PAGE2002 integrated assessment model and our ‘base’ modelling case.13 In our base case, δ = 0.1%, η = 1
and we take risk into account by calculating expected utility from a wide range of scenarios, produced using Monte Carlo methods. The estimate is a permanent, 10.9% loss in global mean consumption per capita today.
At the top of the diagram is an estimate that would follow from some previous studies and is implied by some critiques of our formal modelling
12This measure of total discounted cost is derived from a comparison of the ‘balanced growth equivalent’ or
BGE of consumption without climate change to the BGE of consumption after climate damage and adaptation costs have been deducted. It summarises simulated losses over time, regions of the world and possible states of the world in terms of a permanent loss of global mean per-capita consumption today.
13As is by now familiar in our sensitivity analyses, we consider the baseline-climate scenario, with market
impacts, non-market impacts and the risk of abrupt, large-scale and discontinuous or ‘catastrophic’ climatic changes. PAGE2002 is comprehensively reported in Hope (2006).
(e.g. Nordhaus, 2006): δ = 1.5% and η = 2, while little or no account is taken of risk or uncertainty, an effect we produce by taking mode values or best guesses for all the hitherto stochastic parameters in PAGE2002. The damage estimate is just 0.6%, too low to support strong action.
In between, we show two very different routes between this implausi-ble set of assumptions and our base case. Moving down the left-hand side, we decrease δand ηso as to place more ethical weight on future genera-tions, but continue to omit uncertainty. The mean estimated cost of BAU climate change increases to 3.5%. Down the right-hand side, we retain the implausible ethical parameters of the ‘critic’s case’, but take account of uncertainty by calculating expected utility, using the Monte Carlo meth-ods and associated probability distributions of the Review. The cost of cli-mate change increases only fractionally, to 1.1%. Neither change is alone sufficient to bridge the gap between the top and bottom examples. It is the interaction between risk and ethics that is crucial. This should be obvi-ous: greater climate risks fall in the future, and it is only through affording future generations significant ethical weight that we would be motivated to protect them from these risks. Thus it is an error to suggest that our results, which give damages higher than most of the previous literature, come only from the different ethical parameters. They come, as we have insisted throughout the discussion, from a serious analysis of ethics, and
Base Case (δ = 0.1%, η = 1, expected-utility analysis): 10.9%
Figure 1: The role of equity and risk in the Review’s formal modelling
Change uncertainty (δ = 1.5%, η = 2, expected-utility analysis): 1.1%
“A critic’s case” (δ = 1.5%, η = 2, no uncertainty): 0.6%
Change ethics (δ = 0.1%, η = 1, no uncertainty): 3.5%
from incorporating risk and analysis based on modern science. Much of the earlier economics literature has been remiss in its treatment of these key issues.
What happens if we increase η, as for example Dasgupta (2006) has sug-gested, while at the same time placing more emphasis on the danger that climate change could inflict very high costs on growth and development, as for example Weitzman (forthcoming) has done? In Table 1, we show the sensitivity of the Review’s estimates to the interaction between higher val-ues of ηand greater dangers from climate change. We make a simple rep-resentation of greater dangers through changes in the convexity of the relationship linking increasing temperatures with increasing damages in market and ‘non-market’ sectors of the economy (the damage function exponent, γ).14In the Review, γ, like many other parameters, was sampled
from a triangular probability distribution, in this case with a minimum value of 1 (damages are linear in temperature), a mode value of 1.3, and a maximum value of 3 (giving a mean value of 1.8). To demonstrate sensiti-vities, in this case we treat γas deterministic and consider the range 2 to 3. γ = 2 corresponds most closely, in terms of estimated damages, to the distribution used in the base case in the Review: i.e. the top row of Table 1 gives results very similar to those in the Review. The sensitivity analysis in the Postscript to the Review provides other examples of ways of think-ing about greater risks, by shiftthink-ing the distribution of γ.
Taking together the arguments for higher η (Dasgupta, 2006) and
greater emphasis on risk (Weitzman, forthcoming), we have a move down
14We could also have investigated sensitivity to the parameters that jointly determine the probability of an
abrupt and discontinuous climate ‘catastrophe’. The results are similar (see Dietz et al., forthcoming), but the greater number of parameters in the latter approach make for a more complicated exposition.
Table 1: Sensitivity of total cost of climate change to damage function exponent and consumption elasticity of social marginal utility in baseline-climate scenario (mean BGE loss, 5%–95% confidence interval)
Consumption elasticity of social marginal utility (η) Damage function exponent 1 1.5 2
2 10.4 (2.2–22.8) 6.0 (1.7–14.1) 3.3 (0.9–7.8)
2.5 16.5 (3.2–37.8) 10.0 (2.3–24.5) 5.2 (1.1–13.2)
the diagonal of Table 1. η= 1.5 and γ = 2.5 is another plausible example, which could have served as a ‘central case’. In fact it gives a cost estimate of 10%, very close to that of the Review. The Review itself adopted as its central case ethical parameters that give a high weight to the future, but was conservative on risk. Taking more egalitarian values andallowing for the extra risk—and a plausible case can be made for both—gives another possible central theme with very similar results.
We have stayed within the formal modelling and have shown that com-bining the position of some of the more thoughtful commentators gives results similar to those of the central case of the Review. We must empha-sise very strongly, however, that the formal modelling leaves out key issues that would raise estimated damages beyond those embodied in the model. These were discussed explicitly and strongly both in the Review itself and in our earlier response to critiques in this journal (Dietz et al., 2007). Amongst them, we would emphasise: (i) the treatment of environmental goods and services as separate ‘goods’, in contrast to the aggregated treat-ment of climate damages in almost all studies, of which Chapter 6 of the Review was no exception; (ii) intra-generational distribution; and (iii) the risk of conflict.
If incomes grow, but the environment is damaged due to BAU emis-sions, then the price of environmental goods, in terms of social willing-ness-to-pay, will rise sharply (see p. 58 of the Review). Thus investing in alternative (non-mitigation) investments with the intent of ‘buying down’ climate damage later will very likely be a misguided policy, although it is implicit in the ‘slow policy ramp’ of Nordhaus (2006) and others. This point has been convincingly elaborated in formal models, such as those by Guesnerie (2004), and Hoel and Sterner (2006). The point is still more forceful if one takes account of the irreversibilities in the flow-stock process of GHG accumulation and in the nature of damages.
The formal modelling in the literature (ourselves included) has not focused strongly enough on intra-generational distribution, even though it will be the poor countries who are hit earliest and hardest. The Review in its disaggregated analysis stressed this very strongly (see Chapter 4, Chapter 13 and much of Parts V and VI). An important topic for those who want to spend more effort and resources on the formal modelling would be to include these issues more explicitly. This will raise damage estimates, particularly for higher η.
The third omission, conflict, receives no explicit attention in the formal modelling. Indeed, it is very difficult to capture this risk formally in a con-vincing way. However, the possibility of large temperature increases, say greater than 5°C above pre-industrial, would very likely involve massive pressures for movements of population away from the Equator. Remember that when temperatures were 5°C below where they are now, much of North America and Europe was under hundreds of metres of ice. When populations move on a large scale, there are risks of severe conflict. Such considerations have not been part of the formal modelling but are surely of great potential importance in the case of risks under BAU.
5. Conclusions
It may be helpful for those who want to navigate through the maze of com-mentaries on the Stern Review to have a bullet-point summary of our reac-tions. The summary below concludes our rejoinder.
1. The costs of stabilising the stock of GHGs in the range 450–550 ppm CO2e are considerably less than the costs of delayed action. This con-clusion is robust across most reasonable perspectives, including param-eter variation within formal modelling.
2. The policies proposed by the Review to stabilise within this range are sound and based on strong economic principles, which move beyond the previous literature in important ways, concerning risks and ethics and constructing an international ‘deal’.
3. The Review’s foremost argument for strong action is based on a detailed, disaggregated assessment of the risks of business-as-usual (or of delayed action) in various regions and on various dimensions. The types and scale of risks involved were confirmed by the IPCC’s Fourth Assessment Reporta few months after publication of the Review, thus dis-missing early claims by some that we exaggerated the risks, and by oth-ers that we undoth-erstated them.15
15On the point of consistency between the IPCC and the Stern Review, it should be noted that the excerpt
from a BBC radio interview, quoted by Henderson (2007, section 3: “Parallel assessments”), is taken from a programme aired before the IPCC released its Fourth Assessment Reportand therefore relates to a comparison with previous IPCC results, despite the way in which Henderson uses it (the programme was broadcast on 25 January 2007 and recorded weeks before that: IPCC released the Summary for Policy Makers of Working Group I on 2 February 2007). Furthermore, the statement by Stern was taken out of context and was not in response to the question put by the journalist, which was inserted afterwards.
4. The costs of emission reductions to stabilise within the above range were estimated to be around 1% of world GDP, although there is a mar-gin of uncertainty, as emphasised in the Review. Commitment now, clear medium- and long-term objectives, and good economic instru-ments will control these costs. The Review’s cost estimates are consis-tent with those from the World Energy Outlook of the International Energy Agency, published subsequent to the Review at the end of 2006 (IEA, 2006), thus countering claims by some that we underestimated the costs of adjustment.
5. The second, and supporting, argument for strong action is based on integrated assessment modelling, which implied high costs of inaction under a range of reasonable variations in assumptions.
6. Critics have focused on the formal modelling in a way that shows naïve understanding of the appropriate use of such models in policy debate. In the very long-term and complex context of climate change, such models cannot be of sufficient plausibility to provide the main argument. 7. Misleading and mistaken criticisms of the Review include a whole range of casual misreadings or simple errors—many examples were
given in the Appendix to our previous article in World Economics
(Dietz et al., 2007).
8. Discussion of discounting by some commentators has been confused (with one or two important exceptions) and has shown a weak under-standing of the basic theories of cost–benefit analysis and the applied theory of policy:
a. Discount rates are essentially marginal concepts and this is a very dif-ferent problem involving non-marginal change;
b. There is no market revealing the preferences of a community con-sidering responsible action over many generations—thus we cannot observe the appropriate discount rate;
c. We have not seen a serious ethical argument for a high rate of pure time preference, and there is no contradiction between the applica-tion, on the one hand in climate-change policy, of a very low rate of pure time preference to the intergenerational comparison of welfare, and on the other hand in the appraisal of shorter-run and marginal projects, the application of higher rates to account for the possible col-lapse of the project environment;
d. A range of values of the elasticity of the social marginal utility of consumption, η, is plausible. The range 1–1.5 is plausible as a representation of commonly accepted values, but when we get to 2 we begin to stretch credibility, in terms of the very big redistribu-tional transfers implied;
e. Faster growth gives not only a higher discount rate but also earlier emissions and thus earlier and higher damages;
f. There is no contradiction between the Review’s discount rates and current rates of savings once the structure of growth (in particular technical progress) is taken into account.
9. The key arguments and conclusions of the first half of the Review remain strong. The reasons we come to different results from some earlier literature lie in using modern science, and being serious about risk and ethics. From this perspective, some of the earlier literature is now seen to be badly misleading.
10. Those who deny the importance of strong and early action should explicitly propose at least one of three arguments: (i) there are no seri-ous risks; (ii) we can adapt successfully to whatever comes our way, however big the changes; (iii) the future is of little importance. The first is absurd, the second reckless, and the third unethical.
APPENDIX
The costs of emission abatement estimated by the Review
In this Appendix, we clarify the actual assumptions made in estimating the cost of emission abatement. For interested readers, we should emphasise that all this evidence and all these assumptions are fully explained in the Review and in Anderson (2006). Table 2, taken from the background paper (Anderson, 2006), lists the cost estimates for a large number of low-carbon technologies relative to the costs of the fossil-fuel technologies (termed the ‘marker’ technologies) they would displace.16The table does not show the ranges assigned to these estimates,
which are reported in Anderson (2006) and in the Review; but, roughly speaking, the capital costs and fixed annual maintenance costs were given error margins of ±25%, international oil prices ranges of $25–$80 per barrel with a mean of $50/barrel, and international gas prices ranges of £2–£6 per gigajoule with a mean of £4/gigajoule. These estimates were reviewed by many people in industry and government, and by fellow academics.
In practically all cases, the expected costs of the low-carbon options are higher—sometimes appreciably higher—than those of the markers, and it is clear that a significant carbon price will be needed to bring even the more mature tech-nologies into use, plus a combination of a carbon price and incentives for inno-vation in other cases. Table 3, as an example, shows the effects on relative costs of adding a total price incentive (equal to the sum of a carbon price plus an incen-tive for innovation) of £250/tonC over the next 10–15 years, and £150/tonC by around 2025. As can be seen, this would tilt the balance in favour of the deploy-ment of a good number of low-carbon options. Some of the promising options would still be left out, which is one reason why we argued for a continuation of R&D and innovation policies in the Review.
Among the scientists, engineers and economists who have taken an interest in this field, there are three well-supported conclusions from an analysis of the tech-nological options. The firstis that several subsets or portfolios of these options are capable of meeting the world’s energy demands several times over; that is, of achieving very high levels of carbon abatement at costs higher than, but not far removed from, those of fossil fuels. We can do no better than cite the splendid pedagogical analysis of Pacala and Socolow (2004) on the subject, which is sum-marised in Chapter 8 of the Review. The second is that the unit costs tend to decline endogenously with investment, principally through discovery, invention, ‘learning-by-doing’ and scale economies, either in application or (as many technologies are modular) through batch production. The actual rates of decline 16The estimates were later converted by the Review into dollars at a purchasing power parity rate of $1.60/£.
are of course uncertain, which is one reason why we introduced wide error mar-gins in the estimates. But the directions are fairly clear. The thirdconclusion (also discussed in the Review) is that several technologies will run into constraints: the rate of build and acceptability of nuclear power; the land available for biofuels; the capacity and integrity of the sinks for carbon capture and storage; the need to develop storage technologies for ‘intermittent’ renewable energy technologies if these resources are to be used on a very large scale, and for hydrogen storage if this is to be used as a zero carbon energy carrier for transport; and so forth. However, once again, substitutes can be identified and indeed are the subjects of considerable RD&D activity around the world.
All this makes the global marginal cost curve postulated by Tol and Yohe implausible. They characterise the marginal cost curve using the form and sug-gest that, if abatement were to rise from 1% to 90%, the technical progress shift term a(t) “has to fall by 85% per year, or 37 orders of magnitude in 45 years… [Alternatively, to] keep marginal costs constant, unit emission reduction costs would have to fall by 51% per year, or 15 orders of magnitude in 45 years.” What a distortion of what we did! Costs in any case decline endogenously with invest-ment, not exogenously, and the more we abate pollution, the more this should help to stimulate innovation and reduce costs. It is necessary to incorporate the costs of the low polluting technologies using a learning curve of the form C= k·
X–bfor each technology, where Xis cumulative investment andRis functionally
related to the aggregate of Xand, of course, to the fuel prices for, and the costs of, the marker technologies, which also change over time with technical progress (see Table 2).17As a matter of interest, the average effects of learning and scale
economies in the analysis turned out to be about a 12% reduction in costs for each doubling of cumulative investment, and the average rate of decline of costs, for the stabilisation trajectory, amounted to about 3% per year, quite modest by his-torical standards for the energy industry.
When we start to disaggregate the analysis, the picture is of course more com-plicated. We have already mentioned that some technologies will run into con-straints and will require the development of new (often more costly) substitutes. So it is quite possible for costs to fall initially as the ‘easier’ options are taken up first, only to rise again as constraints and difficulties are encountered, and in turn fall again as these are addressed, and perhaps rise again as more problems are encountered at higher levels of abatement. Progress will be uneven. We have already mentioned the issue of land in the case of biomass and storage in the case of intermittent renewable energy technologies at high levels of abatement; but, once again, options are emerging and can be developed.
17Let us emphasise, to avoid further misunderstandings, that this function is itself a simplification, and that the
learning coefficient bdiffers between technologies, something we allowed for in the analysis, as can be seen from Table 2 attached and Boxes 9.3 and 9.4 in the Review. Chapters 8, 9, 10 and 16 provide a full review of the literature.
Furthermore, costs will differ between countries. The solar resource is much more abundant in the US for example, and over most of the developing world, and is most available when energy is most in demand, in contrast to countries in the northern latitudes; and it is in solar technologies where the expected rates of innovation are highest. In the UK, sites are more limited for onshore wind, which is already forcing the country to locate its wind farms offshore, which of course raises costs. Some regions will find cost curves decline steeply, while others may face rising costs. Nevertheless, there is no evidence from an engineering per-spective to expect the costs of climate change mitigation to be prohibitive.
Are the cost estimates in the Review biased? If so, the answer is not to be found in the speculations of Tol and Yohe, but in our assumptions, such as Table 2. Is the Review optimistic about nuclear power, offshore wind, solar energy, the fuel cell, hydrogen, combined heat and power or biofuels? Is it pessimistic on oil and gas prices such that it underestimates the cost differentials between the low-carbon options and the marker technologies? Has sufficient allowance been made for cost uncertainties and cost escalation? We looked at many studies and had the views of industry and organisations actually investing in these areas, and of course we were aware of the propensity of many studies (by the proponents of nuclear power in particular) to ‘perfume’ their analyses, a matter that worried us greatly. The estimates used for the Review were certainly not at the optimistic end of the distributions of the available evidence.
Are the portfolios chosen biased toward the easier, low-cost options? In fact we put in wide distributions of possibilities for each option based on an analysis of its technical and economic feasibility and the constraints it might face. The dis-tributions are not out of line with those used in other studies cited, such as those reported by the Energy Modelling Forum. In fact, we included a more aggressive development of the more expensive hydrogen option (electrolytic hydrogen as well as hydrogen generated by coal gasification) in anticipation of the need for a major effort to address emissions from transport. Figure 9.4 (Stern, 2007, p. 259) showed a typical portfolio; it was one of 20,000 “trials” undertaken in the Monte Carlo analysis. The contributions of the various primary energy forms shown in that figure included their possible future use for the production of hydrogen for the energy markets.
One reason for considering a probabilistic-portfolio approach was that this would be consistent with minimising the risks of policy failure. Another was that evidence on relative costs was far too uncertain for a deterministic approach based on cost optimisation models with perfect foresight. These models are not with-out their merits, of course, but the range of possibilities is such that they too have to be run many times under alternative assumptions to build up a picture of pos-sibilities. If anything, the results for the Review span a wider range of possibilities —and a wider range of costs—than these models, as we have discussed before.
Table 2: Relative costs of selected low carbon supply options
Cost of Net cost, Marker Cost Cost of Low Carbon as % Low Carbon Technology Technology unit Marker Technology Marker
Near-term estimates (about 5–10 years):
Electricity Markets
Electricity from gas with CCS NGCC or coal p/kWh 2.6 4.8 85 Electricity from coal with CCS NGCC or coal p/kWh 2.6 4.3 65 Nuclear power NGCC or coal p/kWh 2.6 3.9 49 Electricity from energy crops NGCC or coal p/kWh 2.6 6.3 143 Electricity from organic wastes NGCC or coal p/kWh 2.6 6.9 167 Onshore wind NGCC or coal p/kWh 2.6 4.7 82 Offshore wind NGCC or coal p/kWh 2.6 6.8 164 Solar thermal (v, sunny regions) NGCC or coal p/kWh 2.6 11.7 353 PV for distributed generation (sunny regions) Grid electricity p/kWh 7.9 18.0 127 dCHP using H from NG or coal with CCS Grid electricity p/kWh 7.9 20.6 160
Gas Markets
Hydrogen from NG or coal (CCS)—industry NG £/GJ 4.0 7.7 93 Hydrogen from NG or coal (CCS)—distributed NG £/GJ 6.0 15.5 158 Electrolytic hydrogen—industry NG £/GJ 4.0 19.7 392 Electrolytic hydrogen—distributed NG £/GJ 6.0 27.1 352 Biomass for heat—distributed NG £/GJ 6.0 9.4 57
Transport Markets
Bioethanol Petrol p/ltr 29.5 28.4 –4 Biodiesel Diesel p/ltr 29.5 47.3 61 Hydrogen ICE vehicle—fossil H (+ CCS) Petrol p/lt. equiv 29.5 54.2 84
Long-term estimates (over 20 years):
Electricity Markets
Electricity from gas with CCS NGCC or coal p/kWh 2.1 4.5 113 Electricity from coal with CCS NGCC or coal p/kWh 2.1 3.8 79 Nuclear power NGCC or coal p/kWh 2.1 3.5 67 Electricity from energy crops NGCC or coal p/kWh 2.1 4.8 129 Electricity from organic wastes NGCC or coal p/kWh 2.1 4.1 98 Onshore wind NGCC or coal p/kWh 2.1 2.8 32 Offshore wind NGCC or coal p/kWh 2.1 4.5 114 Solar thermal (v, sunny regions) NGCC or coal p/kWh 2.1 8.8 319 PV for distributed generation (sunny regions) Grid electricity p/kWh 7.9 9.0 13 dCHP—H from NG or coal with CCS Grid electricity p/kWh 7.9 7.6 –4
Gas Markets
Hydrogen from NG or coal (CCS)—industry NG £/GJ 4.00 6.3 58 Hydrogen from NG or coal (CCS)—distributed NG £/GJ 6.00 13.1 119 Electrolytic hydrogen—industry NG £/GJ 4.00 14.1 253 Electrolytic hydrogen—distributed NG £/GJ 6.00 20.5 242 Biomass for heat—distributed NG £/GJ 6.00 9.4 57
Transport Markets
Bioethanol Petrol p/ltr 29.5 30.8 4 Biodiesel Diesel p/ltr 29.5 45.1 53 FC Hydrogen vehicle—fossil H (+ CCS) Petrol p/lt. equiv 29.5 21.6 –27 FC Hydrogen vehicle—electrolytic H Petrol p/lt. equiv 29.5 71.7 143
Notes: dCHP refers to decentralized forms of heat and power, H to hydrogen, CCS to carbon capture and storage, PVs to photovoltaics. The costs of hydrogen shown here refer to the costs of supply. In the analysis of hydrogen and fuel cells for use in vehicles, the costs to the vehicles are included in the full analysis of the costs of mitigation. (See Anderson, 2006.)
Table 3: Effects of price incentive of £250 and £150/tonC on relative costs
Cost of Net cost, Marker Cost of % Marker Marker Cost Cost of + Price Low Carbon (incl. car-Low Carbon Technology Technology unit Marker incentive Technology bon price)
Medium-term estimates (10 years), £250/tonC carbon price: Electricity Markets
Electricity from gas with CCS NG or coal p/kWh 2.6 6.2 4.8 –23 Electricity from coal with CCS NG or coal p/kWh 2.6 6.2 4.3 –31 Nuclear power NG or coal p/kWh 2.6 6.2 3.9 –37 Electricity from energy crops NG or coal p/kWh 2.6 6.2 6.3 2 Electricity from organic wastes NG or coal p/kWh 2.6 6.2 6.9 12 Onshore wind NG or coal p/kWh 2.6 6.2 4.7 –24 Offshore wind NG or coal p/kWh 2.6 6.2 6.8 11 Solar thermal (v, sunny regions) NG or coal p/kWh 2.6 6.2 11.7 90 PV: distributed generation (sunny regions) Grid electricity p/kWh 7.9 10.7 18.0 69 dCHP: H from NG or coal + CCS Grid electricity p/kWh 7.9 10.7 20.6 93
Gas Markets
Hydrogen: NG or coal + CCS—industry NG £/GJ 4.0 7.6 7.7 1 Hydrogen: NG or coal + CCS—distributed NG £/GJ 6.0 9.6 4.2 –56 Electrolytic hydrogen—industry NG £/GJ 4.0 7.6 19.7 159 Electrolytic hydrogen—distributed NG £/GJ 6.0 9.6 27.1 182 Biomass for heat—distributed NG £/GJ 6.0 9.6 9.4 –2
Transport Markets
Bioethanol Petrol p/litre 29.5 75.5 28.4 –62 Biodiesel Diesel p/litre 29.5 75.5 47.3 –37 Hydrogen ICE vehicle—fossil H + CCS Petrol p/litre 29.5 75.5 54.2 –28 Longer-term estimates (20 years), £150/tonC carbon price:
Electricity Markets
Electricity from gas with CCS NG or coal p/kWh 2.1 5.6 4.5 –20 Electricity from coal with CCS NG or coal p/kWh 2.1 5.6 3.8 –33 Nuclear power NG or coal p/kWh 2.1 5.6 3.5 –37 Electricity from energy crops NG or coal p/kWh 2.1 5.6 4.8 –14 Electricity from organic wastes NG or coal p/kWh 2.1 5.6 4.1 –26 Onshore wind NG or coal p/kWh 2.1 5.6 3.3 –41 Offshore wind NG or coal p/kWh 2.1 5.6 4.5 –20 Solar thermal (v, sunny regions) NG or coal p/kWh 2.1 5.6 8.8 57 PV: distributed generation (sunny regions) Grid electricity p/kWh 7.9 10.7 9.0 –15 dCHP—H from NG or coal with CCS Grid electricity p/kWh 7.9 10.7 7.6 –29
Gas Markets
Hydrogen: NG or coal + CCS—industry NG £/GJ 4.0 7.61 6.3 –17 Hydrogen: NG or coal + CCS—distributed NG £/GJ 6.0 9.61 13.1 37 Electrolytic hydrogen—industry NG £/GJ 4.0 7.61 14.1 86 Electrolytic hydrogen—distributed NG £/GJ 6.0 9.61 20.5 113 Biomass for heat—distributed NG £/GJ 6.0 9.61 6.5 –32
Transport Markets
Bioethanol Petrol p/litre 29.5 57.1 31 –46 Biodiesel Diesel p/litre 29.5 57.1 45 –21 FC Hydrogen vehicle—fossil H + CCS Petrol p/litre 29.5 57.1 22 –62 FC Hydrogen vehicle—electrolytic H Petrol p/litre 29.5 57.1 72 26
References
Anderson, D. (2006). Costs and finance of carbon abatement in the energy sector. Paper prepared for the Stern Review.
Anderson, D. (2007). The Stern Review and the costs of climate change mitigation: a response to the ‘dual critique’ and the misrepresentations of Tol and Yohe. World Economics8(1): 211–219.
Beckerman, W. and C. Hepburn (2007). Ethics of the discount rate in the Stern Review on the Economics of Climate Change. World Economics8(1): 187–210.
Carter, R. M., C. R. De Freitas, I. M. Goklany, D. Holland and R. S. Lindzen (2007). Climate science and the Stern Review. World Economics8(2): 161–182.
Dasgupta, P. (2006). Comments on the Stern Review’s Economics of Climate Change. University of Cambridge.
Dasgupta, P. (2007). Discounting climate change. University of Cambridge. Dietz, S., C. Hope, N. Stern and D. Zenghelis (2007). Reflections on the Stern Review (1): A robust case for strong action to reduce the risks of climate change.
World Economics8(1): 121–168.
Dietz, S., C. Hope and N. Patmore (Forthcoming). Some economics of ‘dangerous’ climate change: reflections on the Stern Review. Global Environmental Change. Guesnerie, R. (2004). Calcul economique et developpement durable. Revue Economique55(3): 363–382.
Henderson, D. (2007). Governments and climate change issues: the case for rethinking. World Economics8(2): 183–228.
Hepburn, C. J. (2006). Discounting Climate Change Damages: Working Note for the Stern Review.
HM Treasury (2003). The Green Book: Appraisal and Evaluation in Central Government: Treasury Guidance. London, Stationery Office.
Hoel, M. and T. Sterner (2006). Discounting and relative prices in assessing future environmental damages. Working Papers in Economics 199. Goteborg, Goteborg University, Department of Economics.
Hope, C. (2006). The marginal impact of CO2from PAGE2002: an integrated assessment model incorporating the IPCC’s five reasons for concern. Integrated Assessment6(1): 19–56.