Economic growth,
poverty and
children
Alberto Minujin, Jan Vandemoortele and
Enrique Delamonica
SUMMARY:This paper discusses the different dimensions of poverty, with a particular focus on non-monetary aspects, and describes the limitations and inac-curacies inherent in the US$ 1 a day poverty line now widely used in cross-country comparisons. It highlights how little attention is given to the aspects of poverty that most affect children and explains why addressing these issues is an effective approach to poverty reduction. The authors discuss why economic growth during the 1990s failed to produce the hoped-for decline in the incidence of poverty in most nations and report, for example, on the existence of disparities as well as on the advantages of extending provision of basic services to all. Whilst on the one hand, economic growth has not necessarily reduced the incidence of (monetary and non-monetary) poverty, on the other, reductions in poverty havebeen achieved in some cases without waiting for economic growth. Countries with comparable per capita incomes, for instance, can show considerable variation in under-five mortal-ity rates.
I. INTRODUCTION
ALTHOUGH THE WORLD economy had a strong recovery during the 1990s, compared to the 1980s, this did not lead to a noticeable decrease in the number of poor people – measured in “poverty line” terms. Also, the impact of the recovery appears to have been minimal in terms of the inci-dence of poverty in most low- and middle-income nations.(1)Together with
other factors, this has led to the prioritization of poverty reduction issues in international, national and regional agendas. The concept of “poverty” as going beyond the issue of insufficient income has also been increasingly accepted. Other elements, such as life expectancy, access to education, and social and political participation must be taken into account when discussing poverty.
It is in this context that concern about child poverty should be placed. Its reduction should be a priority given its economic and social conse-quences. Unfortunately, most of the programmes oriented to poverty reduction mainly address the adult population.
Usually, a single concept of poverty is used that makes explicit or implicit reference to both adults and children. This is evident in cases where child poverty is calculated from the number of children that live in poor homes.(2)From a methodological point of view, this is sensible, given
the difficulties in measuring poverty. Nevertheless, measuring child
Alberto Minujin is senior project officer in the Division of Policy and Planning at UNICEF Headquarters (New York), working on social policy, poverty and human rights issues. He was formerly UNICEF’s regional adviser for Social Policy,
Monitoring and Evaluation for Latin America and the Caribbean, and programme coordinator of
UNICEF–Argentina. He was deputy director of the National Statistical Office of Argentina and professor of postgraduate studies of the School of Social Sciences, University of Buenos Aires. He has published several books, including Globalization and Human Rights
(Editorial Santillana,
Colombia) and The New
Poor(Editorial Planeta, Argentina) as well as numerous articles and papers.
Address: UNICEF, 3 UN Plaza, New York, NY 100017, USA; e-mail: aminujin@unicef.org Jan Vandemoortele is the principal adviser and group leader, Socioeconomic Development, at the United Nations Development Programme in New York. Previously, he was the head of Policy Analysis at UNICEF, New York. Between 1991 and 1994, he served with UNDP as senior economist in
poverty only in terms of households with below poverty line incomes is not clear in conceptual terms nor in relation to policy planning oriented to poverty reduction.
The main objective of this paper is the discussion of the multiple dimen-sions of poverty and the consideration of elements for its reduction that go beyond economic growth issues. In particular, we discuss matters relat-ing to the distribution of basic goods and services, we highlight the impor-tance of child poverty problems and we point to a series of issues relating to inequalities in well-being and their connections to the distribution of income and goods. Finally, we present some alternative policies, drawn from international experiences.
The human rights framework – particularly economic and social rights – underlies this paper, although it is explicitly mentioned only with regard to children.(3)
In the first part, diverse dimensions of poverty and their relation to economic growth are analyzed. For this purpose, we used available infor-mation for different countries around the world and inforinfor-mation disag-gregated by region. Some of the problems linked to poverty measurement using income are discussed also.
This is followed by a consideration of conceptual questions regarding child poverty, which allows its treatment either independently of adult populations or as a complement to the general discussion of poverty. This includes determining the non-monetary dimensions that are exclusively related to children. This section finishes with two quantitative analyses. The first presents cross-country comparisons for around 40 low- and middle-income countries, regarding wealth distribution among families and the non-monetary levels of child poverty. The second analysis covers a smaller number of countries and presents inequalities among families with different incomes in relation to access to the public services that help reduce non-monetary poverty.
The next part of the paper discusses issues of public expenditure as a means of reducing poverty. Even when economic growth is absent or limited, the achievements of some countries in terms of social develop-ment under these conditions are worth develop-mentioning. Although experiences between nations differ in economic terms and according to the monetary and non-monetary dimensions of poverty, they allow the presentation of some interesting policy conclusions.
II. ECONOMIC GROWTH AND POVERTY
a. Economic growth and monetary poverty
ALONG WITH THE international UN summits of the 1990s, some of which focus on particular sectors (education, food availability) and some that are cross-cutting (children, women), there is an increasing preoccu-pation with accelerating the improvement of life quality in low- and middle-income nations. For various reasons, the expression “reduction of poverty” is used to describe these themes. Moreover, the high-income nations that provide most of the funds for international development assis-tance have established concrete objectives explicitly related to poverty. For both the United Nations and the World Bank, and even for the Interna-tional Monetary Fund, poverty reduction is one of the central objectives.
A Better World for All, a joint document between the United Nations, the
1. World Bank (2000), World Development Report: Attacking Poverty,
Washington DC; also Chen, S and M Ravallion (2000), “How did the world’s poorest fare in the 1990s?” World Bank Working Paper No 2409.
2. Deaton, A and C Paxson (1997), “Children in poverty”, mimeo, Princeton University.
3. In order to centre the work on poverty issues, it was decided not to expand the discussion about human rights in this paper. Among other sources, we suggest: Bustelo, E and A Minujin (editors) (1998), Todos entran. Propuesta para
Malawi/Zambia and with the Regional Bureau for Africa and, prior to that, he worked for the ILO, mostly in Africa. His work has focused on labour market policies, public finance, income distribution, poverty reduction and social policy. He has published numerous articles, reports and chapters in books. Address: UNDP, 1 UN Plaza, New York, NY 100017, USA; e-mail: an.vandemoortele@ undp.org
Enrique Delamonica is a policy analyst in the Division of Policy and Planning at UNICEF, where he has been working on financing of social services, poverty reduction, socioeconomic disparities and the impact of macroeconomic trends on child welfare for the last eight years. He also teaches economics at the School of Professional Studies of New York University. Address: UNICEF, 3 UN Plaza, New York, NY 100017, USA; e-mail: edelamonica@unicef.org This was translated from Spanish by Alfredo Gutierrez.
International Monetary Fund, the Organization for Economic Cooperation and Development and the World Bank, and dedicated to the analysis of progress in international development, states:
“Poverty, in all its forms, constitutes a challenge for the international commu-nity... The objectives to achieve aims of development comprise some of the various dimensions of poverty and its effects in the life of the population. By accepting these objectives, the international community commits itself to the poorest and the most vulnerable ones.”(4)
The same call was made at the Millennium Summit, from which the Millennium Development Goals (MDGs) emerged. These MDGs set targets and indicators regarding progress to be made during the next decade-and-a-half on fundamental dimensions of poverty.
Defining objectives related to poverty reduction generates a conceptual dilemma masked beneath “a measurement problem”. Some argue that poverty is a broad concept that includes the level of access to elements for which there may be no markets, and to aspects of life quality that are diffi-cult or impossible to quantify. Others interpret poverty more narrowly, but as easily quantifiable in monetary terms (measured in income or, prefer-ably, consumption). For this second group, even if poverty were concep-tually multidimensional, the monetary variable would be the best and most representative way to measure it. Thus, the discussion shifts from the conceptual (what is poverty?) to the search for ways to measure poverty, now understood as an income (or consumption) problem. This kind of measurement has to be adopted to calculate international development. The agreed target for poverty reduction adopted in the MDGs refers to a reduction of monetary poverty by 2015.
The poverty line of US$ 1 per day is usually considered the international line for measuring and comparing the incidence of poverty in low- and middle-income nations. This line is based on studies in the 1980s in ten low-income countries, including Bangladesh, India, Kenya and Tanzania. The price of a minimal “basket of necessities” was around US$ 1 per day per person at 1985 purchasing power.(5)Using this measure, 1.2 billion persons
(around one-quarter of the world’s population) are estimated to live below the poverty line.(6)In southern Asia and sub-Saharan Africa, this
propor-tion is, respectively, 40 and above 40 per cent; in northern Africa and the Middle East it is less than 2 per cent; in Latin America, around 5 per cent.
But the main question remains unanswered. Does the “US$ 1 per day” concept calculate the incidence of poverty or the number of people who struggle to live with less than one dollar daily? In most countries, these two are not necessarily equivalent. In fact, the “US$ 1 per day” parameter violates the standard definition of poverty which regards as poor all those who do not reach minimal acceptable living conditions. The level of income required to purchase this minimum basket of goods (even if one considers only the food to obtain a minimum amount of calories) increases as average per capita income increases. As a result, the poverty line cannot remain static and cannot be the same for countries of different income levels, even if the intent is to measure a minimum, absolute level of poverty. The relevance of a line fixed at US$ 1 per day is gradually eroded by economic growth and it is not even useful at a point in time to compare (or aggregate) the incidence of poverty across countries. Table 1 shows the huge discrepancies, underestimating and overestimating the incidence of poverty when using the US$ 1 a day line or a national poverty line based on the ability to purchase a minimum set of commodities.
In other words, the internationally accepted line of US$ 1 per day allows
sociedades incluyentes, Santillana SA, Bogota; also Santos País, Marta (1999), “A human rights conceptual framework for UNICEF”, Innocenti Essays No 9, UNICEF, Florence; Hewitt, E and A Minujin (editors) (1999), Rights@Gob.net. Globalization and Human Rights, UNRISD and UNICEF; and Wronka, J (1992), Human Rights and Social Policy in the 21st Century, University Press of America, Langham, Maryland.
4. See United Nations, the International Monetary Fund, the Organization for Economic Cooperation and Development and the World Bank (2000), A Better World for All, presented at the monitoring meeting of the World Summit for Social Development, Geneva. The document analyzes the situation, taking into account the seven objectives for 2015, agreed by the OECD on the basis of the objectives defined at the world summits of the United Nations during the 1990s. For more information: www.oecd.org/dac/ indicators
5. This was first done for the World Development Report: Poverty, World Bank (1990), Washington DC. This value was later recalculated for the PPP of 1993 and the poverty line was modified. In sub-Saharan Africa in 1993, the incidence of poverty was estimated at 39 per cent using the old line but at 50 per cent using the new one. For Latin America, in 1993, the incidence was estimated at 24 per cent using 1985 data but at 16 per cent using 1993 recalculations. 6. World Bank web page (2002), visited on 12 September 2002: http://www.worldbank. org/poverty/data/trends/ income.html
a comparison among countries where people struggle to live with that budget, but it is unclear whether the line is useful for comparing poverty levels between countries. In order to obtain an internationally comparable measure, an instrument (or procedure) was found, but it measures some-thing different from poverty. That is why poverty incidence measured with national parameters can be either higher or lower than the internationally determined US$ 1 a day one (Figure 1). For example, at higher income levels, poverty incidence measured with the international line is always lower than if using national parameters.(7)In reality, the proportion of
population that tries to survive on US$ 1 (or US$ 2) a day is simply a reflec-tion of nareflec-tional income per capita – that is, the income per capita adjusted by income distribution – not of poverty.(8)
Poverty estimates using the US$ 1 per day poverty line not only under-estimate poverty incidence but also reinforce the perception that economic growth is the only way to reduce poverty. This is due to an incorrect infer-ence from cross-country analyses. Given the correlation between income levels per capita and poverty incidence measured with the US$ 1 per day line, it is tautological to state that economic growth (in the absence of distributive changes) is the route to poverty reduction.
Estimations of this kind usually assume that income distribution remains constant, based on a weak association between economic growth and equity changes. However, the study most often cited in this regard states:
“…periods of aggregate growth were associated with an increase in inequality almost as often (43 cases) as with a decrease in inequality. Similarly, periods of economic decline were associated with increased inequality in five cases and with a more equitable distribution of income in two cases”.(9)
Paradoxically, the same result was obtained in a recent work that intended to show the opposite, which argued that “...economic growth always favours the poor.”(10)With no information on poverty evolution for
most countries, Dollar and Kraay used population incomes for the lowest quintile in their regressions. Since poverty incidence could vary from 1 per cent (Algeria 1988, international poverty line measurement) to 80 per cent or more (Zambia 1993, national and international poverty line measure-ments),(11)it is clear that to consider the average income of the lowest
quin-tile is not useful in assessing the relationship between economic growth and poverty incidence.
7. National and international incidence regressions against the Gross Domestic Product (GDP) per capita show that, as the “US$ 1 per day” poverty line appears to show a significant negative correlation between poverty levels and income levels (17 observations, R2 at 0.45 and a slope whose statistical “t” is 3.7), there does not seem to be correlation when national lines are used (17
observations, R2 at 0.18 and a slope whose statistical “t” is 1.8).
8. At a global level (and based on the partial information available), it seems that overestimation in the relatively poor countries is compensated by underestimation in the richer countries, if China and India are included. Since these two countries (particularly China) have fewer poor people, using the national poverty line, the international line underestimates the incidence of poverty in the rest of the developing countries. It is important to mention that the
implications for international aid and lending and the geographical poverty distribution vary considerably when using different measurement systems.
9. Deininger, K and L Squire (1996), “A new data set measuring income inequality”, The World Bank Economic ReviewVol 10, No 3, page 587. The authors hint at the possibility that many of these changes may not be statistically significant, but they do not report any test results. 10. Dollar, D and A Kraay (2000), “Growth is good for the poor”, mimeo, World Bank, Washington DC. 11. Data obtained from the World Bank (1997), World Development Report, Washington DC. SOURCE: World Bank (2001), World Development Report 2000/2001: Attacking Poverty, Oxford
University Press, Oxford and New York, 355 pages.
Nation Year
Population under national poverty line (%)
Population under US$ 1 a day poverty line (%)
Algeria 1995 22.6 Less than 2 Azerbaijan 1995 68.1 Less than 2
China 1998 4.6 18.5
Egypt 1995 22.9 3.1
Indonesia 1999 27.1 7.7 Sri Lanka 1995 25.0 6.6 Trinidad and Tobago 1992 21.0 12.4
Table 1: Discrepancies between the US$ 1 a day poverty line and national poverty lines
As in similar works, variability around regression is high. Half the cases showed that the incomes of the lowest quintile were lower than the national average and, in many cases, they decreased in spite of national growth. In other words, income distribution is not constant through time. The assumption that it does not change does not fit with the available evidence on growing disparity around the world.(12)
Examining trends over time is a better way of assessing the impact of economic growth on the incidence of poverty. The economic growth of recent years has not had an impact on poverty levels in low- and middle-income countries, even using the US$ 1 a day measure. According to recent World Bank estimates, the proportion of people below the poverty line in low- and middle-income countries (excluding China) dropped from 28 per cent in 1987 to 26 per cent in 1998.(13)These figures are within the margin
of error of the estimations.
The number of persons below the poverty line remained constant throughout the 1990s, contrary to expectation. In its 1990 annual report, the World Bank forecast that, if the growth rate of the high-income coun-tries averaged 3 per cent annually, the international interest rate would drop, the price of raw materials would increase and all negotiations of the Uruguay Round of GATT would conclude successfully. Poverty reduction was also foreseen at 2 per cent annually between 1985 and 2000. Beyond the predictable price fluctuations for raw materials, the economic predic-tion was fulfilled. Nevertheless, changes in levels of poverty between 1987 and 1998 have not occurred. Excluding East Asia, poverty has increased at a rate of 12 million persons per year since 1987. This has occurred despite substantial growth in most regions and the strong growth of the interna-tional market of capital flows during the 1990s.(14) For example, the increase
in income per capita in Latin America was around 15 per cent between 12. As shown by Cornia, G
A (1999), “Liberalization, globalization and income distribution”, WIDER Working Paper 157; also Van der Hoeven, R (2000), “Poverty and structural adjustment. Some remarks on trade-offs between equity and growth”, Employment Paper 2000/4, ILO, Geneva.
13. See reference 6.
14. The world economy grew at an average of 5 per cent annually during the 1990s, against 3 per cent in the 1980s. The net private flows towards the developing countries increased from less than US$ 50,000 million in 1990 to US$ 300,000 million in 1997 (see reference 6).
SOURCE: World Bank (1998), World Development Indicators, Washington DC; and CEPAL (1998),
Social Panorama, Santiago de Chile. The year for the data varies between countries; most are for years between 1885 and 1996.
Figure 1: Income per capita and alternative poverty lines Guinea-Bissau Nigeria Honduras PakistanPhilippines China Peru Dom Rep Brazil
Costa RicaPanama Colombia Mexico ThailandVenezuela Malaysia Chile
1990 and 1998; in the words of the former chief economist of the World Bank: “(Latin America) followed our advice and realized the most successful ‘stabilization programme’ of the world.”(15)Nonetheless, the number of people
below the poverty line increased by 6 per cent during that period. Thus, a continuous decade of reforms and economic liberalization has shown scarce results in poverty reduction terms. Latin America is not alone. Similar results can be seen in southern Asia, where per capita income grew by one-third between 1990 and 1998, but the number of poor people grew as well and with little reduction in the incidence of poverty.
As the US$ 1 a day line tends to underestimate poverty incidence in nations with higher per capita income levels, the fact that economic growth has been accompanied by stagnation in poverty incidence can only steer us to one conclusion: there has been a significant income concentration during the 1990s. This proposition is confirmed by recent studies on income distri-bution.(16) In short, the World Bank estimates of poverty reduction lead to
two incorrect conclusions in poverty reduction terms:
• in the last decade, there has been progress in the international fight against poverty; and
• economic growth, based on commercial and financial globalization, is the best strategy to continue to reduce poverty.
These conclusions must be seriously questioned. Not only must we emphasize the limitations of the US$ 1 a day measure as a tool to estimate poverty incidence, but, more importantly, we also have to stress the impor-tance of social equity as the main link between economic growth and poverty reduction.
b. Economic growth and non-monetary poverty
As mentioned above, it is important to recognize the multidimensionality of poverty.(17)Poverty is reflected in lack of access to education, to public
health, to social participation and inclusion. A monetary indicator cannot adequately represent many of these dimensions, in part because they are not necessarily obtained in the market. Even with incomes above the poverty line, families may not access these services and should therefore be considered poor. For instance, if there are no schools or water access in a given region, no level of income would be sufficient to satisfy these basic needs. The problem cannot be solved by adjusting the gross incomes of families to the prices of the public services: the goods and services are simply not there. Hence, basic needs must be directly measured, not through substitute ways or income monetary rates.(18)
Governments and international development agencies carry out poli-cies and programmes against “poverty” of this kind. There is an increas-ing recognition of the central importance of basic social services in the fight against poverty(19)and, for this reason, information on poverty levels
according to income must be supplemented with data on basic need satis-faction, both measurements should be integrated, and information should be disaggregated by age group and sex. Information on early childhood, childhood and adolescence would allow a better perspective on child poverty and its relation with family conditions, and make it possible to plan programmes according to lifecycles.
As these data are not usually available in relation to a given poverty situation, researchers have to accept working with approximations. Of particular importance is child mortality,(20)a variable that either directly or
indirectly represents a good part of the fundamental elements for infant
15. Stiglitz, J (1998), “The Asian crisis and the future of international
architecture”, World Economics Affairs Magazine, from http://www.world bank.org/knowledge/ chiefecon/articles/wea21/ 16. For example, see Milanovic, B (1999), “Is world inequality
increasing?”, mimeo, World Bank, Washington DC; also Cornia (1999), see reference 12.
17. See, among others, Sen, A (1999), Development as Freedom, Alfred A Knopf, New York.
18. A series of works have shown the differences between poverty estimation results obtained from the basic needs method and those obtained from the poverty line method. These works have also given an analytic interpretation to these differences (see Beccaria, L and A Minujin (1985), “Alternative methods for measuring the evolution of poverty” in Proceedings of the 45th Session, invited paper, International Statistics Institute, Amsterdam; also Desai, M (1989),
“Methodological problems in the measurement of poverty (in Latin
America)”, mimeo, London School of Economics and Political Science. 19. See, among others, Dasgupta, P (1993), An Inquiry into Well-being and Destitution, Oxford University Press; also see reference 4 and reference 1. 20. Child mortality is technically understood as being that for children aged between one and four years old, whilst infant mortality is for those under the age of one. However, the variable used here is the mortality of children under the age of five, usually referred to as U5MR, which combines both infant and child mortality. We will use U5MR and child mortality for ease of exposition.
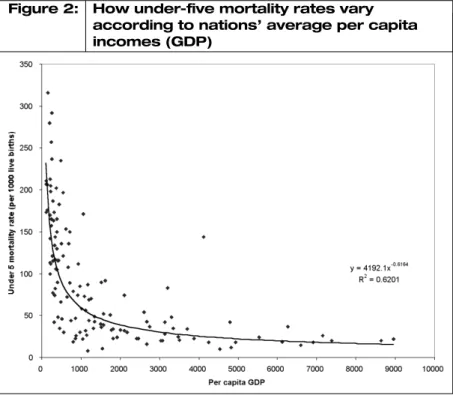
well-being in a nation (including parents’, especially mothers’, education). Both in this context and with regard to income poverty, it is usually argued that economic growth would allow non-monetary poverty reduc-tion. Figure 2 seems to confirm this hypothesis.
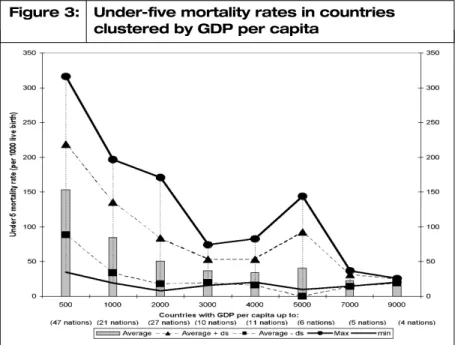
However, it is important to highlight the high variability within each income level. Countries can be divided into groups according to income levels. Figure 3 shows the highest, lowest and average (plus and minus one standard deviation) figures for under-five mortality rates for countries grouped by their average per capita GDP. This shows the great diversity in under-five mortality rates between the best and the worst in most of these groups. In other words, under-five mortality rates vary for countries with similar per capita incomes. But it is also noticeable that the minimum level for each group is not so different, particularly for those above the US$ 1,000 per capita limit. In other words, a relatively low infant mortality can be achieved with low income, and further GDP per capita increases do not result in further improvements in minimum under-five mortality.
This is not the only evidence that questions the relation between non-monetary aspects of poverty and economic growth. In a recent study by the World Bank, the linear correlation between an increase in income and a change in the human development index(21)was estimated for 61
coun-tries. The advantage of this is the decision to take the dynamics of each country independently and thus avoid the problems of cross-country comparison. In this case, correlation was estimated at 0.22, with a signifi-cance level of 0.092, that is, almost nil. Easterly found (in a more elaborated analysis for a group of 81 “quality of life” indicators) that external changes are more important than economic growth in more than three-quarters of the regressions estimated using different methods.(22)
The previously mentioned lack of correlation is also evident in Figure 4. 21. The index used for this
work is not the one presented by UNDP. It is an index formed by infant mortality, literacy and life expectancy rates; World Bank (2000), “The quality of growth”, mimeo,
Washington DC.
22. Easterly, W (1999), “Life during growth”, mimeo, World Bank, Washington DC.
SOURCE: UNICEF (2000), State of the World’s Children, UNICEF, New York. Figure 2: How under-five mortality rates vary
according to nations’ average per capita incomes (GDP)
Considering the reduction in under-five mortality during the 1990s and the economic growth per capita during the period 1970–1995 (to incorpo-rate the delayed effects the economy can have on individuals)(23)for more
than 100 low- and middle-income countries, there is no visible pattern. Under-five mortality rates declined in countries with high, low or even negative economic growth. As expected, under-five mortality also increased in countries with negative economic growth,(24)but it also
increased in certain growing economies (although on a smaller scale). The pace of mortality decrease (average index of annual variation) is not affected by economic growth either. Rather than stating that economic
23. Although not presented in this work, the same lack of correlation is present in several other studies. 24. The correlation between recession and monetary and non-monetary aspects of poverty is discussed below.
SOURCE: UNICEF (2000), State of the World’s Children, UNICEF, New York. Figure 3: Under-five mortality rates in countries
clustered by GDP per capita
SOURCE: UNICEF (2000), State of the World’s Children, UNICEF, New York.
Figure 4: GDP growth per capita (1970–1995) and reduction of under-five mortality (1990–1998) (102 low- and middle-income countries)
growth has no relation with changes in under-five mortality, it would be more accurate to say that there are other highly relevant elements (such as public policies and equity).
Is economic growth necessary, sufficient, indispensable or just useless in reducing poverty in all its aspects? The above-mentioned arguments lead us to believe that economic growth is not enough to reduce income poverty or any other aspect of poverty. In almost half the cases in which there is an increase in GDP per capita, income poverty is constant or increases. This is not to suggest that economic growth is irrelevant to poverty. In the majority of the cases in which GDP per capita falls, income poverty increases.(25)In relation to non-monetary dimensions of poverty, despite
the impacts of recession being not as severe as expected, there is no doubt that they had a negative impact on poverty.(26)But it is also possible to effect
great achievements in quality of life for the majority of the population with low economic growth (a point to which this paper returns in Part IV).
III. CHILDREN AND POVERTY
a. The concept of child poverty
FROM THE PREVIOUS discussion it is evident that poverty is a multidi-mensional phenomenon that affects families and the individuals within them. Poverty reduction policies go beyond purely economic matters, comprising also social affairs, and an ideal policy package to fight poverty would combine both economic and social policies. This is especially impor-tant during macroeconomic adjustment (see Part IV). First, however, it is necessary to study the very concept of child poverty.
From the point of view of poverty defined by monetary income (as seen in Figures 5 and 6), children are over-represented in relation to both the total number of poor people and their age groups. Estimates carried out 25. Ganuza, E and L Taylor
(1998), “Politica
macroeconomica, pobreza y equidad en America Latina y el Caribe” in Ganuza, E, L Taylor and S Morley (editors), Politica
macroeconomica y pobreza en America Latina y el Caribe, Mundi-Prensa, Madrid; also De Janvry, A and E Sadoulet (1995), “Poverty, equity and social welfare”, ILO, Geneva.
26. Jolly, R and Cornia, G A (1984), The Impact of World Recession on Children, Pergamon Press, Oxford; also Cornia, G A, R Jolly and F Stewart (1987), Adjustment With a Human Face, Oxford University Press; Jolly, R (1997), “Profiles in success” in Mehrotra, S and R Jolly (editors), Development With a Human Face, Oxford University Press; and Anand, S and L Chen (1996), “Health implications of economic policies: a framework of analysis”, Discussion Paper No 3, Office of Development Studies, UNDP, New York.
SOURCE: Minujin, Alberto (1999), “Putting children into poverty statistics”, document presented to the Third Meeting of the Expert Group on Poverty Statistics, Lisbon.
using the international poverty line show that around half of the poor population is made up of children.(27)
As mentioned in the introduction, child poverty can be measured rela-tive to monetary income, and conceptually linked to the adult popula-tion.(28)This is represented in Figures 5 and 6 but we must try to go beyond
this approach. It is necessary to question the conceptual framework that allows us to discuss child poverty. This framework can be supported by two basic concepts. The first is the definition of poverty which considers the freedom to choose, capabilities and entitlements. There are different ways of defining poverty in these terms and therefore controversies arise.(29)Amartya Sen’s definition describes poverty as capability
depriva-tion. In this sense, poverty can be seen as the deprivation of basic capabil-ities to develop the lifestyle an individual values. This approach is especially suitable when analyzing children’s problems, for this is where the chain of obstacles begins, usually marked by the lack of freedom to choose and an unequal development of capabilities and opportunities. Amartya Sen states:
“The worst forms of violation in child labour frequently come from the virtual slavery of children in unfortunate families, for they are forced to work under exploita-tive conditions (which are opposite to freedom and the right to education).”(30)
The second basic concept comes from the international Convention on the Rights of the Child (CRC). This Convention gives children the status of subject of rights, going beyond a situation where they depend on parents, family or state for such rights. The Convention validates a whole set of rights regarding elements that make up child poverty.(31)
In the context of the Universal Declaration of Human Rights, the General Assembly of the United Nations adopted the CRC in 1989. The main mandate of the CRC is to guarantee the rights of children and adoles-cents to an integrated development. These rights are integral and
indivis-27. In truth, this result is based on general estimations as there is no quantitative information on infant poverty. This fact is an additional indicator of the little relevance that is given to this issue; see Minujin, Alberto (1999), “Putting children into poverty statistics”, document presented to the Third Meeting of the Expert Group on Poverty Statistics, Lisbon.
28. Moreover, in the definition of poverty line, adult equivalent coefficients that are inferior to 1.00 are used for child populations. This could be adequate for food consumption but not for other matters such as education.
29. Atkinson, A B (1970), Poverty in Britain and the Reform of Social Security, Cambridge University Press; also Townsend, Peter (1979), Poverty in the United Kingdom, Penguin, Harmondsworth; and Sen, A (1981), Poverty and Famines, Clarendon Press, Oxford.
30. See reference 17. 31. For more information, see reference 3, Santos País (1999); also UNICEF (2000), Poverty Reduction Begins with Children; and Division of Evaluation, Planning and Policy, UNICEF (1998), Indicators for Global Monitoring of Child's Rights, International Meeting Report, Geneva. SOURCE: Minujin, Alberto (1999), “Putting children into poverty statistics”, document presented to
the Third Meeting of the Expert Group on Poverty Statistics, Lisbon.
Figure 6: Poor children are over-represented in relation to their age group
ible, and make up a unique political, legal and programmatic framework. The state, community, family and individuals share responsibility for protecting and promoting the rights of children. All the rights are univer-sal and valid for every child. It goes without saying that special attention must be paid to those with social disadvantages.
The Convention is ruled by four basic principles:
• the views of the child, which entails the citizenship of children and adolescents as individuals with political, civil and social rights; • the best interests of the child;
• the right to life, survival and development; and
• the principle of non-discrimination that implies that any negation due to race, gender, nationality or ethnic group is unacceptable.
The larger-interest principle is an additional element that considers the problems of child poverty reduction as a priority within poverty reduc-tion, and which requires specific actions.
So far, the Convention has been ratified by all countries of the world save two (the United States of America and Somalia); once a country has ratified the Convention, it has the status of law. The Convention is a common reference point for monitoring progress in nations.
Some articles of the Convention are particularly important regarding poverty. For instance, Articles 3, 24 and 28 guarantee the right of any child to health and education. In the case of education, Article 28 states:
“The Member States acknowledge the right of children to education and, in order to exert it progressively and in equal opportunity conditions, they must: • implement obligatory and free primary education for everyone; and • encourage development of secondary education in its different forms.”
Other aspects relating to participation, not usually taken into account when discussing poverty, should not be neglected. Numerous studies have shown that participation facilitates integration into economic and social development. Articles 12, 13 and 15 validate the right of children to express themselves freely, be listened to by adults and to participate.
b. Equality in the right to access distribution, health and basic education
Each year, 11 million children under the age of five die as a result of preventable or easily treatable diseases and most of them belong to poor households. This may be the greatest contemporary tragedy for humanity and a negation of the rights which we accept almost unconsciously. For many of those who survive, their lives are full of difficulties, occasionally condemning them to perpetual poverty. Universal access to basic health services and quality education is not only a fundamental right but also one of the better paths towards poverty reduction and economic and social development.
Reductions in mortality rates for infants and children under five and primary education are the usual targets at national and international levels, and many successful cases have been reported. But in most cases, these reports are based on results for the average of the child population and it is important to look at equity and rights distribution, that is, to analyze whether efficient poverty reduction is taking place.(32)
In income distribution terms, results can be achieved through “trickle-down” (commencing from the high-income groups) or the other way round (focusing on low-income groups). Similar average change can be obtained in both cases, but only in the second can poverty reduction be achieved.(33)
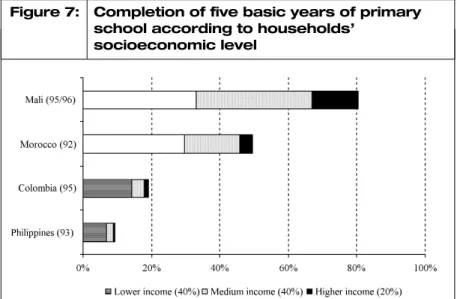
32. The comparison between Mali and Morocco in Figure 7 is illustrative of the limits of using national averages. Although the proportion of children not finishing primary school is 80 per cent in Mali and 50 per cent in Morocco, the proportion among the poorest families (the two bottom quintiles) is the same in both countries. Based on average readings, Morocco appears to be in better condition than Mali but the average result hides the fact that poor people are in the same situation in both countries. Too much attention on national averages can lead to errors and misconceptions, particularly with regard to life conditions of the poorest (Minujin, A and E Delamonica (2001), “Mind the gap!”, UNICEF mimeo). 33. Gwatkin, D (1999), “Will the poor benefit from achievement of the OECD 2015 infant and child mortality goals?”, mimeo, World Bank, Washington DC.
34. Filmer, D and L Pritchett (1998), “Estimating wealth effects without expenditure data or tears: an application to educational enrolments in states of India”, Policy Research Working Paper No 1994, World Bank, Washington DC.
35. Vandemoortele, J (2000), “Avoiding social shocks, protecting children and reducing poverty”, UNICEF Staff Working Papers, Evaluation Policy and Planning Series No EPP-00-001, New York. It is rare to find information on income levels and on social indicator
distribution together, but there are some examples and these confirm that social inequity is often accompanied by distributive inequity. Despite the relative lack of information, there is an alternative that allows us to explore this relation and draw some conclusions relating to the right to basic serv-ices. This analysis is based on a method introduced by Filmer and Pritch-ett,(34)which considers various categories of tangible assets such as bicycles
or types of materials used for building a property. These elements allow the categorization of families relative to their assets and make it possible to obtain a set of social indicators that relate to family group wealth. On the same basis, an analysis of basic education and mortality in children under the age of five is presented. In the first case, we follow arguments devel-oped by Vandemoortele.(35)With regard to education, the analysis is based
on the proportion of children who complete the fifth year of basic primary education. Figure 7 shows that, as school attendance increases (as in Colombia and the Philippines), the poor seem to be the last to gain the benefits. For instance, in Mali, most children of the poorest 40 per cent of families do not finish their basic education. This proportion is even higher in Morocco (60 per cent), increasing to 70 per cent in Colombia and 75 per cent in the Philippines. This type of comparison leads to the hypothesis that the “non-poor” are the first to benefit from the expansion of basic social services, whereas the poor have to “queue”.
In order to test the validity of this hypothesis, trends over time are needed, but they are only available for a small number of countries. Figure 8 shows that, in Bangladesh, it is largely the increase in the number of children from the middle 40 per cent of the population who complete fifth grade that accounts for the increase in the proportion of children completing fifth grade between 1994 and 1997. In Peru, where school attendance decreased during the 1990s, the majority of the reduction was due to the worsening situation of the poor population, whereas the non-poor have not been affected.
There could be various reasons why children of the poorest families are over-represented in the “queue” to gain access to schooling, as countries SOURCE: Vandemoortele, J (2000), “Avoiding social shocks, protecting children and reducing poverty”, UNICEF Staff Working Papers, Evaluation Policy and Planning Series No EPP-00-001, New York.
Figure 7: Completion of five basic years of primary school according to households’
36. This is proved, among others, by Lanjow and Ravallion in a study in India. When programmes aimed to reach most of the population, the poor benefited least and, with reduced programmes, the poor were the first to be excluded (Lanjow, P and M Ravallion (1998), “Benefit incidence and the timing of programme capture”, mimeo, World Bank, Washington DC.
get closer to universal schooling. It may be that once a family has escaped from poverty, they can afford to send their children to school for a longer period. It could also be that in a process of social change, the poorest groups are the last to acquire behaviours considered “modern” or typical of the “middle class of wealthy countries”. Alternatively, economic allowances may reflect power structures in which the poorest are the last to benefit.(36)
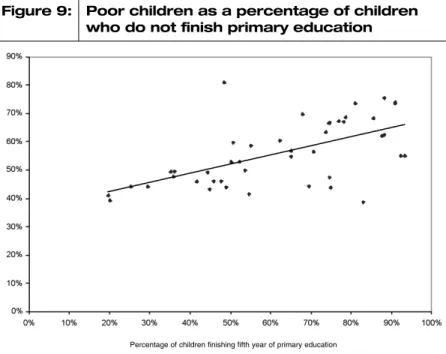
Using information from 44 countries, Figure 9 shows an increase in the relative weight of children from the lowest 40 per cent wealth distribution group among those who do not complete their basic education when the SOURCE: Vandemoortele, J (2000), “Avoiding social shocks, protecting children and reducing poverty”, UNICEF Staff Working Papers, Evaluation Policy and Planning Series No EPP-00-001, New York.
Figure 8: Changes in the profile of children who completed the basic five-year education
SOURCE: Vandemoortele, J (2000), “Avoiding social shocks, protecting children and reducing poverty”, UNICEF Staff Working Papers, Evaluation Policy and Planning Series No EPP-00-001, New York.
Figure 9: Poor children as a percentage of children who do not finish primary education
average rate for school attendance increases.(37)This indirect evidence
seems to confirm that the poorest are at the end of the “queue”, and that the last children to gain a basic education will almost certainly be from poor families.
Using a different database, it is clear that these disparities with regard to primary school completion are particularly strong in Latin America, despite achievements in primary school provision in the region. Data for 12 countries representing 75 per cent of Latin America’s total population proved that, on average, 60 per cent of children in the lowest 10 per cent income group do not complete primary education. This proportion decreases to one-third in the middle deciles and reaches 10 per cent in the top decile (Figure 10).
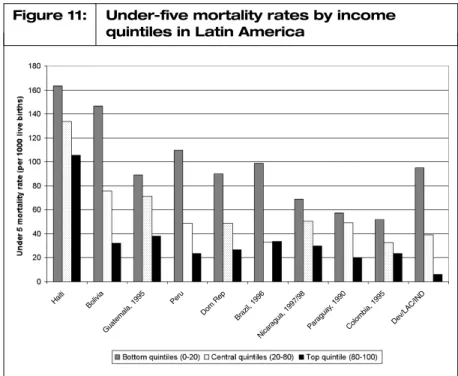
There is also evidence regarding “results” indicators, such as infant and child mortality, in relation to inputs (such as school attendance indicators). However, there are no available data over time. Even so, cross-country comparisons are consistent with the formerly stated hypothesis that: “Poor people queue to make the most of the state basic services.” In Latin America, in all of the countries with data (except for Haiti), the top quintile has achieved relatively low under-five mortality rates (Figure 11). In contrast, under-five mortality among the poorest families is two, three, even five times higher. It is important to point out that the levels reached by the top quintile are higher than those in industrialized nations. However, the top quintile encompasses more than the élite (which, given the structure of incomes and assets, is usually much smaller than 20 per cent of the popu-lation), among which the rates might be much lower and perhaps quite similar to the prevailing ones in high-income countries.
In the top quintile, “easy achievements” from simple, effective and effi-cient interventions can be observed (these include access to vaccination, regular check-ups during pregnancy, weight and growth measurements). As these practices become more generalized, infant and child mortality tends to decrease, a reduction reflected in lower mortality in the top quin-tile group. This is why there are differences in mortality rates in the top
37. A linear regression results in a slope quite different from zero (statistical t = 4.9; R2 = 0.37; cases = 43).
SOURCE: Inter-American Development Bank (1998) Facing Up to Inequality in Latin America; Economic and Social Progress in Latin America, 1998–99, Washington DC.
Figure 10: Income level and primary education completion in Latin America
quintiles of different countries. Under-five mortality among the top quin-tile is relatively constant for nations with different national averages, whereas reductions among the poorest are reflected in lower levels of average mortality.
In summary, the empirical evidence, both direct and indirect, suggests that poor families benefit from basic services if and when these are provided universally.(38) This hypothesis questions the utility of targeted
programmes that do not lead to general provision. An approach based on human rights can be used to argue in favour of the universal provision of public services. As in real life, the first in the queue do not allow those behind them to get their social services first. In other words, although it is possible and necessary to develop policies oriented to benefit the poor, they should be based on the universality of rights.
c. Child poverty and public expenditure(39)
Unless public expenditure on public services is shared equitably, the gap between access to basic social services and social indicators will be perpet-uated and poor children will not be able to escape from poverty.(40)Thus,
it is crucial to assess whether all social groups receive these benefits. Comparative information is available for 19 countries, showing public expenditure on education for the different quintiles.(41)In most countries,
the bottom quintiles receive less than 20 per cent, whilst the top quintiles receive more than 20 per cent. However, public expenditure in primary education is much more egalitarian than in tertiary education. Even so, one must remember that poor families tend to have more children and should receive more benefits.
Equity in expenditure, especially at primary education level, is related 38. The cases of countries
that chose universal programmes instead of focalized ones (Korea, Costa Rica, Malaysia, Sri Lanka) are discussed in the next section and thoroughly analyzed by Mehrotra and Jolly (1997), see reference 26.
39. Parts of this section are extracts from Mehrotra, S, J Vandemoortele and E Delamonica (2000), Basic Services for All? Public Spending and the Social Dimensions of Poverty, Innocenti Research Centre, UNICEF Florence. 40. Disparities, in both results and benefits received from public expenditure, must be analyzed along with other dimensions such as gender, ethnic group or geographic position. In order not to make the work too extensive, we will focus only on public expenditure among different income level groups.
41. Data, as for that for health, come from two sources: UNICEF and UNDP (1998), “Country experiences in assessing the adequacy, equity and efficiency of public spending on basic social services”, prepared for the Hanoi Meeting on the 20/20 Initiative; and Castro Leal, F, J Dayton, L Demery and K Mehra (1999), “Public social spending in Africa: do the poor benefit?”, World Bank Research Observer.
SOURCE: Gwatkin, D et al. (2000), Socioeconomic Differences in Health, Nutrition and Population, series of works by countries prepared for the HNP/Poverty Thematic Group of the World Bank, Washington DC.
Figure 11: Under-five mortality rates by income quintiles in Latin America
Haiti Bolivia Guatemala, 1995 Peru Dom Rep Brazil, 1996 Nicaragua, 1997/98 Paraguay , 1990 Colombia, 1995 Dev/LAC/IND
to levels of coverage, as seen in Figure 12. In countries where the school attendance rate is less than 70 per cent, the poorest 20 per cent of the popu-lation receives less than 20 per cent of the benefits. In contrast, where atten-dance is greater than 70 per cent, the poorest 20 per cent receives more than the expected 20 per cent. In several of these countries, wealthy families send their children to private schools, which partly explains the better distribution. But even so, public expenditure seems to be more equal in those countries with better coverage.
Available information for 17 countries shows that health expenditure also favours the better off (Figure 13). In all cases, families in the bottom quintile received less than 20 per cent of all public expenditure. Expendi-ture on basic health services is usually more equal. The poorest popula-tion seems to have easier access to primary health centres. For instance, in Chile, the bottom quintile of the population received 30 per cent of public expenditure, rising to 43 per cent in Costa Rica.
The impact of equity in public expenditure is reflected in the results. Countries with available information were divided into three groups, according to their infant mortality rates: “very high” (more than 140 per 1,000 live births), “high” (between 70 and 140 per 1,000 live births) and “medium” (fewer than 70 per 1,000 live births). The proportion of expen-diture received by the bottom and top quintiles was calculated for each country. In those countries with a mortality rate below 70, the poorest 20 per cent received 26 per cent of the total budget destined for health. The same group received less than 15 per cent in countries with very high mortality rates. Results were similar when expenditure on hospitals and tertiary services were evaluated. In countries with medium mortality rates, the wealthiest families used these services more frequently, but differences were tiny. In countries with high mortality rates, the poorest 20 per cent received only 10 per cent of the expenditure assigned to tertiary health levels. The richest 20 per cent received 40 per cent of this budget.
Policies that promote universal access and prioritize budget assign-SOURCE: Authors’ own calculations.
Figure 12: Expenditure distribution in education and school attendance
ments to preventive and basic social services tend to improve the way public funds are used and enhance quality of life, especially for children. In other words, these policies tend to reduce the non-monetary dimension of poverty. As the main beneficiaries, children receive the tools to avoid non-monetary poverty in the future.
IV. POSSIBLE POLICIES
THE EMPIRICAL EVIDENCE presented here provides only a few reasons to trust economic growth as the way towards poverty reduction. This is true for both monetary and non-monetary aspects of poverty. The obstacles preventing individuals from integrating into society relate to social, economic, political and cultural issues, many of which appear at an early age. The build up of disadvantages in life places people in vulnerable situ-ations which, in turn, lead to poverty and social exclusion.
Recent research on brain development emphasizes the importance of the early years of a person’s life. Cerebral mass grows rapidly in the first three years and, at this point, a series of tools indispensable for adult life are acquired.(42)The early stages of child growth are fundamental and
condition school performance and further social development. Adverse conditions such as health problems and hardship can affect normal devel-opment and can reduce an individual’s capacity to develop.
Research on childhood, youth and adult life shows evidence of the nega-tive impact that disadvantaged family, neighbourhood and school envi-ronments, both social and physical, can have on an individual’s performance.(43)The importance of educational performance has been
analyzed by numerous authors and institutions.(44)Although a deeper
analysis is needed, there are huge inequalities in social development that relate to access to basic social services. Our basic hypothesis is that: “Poverty and inequality reduction are more easily and rapidly achieved through universal provision of basic social services.”
But this hypothesis raises two questions: Is universal provision possi-42. Shore, R (1997),
Rethinking the Brain: The Insights into Early Development, Families and Work Institutes, New York. 43. Karoly, L, P Greenwood, S Everungham, J Hoube, M R Kilburn, C P Rydell, M Sanders and J Chiesa (1998), Investing in our Children: What We Know and do not Know about the Costs and Benefits of Early Childhood Interventions, RAND Corporation, Santa Monica. 44. Sparkles, J (1999), “Schools, education and social exclusion”, CASE paper 29, LSE, London.
SOURCE: Authors’ own calculations.
Figure 13: Distribution of expenditure in primary health care and infant mortality
ble? And if so, is it economically affordable? In this section we present some factors pointing to the answers, based on the experience of countries relatively successful in human development issues.(45)
Sometimes by design, sometimes by chance, these countries have provided their towns and villages with a “whole package” of basic social services,(46)including vaccination campaigns, child weight measurements,
instruction on basic health care and food supply. The effect of each indi-vidual intervention is improved by the presence of a different intervention – for example, well-fed children are less prone to disease and healthy chil-dren absorb food better. Fundamental to these synergies is a reduction in the individual cost of each intervention.(47)Work by Lyn Karoly, James
Heckman and CEPAL found that early investments in children produced a very high rate of return in terms of economic income possibilities in adult life.(48)They also showed the cost-effectiveness of early interventions, as
opposed to the so-called “second opportunity” interventions.(49)
A second point common to all relatively successful countries relates to the universality of welfare benefits. This allows greater political support and a reduction in the unit costs of single interventions, as fixed costs can be distributed among interventions, reducing the administrative costs of verification and monitoring.(50)It is important to note that a manipulation
of the patronage system can thus be avoided: as they are universal rights, there is no obligation towards either local or national authorities.
To achieve the universality of a “whole package” of interventions, the state has always led the expansion in basic services.(51)But this has been
achieved with different degrees of planning. In some countries, especially those with greater experience in matters of social services, there has been a natural process whereby, once some changes were achieved, the next steps followed on immediately. One example is the universality of primary school education, which is followed by an expansion in the secondary school level (e.g. in Costa Rica and Sri Lanka). In other countries, the expansion strategy has been more explicit and approached as a mid-term plan (e.g. in Cuba and Malaysia). In neither case did the fundamental role of the state mean a monopolization of service provision. But it did work as a guarantor of universality.
This guarantee was achieved in spite of relatively low per capita income rates. The only requirement is a more equitable distribution of resources. In addition, a “whole package” of basic social services allows a reduction in costs. Another advantage is the local availability of most supplies neces-sary for interventions. Strategic coordination and the managing role of the state reduce the amount of double expenditure and waste that would inevitably occur in a different context (e.g. competition between private suppliers with no coordination).(52)
The political support which results from universality and its low cost allows budget assignments to be protected during macroeconomic adjust-ment periods. In this way, a constant basic social service system is achieved, increasing effectiveness and reducing the number of future, more costly, interventions.(53)
Finally, the participation of the population – the users – with respect to both the functioning and the monitoring of the basic services constitutes a key element in guaranteeing effectiveness, permanence and development. This participation must only be carried out through institutionalized mech-anisms, leaving aside informal interventions.
In short, it is possible to state that:
• the different aspects of poverty in childhood have a definite negative
45. Case studies in relation to this and the following paragraphs can be found in Mehrotra and Jolly (1997), see reference 26. 46. In accordance with the CRC.
47. There is vast
information on the subject, for example, Behrman, J R and A B Deolalikar (1988), “Health and nutrition” in Chenery, H and T Srinivasan (editors), Handbook of Development Economics, Holland-North, Amsterdam, pages 631–771; also Carnoy, M (1992), The Case for Investing in Children, UNICEF. The need for an integrated approach was already considered by UNICEF: UNICEF (1964), Planning for the Needs of Children in Developing Countries, Resumé of the conference that took place April 1–7 in Bellagio, Italy. (Reprinted in 1986). 48. See reference 43; also Heckman, James J (1996), “What should our human capital investment policy be?”, Jobs and Capital, Spring, pages 3–10, Milken Institute for Job and Capital Formation; and CEPAL (1995), “Panorama social, Santiago de Chile”. 49. Dazinger Sheldon and Jane Waldfogel (2000), “Investing in children: what do we know? What should we do?”, CASE paper, LSE, London; also Dazinger Sheldon and Jane Waldfogel (2000), Securing the Future: Investing in Children from Birth to College, Russell Sage Foundation, New York.
50. Cornia, G A and F Stewart (1995), “Two errors in targeting” in Van de Walle, D and K Nead (editors), Public Spending and The Poor: Theory and Evidence, Johns Hopkins University Press, Baltimore; also Sen, A (1995), “The political economy of targeting” also in Van de Walle and Nead; and Smith, J (1999), “Area-based initiatives: the rationale for
effect on the development of the social and economic capabilities of the individual;
• childhood is the period of life when basic capacities are acquired and the individual’s human and social capital is built; it is then and there that social investments are more likely to succeed; and
• accumulated experience brings knowledge of the effectiveness of inter-ventions in the different stages of life from birth to youth. And this knowledge, duly adapted to the conditions and situations in each country, allows the development of strategies to expand development possibilities and children’s participation, to achieve a constant reduction in poverty and to create inclusive and democratic societies.(54)
Because of this, policies oriented at poverty reduction should put more effort into reducing child poverty.(55)Improvements in living conditions,
especially for children and the poor, are possible in cases of little economic growth, and without the need to “spend” too much. These policy lessons are of great relevance in the Latin American context.
V. CONCLUSIONS
THIS PAPER HAS discussed different aspects of economic growth, monetary poverty, infant and child poverty, social costs and basic social services costs and, finally, some lessons on policy making from an analysis of countries that have made advances in social conditions. There are some unanswered ques-tions and hypotheses, mainly in relation to the processes of change, which require more extensive development and additional information.
What are the main conclusions from these various analyses? This paper presents evidence on the relevance of the non-monetary dimensions of poverty and points out that improvements in these are directly related to income and goods distribution and to equity in social services distribution, the latter being understood as the social rights indispensable for poverty reduction and future inclusive societies.
Economic growth is undoubtedly a positive element but it does not always determine changes in social situations. Poverty reduction can occur in cases where there is little economic growth and, sometimes, in spite of considerable economic growth, poverty can remain the same or increase. This paper has sought to centre its argument on the importance of poverty reduction in achieving sustainable social change, and included evidence to show that countries must pay special attention to the different aspects of child poverty. The great inequity that currently exists interna-tionally is also discussed.
The paper also presented some elements that would allow an improve-ment in the current situation of children and a decrease in poverty within economic and financial restrictions. Children are not a problem, they are part of the solution. Programmes and policies that serve children’s basic needs provide different but also complementary routes to poverty reduc-tion. On the one hand, they immediately eliminate the worst aspects of poverty, as they satisfy basic needs. On the other, they provide the basis for a sustainable development that breaks the vicious circle of poverty reproduction through generations. Modifying distribution patterns in a country is a difficult task. Nevertheless, there is enough evidence to show that changes are possible, particularly in relation to children’s welfare. This is supported in our conclusions on policy action and is why we state that poverty reduction begins with responding to children.
and options for area targeting”, CASE paper 25, LSE, London, shows advantages and disadvantages of geographic focalization. 51. UNICEF and the World Bank (1998), “El acceso universal a los servicios basicos: un elemento esencial para el desarrollo humano”, presented at the Hanoi Meeting on Initiative 20/20.
52. Coclough, C (1997), Marketing Education and Health in Developing Countries, Oxford University Press, Oxford. 53. Hobcraft, J (1998), “Intergenerational and life-course transmission of social exclusion: infuences on childhood poverty, family disruption and contact with the police”, CASE paper 15, LSE, London; see also reference 49.
54. Mauras, Marta, Alberto Minujin and Raquel Perczeck (1999), “Infancia y derechos o la fuerza transformadora” in Hewitt and Minujin (1999), see reference 3.
55. Some countries, such as England, have made reduction or suppression of infant poverty a specific target.
ANNEX: POVERTY, INCOME DISTRIBUTION AND
POLICY ANALYSIS
This paper concluded that economic growth, by itself, does not guarantee poverty reduction. This annex aims to analyze certain aspects related to this issue, particularly to clarify concepts and ideas that are often misun-derstood
Poverty and income distribution. In recent work, a debate has devel-oped around the impact of economic growth on poverty reduction. Econo-metric estimates usually investigate the relation between income per capita and the income of “the poor”. This type of work assesses, for a group of countries, the impacts that different income levels have on poverty.(56)
Nevertheless, this type of analysis does not permit the study of economic growth, as different income levels correspond to different countries, not to the same country at given moments in time. Some works do take this more dynamic vision into account.(57)But even so, in both cases, the income of the
poor is considered as the average income of the bottom quintile.(58)This
could (or not) be correlated to the income of the poor but it is certainly linked to income distribution. In short, this does not throw light on the influence of economic growth on (monetary) poverty. Since the estimated relation compares the average of the distribution with the average of a sub-group of the population, a strong correlation should be expected. So, for instance, random numbers(59)– for example between 100 and 20,000 – to
represent different levels of income per capita could be taken. Also, in order to obtain a plausible range for the income of the bottom quintile as a proportion of the average per capita income level in a country, random numbers between 0.1 and 0.5 could be used. The multiplication of the first set of numbers (representing average income) and the second one yields a random series for the average income of the bottom quintile. Taking the logarithm of these data, it is possible to calculate the regression between the average income level (instead of growth) and the income level of “the poor” (i.e. the bottom quintile, which is not really the poor). Correspon-dence would be almost perfect, thus lacking economic significance because, by construction/definition, the income of the bottom quintile is a proportion of the total and the variability is greatly reduced when loga-rithms are applied.
Regressions and policy analysis. From a different point of view, there is another methodological problem with this type of study. Supposing a (dynamic) estimate shows an average (monetary) poverty reduction of x per cent per percentile of growth per capita, this information would not be useful for either the formulation or assessment of policies. This is due to at least three problems. First, it does not allow the study of the reasons why some countries are above or below this level. In other words, which elements make for the same economic growth, for greater or lesser poverty reduction in different countries?(60) Both the initial income distribution and
the accrual of additional income emanating from the growth process evidently play a certain role, as does an increase in the working capabili-ties of the population. However, these variables can be used to reduce poverty independently of economic growth. Second, as the debates on income distribution take place in the context of certain institutions and political situations, the average, estimated with the regression, is not constant.(61)That poverty reduction has been x per cent in the past does not
mean that the reduction will be the same given current political condi-tions.(62)Third, countries would love to have a free choice of their level of
56. Strykler, J D and S Pandolfi (1997), “Impact of outward-looking, market-oriented policy reform on economic growth and poverty”, CAER II, mimeo, HIID, Harvard University; also Dollar and Kraay (2000), see reference 10. 57. Gallup, J L, S Radelet and A Warner (1997), “Economic growth and the income of the poor”, CAER II, mimeo, HIID, Harvard University; also Roemer, M and M Gugerty (1997), “Does economic growth reduce poverty?”, CAER II, mimeo, HIID, Harvard University; and Gugerty, M and C P Timmer (1999), “Growth, inequality and poverty alleviation: implication for
development assistance”, CAER II, mimeo, HIID, Harvard University. 58. Strykler and Pandolfi (1997), see reference 56, present an exception, as they use an ad hoc deprivation index (i.e. life expectancy, illiteracy, etc.) 59. With uniform distribution. 60. Latin American countries are usually below the regression line. This implies that economic growth in these countries tends not to play as big a role in poverty reduction as it does in other countries. 61. For instance, in Chile, the elasticity of poverty incidence with regard to economic growth was 0.9 between 1987 and 1990 but 1.8 between 1992 and 1994 (Anriquez, G, K Cowan and J de Gregorio (1998), “Pobreza y politicas macroeconomicas: Chile 1987–1994” in Ganuza et al. (1998), see reference 25. 62. Average calculations also dim the asymmetrical effect observed on (monetary) poverty incidence of economic growth and recessions (De Janvry and Sadoulet (1995), see reference 25).