B O N N E V I L L E P O W E R A D M I N I S T R A T I O N
Long-Term
Financial and
Rates Analysis
Reference Case Results
ii
Foreword
These are transformative times for the electric utility industry in the Pacific Northwest. The
abundant supply of natural gas and robust development of renewable resources in the region
have resulted in significant downward pressure on the wholesale market prices for electricity.
These changes to the market environment have coincided with an increasing need for BPA to
reinvest in the Federal Columbia River Power System FCRPS hydro power and transmission
infrastructure as federal assets age and new assets are needed to meet changing demands.
These pressures are set against a backdrop of technological change. Emerging technologies,
evolving markets and new regulatory requirements could fundamentally change the role of
the traditional utility. BPA plans to think ahead, strategically aligning our decisions today with
the changing needs of the future. If we fail to do so, upward pressure on BPA’s long-term
cost structure could call into question the ability of BPA to meet its statutory obligations and
the continued use of and benefit from the FCRPS.
BPA’s ability to continue to meet its multiple statutory obligations and public purpose
objectives depends on maintaining our cost competitiveness and financial strength. This
ability is a shared objective for the many customers, tribes, and stakeholders that rely on BPA
for important services and programs.
BPA and its stakeholders must look beyond the current economic and fiscal environment to
make sound decisions for the future. It is crucial for BPA and its stakeholders to assess the
existing and emerging trends that will shape the region’s electric industry landscape for years to
come.
BPA’s ability to meet its statutory mission in the coming decades will depend largely on how
well we anticipate and position our business to address the challenges and opportunities
arising from the evolution of technology, markets, regulation, and our physical environment.
Existing and emerging factors that impact or may impact BPA’s mission in the future include,
but are not limited to, the following:
Decarbonization
Integration of distributed resources to the centralized grid
Flat-to-declining regional loads
Electrification of transportation
Shifting market and regulatory structures
Competitiveness of non-hydro resources (e.g., utility-scale wind and solar)
As the marketer and steward of the low-cost, low-carbon federal power system that provides
incredible value to the region’s economy, BPA strives to maintain the system’s value for
generations to come. BPA will remain focused on being the low-cost power provider of choice
when new power sales contracts are offered in the next decade.
BPA also operates a large
component of the region’s high-voltage transmission and provides open access transmission
to customers. BPA will remain dedicated to preserving a compliant and reliable transmission
system that continues to meet the needs of the region.
iii
Table of Contents
Introduction
... 1
Strategic Dashboard
... 2
Findings
... 3
Transmission Rates ... 3
Power Rates ... 4
Revenue Requirements ... 6
Capital Investment and Debt Management ... 7
Financial Health ... 7
Specifics about Financial Metrics ... 8
Summary
... 9
Overview of Rates, Risks and Uncertainties ... 9
Appendix
... 10
Spending Level Inputs ... 10
1. Capital Investment ... 10
2. Power Expenses ... 11
3. Transmission Expenses ... 12
Reference Case Assumptions ... 13
1
Introduction
To facilitate strategic conversations among regional stakeholders and customers, BPA
has produced a means for analyzing and comparing impacts of strategic choices and an
initial
Long-Term Reference Case
(Reference Case) as a basis for comparison. The
Reference Case is a 15-year analysis of BPA’s financial condition and rates using
spending level assumptions from recent public processes and current escalation,
market and load forecasts.
The Reference Case is the result of analyses that gives BPA the capability to project
program spending and rate levels over time based on a variety of assumptions,
providing today’s glide path for what BPA rate levels and other aspects of financial
health might be if current assumptions were extended into the future. This is a product
of repayment studies, long-term revenue requirement forecasts and power and
transmission rates analyses. The Reference Case is meant to serve as a beginning
point for strategic discussions and as the basis for comparing the financial and rate
implications of future scenarios or alternatives BPA may consider.
Through the
Focus 2028
process, BPA, its customers, tribes and stakeholders will
consider major sources of uncertainty and potential impacts of strategic alternatives that
can be analyzed and compared with the Reference Case. Discussions about BPA’s
proposed nearer-term actual investment and expense levels will occur during the
routine Capital Investment Review (CIR) and Integrated Program Review (IPR)
processes next year.
The Reference Case does not represent decisions about the future nor specific
proposals. The Reference Case uses assumptions about the future that were vetted in
other public processes such as the last IPR, CIR and rate case that may well play out
differently in the future. It also does not apply any expert judgement on how program
and capital levels may change over time. Therefore it does not represent BPA’s
projection of future financial health and rates as it does not capture the many
uncertainties surrounding the assumptions.
2
Strategic Dashboard
Rates Comparison and Performance on Metrics
Nominal $
2016 Nominal $ 2018 Nominal $ 2030 Real $ 2016
(2014 dollars) Real $ 2018 (2014 dollars) Real $ 2030 (2014 dollars) PF Rate (Tier 1) 33.75 35.32 43.48 32.40 32.52 32.50 NT Rate 1.74 1.83 2.42 1.69 1.69 1.80 PTP Rate 1.49 1.56 2.06 1.45 1.44 1.54 IS Rate 1.23 1.35 1.71 1.20 1.24 1.28 Financial Metrics FY 2016 FY 2030
Rate of Change for IPR Costs
(Rate of Cost Change / Inflation) ---
Px: 1.47 Tx: 0.97 Rate of Change in Capital Related Costs
(Rate of Cost Change / Inflation) ---
Px: (0.08) Tx: 2.14
Financial Reserve Level $830M $755M
Days Cash on Hand 144 94
Remaining Borrowing Authority $2,423M $1,289M
Interest Expense as % of Revenue
Requirement 18.73% 15.35%
Weighted Avg. Maturity of Debt Portfolio
(Years) 23.09 19.82
Debt to Assets Ratio 89% 73%
*Modeling observations shown in this analysis do not represent BPA’s forecast of future financial health or rates. These numbers represent a status quo perspective continued through the 15-year analysis horizon to be used as reference to test the impact of potential business decisions.
(n o m in a l)
3
Findings
We have grouped our findings into five major categories. They include transmission rates, power
rates, revenue requirements, capital investment and debt management, and financial health. The
FY2016 Reference Case assumes an extension of current spending levels but also factors in
commitments we have made in the future that may change those levels.
Transmission Rates
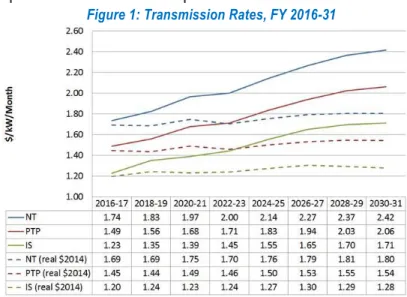
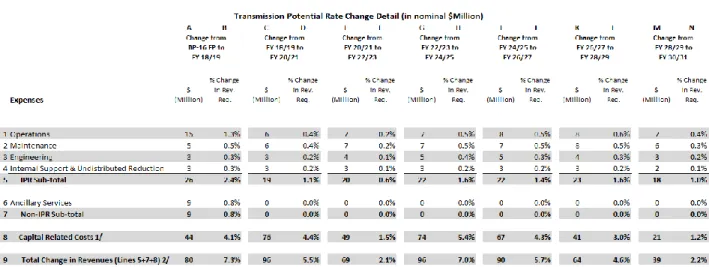
Transmission rates shown in Figure 1, in general reflect the results of assumptions used in the
2014 CIR and IPR. In the CIR transmission assumed capital investments will continue to increase
over the next fifteen years due to the energization of projects identified in the Network Open
Season (NOS). Additionally, compliance and reliability costs were assumed to increase every few
years. Revenues were assumed to have a relatively flat load growth with Point to Point (PTP) sales
increasing due to the energization of the NOS expansion projects that increase capacity on the
Network. Oversupply and other rate designs were assumed to be the same as in the BP-16 rate
case.
Figure 1 shows an increase in the Intertie South (IS) rate and the Network rates due to the revenue
requirement impact of the expected energization of major capital projects that were identified in the
2014 CIR. The increase in IS rate for BP-18 is driven by the continued assumption that the Celilo
Converter Station upgrade is fully energized and the related capital costs begin to affect revenue
requirements in that rate period. The increase in the Network rate in BP-20 is mainly due to the
assumption that a new I-5 Corridor Reinforcement Project is built and is fully energized in 2020/21
and the capital costs associated with this project begin to affect revenue requirements in the BP-20
rate period. The capital related costs associated with the capital expenditure assumption (inflation
of the 2015-2023 average CIR levels) is the primary driver of projected rate increases in BP-24
and beyond. Other aspects of the revenue requirement increases reflect the inflation assumption.
Figure 1: Transmission Rates, FY 2016-31
4
Figure 2: Transmission Potential Rate Change Detail
Power Rat
es
Power rates are expected to remain flat in real terms over the planning horizon, with the overall
nominal increases in rates at or slightly below the forecast level of inflation through 2030.
Increases in program spending due to Columbia Generating Station, the U.S. Army Corps of
Engineers and the Bureau of Reclamation for operating and maintaining the FCRPS, and BPA’s
Fish and Wildlife program, in addition the planned increases in the Residential Exchange Program
payments to participating investor-owned utilities and customer-owned utilities under the 2012
Residential Exchange Program (REP) Settlement may be partially offset by modest increases to
secondary revenues, which are due to the inflation assumption. Capital expenditures are forecast
to remain relatively stable over the planning horizon. The uptick in power rates between 2018-19
and 2020-21 rates is due to the expiration of rate mitigation actions taken to offset the effects of
moving BPA’s Energy Efficiency program from capital funding to expense.
The Reference Case is further informed by a modeled risk distribution. This distribution
incorporates load and resource, and natural gas and electric market variability into the analysis
and produces a range of rate outcomes. In this way, a distribution of potential rate levels is
produced, which widens further into the planning horizon as more sequentially bad, or good, years
add up to inform the tails of the distribution.
It should be noted that net secondary revenues for the Reference Case are held constant in real
terms at BP-16 levels even though the current market price forecast is expected to increase at a
rate somewhat higher than inflation. Including these increases in the Reference Case would tend
to obfuscate the effects of program spending on BPA’s competitiveness in the future.
It should also be noted that the REP Settlement expires within the horizon of this analysis. The
REP benefits paid under the REP Settlement throughout the settlement period account for
over-payments of REP benefits prior to the 2007 Ninth Circuit’s opinion remanding BPA’s 2002 power
rates. Therefore, REP benefits could increase substantially post-2028. On the other hand, the
5
settlement suspended significant issues in litigation that, if addressed in the future, could virtually
eliminate post-2028 REP benefits. Thus, the Reference Case maintains the current status quo and
the potential distribution of rate outcomes incorporates plus or minus $300 million of REP benefits
after the REP Settlement period.
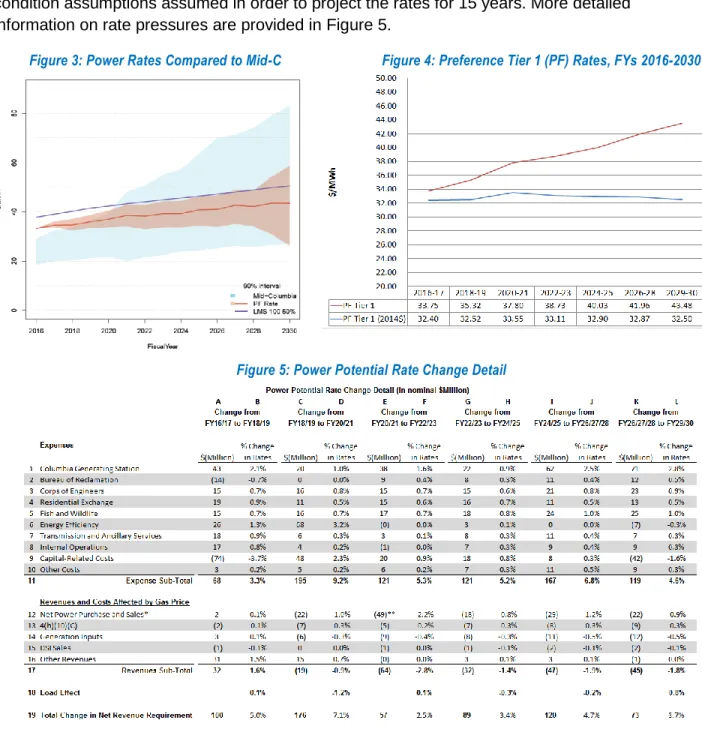
Figure 3 shows the Preference Tier 1 (PF) power rate with a 90% confidence interval around the
Reference Case output and the fractional cost of an LMS 100 along with Mid-Columbia market
prices expressed as a 90% confidence interval. Figure 4 shows a point forecast generated by the
standard BPA rates analysis process with a set of spending level, debt management, and market
condition assumptions assumed in order to project the rates for 15 years. More detailed
information on rate pressures are provided in Figure 5.
Figure 3: Power Rates Compared to Mid-C Figure 4: Preference Tier 1 (PF) Rates, FYs 2016-2030
6
Revenue Requirements
Revenue requirements are the accumulation of costs which BPA’s power and transmission rates
need to recover. These costs are incurred because of various programs, such as the operation
and maintenance of the transmission system or the Corps of Engineers and Bureau of
Reclamation dams, or from the acquisition of resources needed to ensure BPA meets its
contractual obligations to supply power. The revenue requirement also includes the costs
associated with capital investments (“Capital-Related Costs”). These costs, such as depreciation
and interest, are spread over time within the life of the investment. In general, capital investment
decisions made in the past affect today’s revenue requirements and capital investment decisions
made today will affect future revenue requirements.
While power and transmission rates will be set to recover the costs identified in revenue
requirements, rates over time will be influenced by factors other than costs. For instance, adding or
upgrading generating resources or expanding transmission capacity can result in greater sales
which would offset higher costs.
Figure 6: Power Revenue Requirement & Rates Figure 7: Transmission Revenue Requirement & Rates
The growth of IPR and capital-related costs compared to inflation are displayed in Figure 8
below. BPA’s assumed average rate of inflation for the period of 2016 through 2030 is 1.9%. In
the table below, 1.0 represents the rate of inflation. Anything above 1.0 means that costs are
increasing at a rate higher than inflation. Anything below 1.0 means rate of change is less than
the rate of inflation.
Figure 8: Cost Metrics
Metrics Cumulative Change vs Inflation
Rate of Change for Program (IPR) Costs
(Rate of Cost Change / Inflation) Tx: 0.97 Px: 1.47 Change in Capital Related Costs
(Rate of Cost Change / Inflation)
Px: (0.08) Tx: 2.14
7
Capital Investment and Debt Management
Capital-related costs, of which debt service is a primary component, make up 35% of current
power revenue requirements, 45% of current transmission revenue requirements, and are a
critical component of long-term power and transmission overall cost structures. One of BPA’s
top strategic priorities is to preserve and enhance transmission and federal generation assets
and the economic, environmental and operation value they create. Capital investment levels
assumed in the Reference Case through 2023 mirror the 2014 CIR less Energy Efficiency
capital which is now an expense. These levels were based upon the then-current asset
strategies and results of BPA’s newly introduced prioritization process. Capital investment levels
in the Reference Case after 2023 are the 2014-2023 average CIR increasing at the rate of
inflation.
Virtually all capital investments are financed through debt. Debt management strategies must
consider both near- and long-term impacts on capital-related revenue requirement. Capital
Investment decisions and debt management actions taken today will have an impact on overall
cost structure for years to come.
Debt management assumptions in the Reference Case are consistent with achieving three
primary objectives:
Ensuring capital financing requirements are met at the lowest overall cost;
Ensuring long-term cost stability for each business unit; and
Maintaining $750 million of access to the U.S. Treasury Borrowing Authority for the short
term liquidity note.
o After the use of 3rd party tools (full Regional Cooperation Debt Program and 50% Lease Purchase), maintaining the $750 million is achieved through the accelerated repayment of Federal debt.
Figure 9: Remaining Borrowing Authority
Financial Health
Figure 10 showcases the most relevant metrics to quickly assess BPA’s financial health. These
metrics focus on the following:
BPA’s current and future liquidity position (the ability to buffer against financial losses).
BPA’s financial flexibility (interest as a percent of BPA’s projected revenue requirement).
8
BPA’s debt ratio - the relationship between assets and debt.
BPA’s ability to continue to meet its multiple statutory obligations and public purpose objectives
depends on maintaining our cost competitiveness and financial strength. Strong BPA financial
targets result in a strong BPA credit rating. A strong credit rating lowers the cost of BPA’s
non-federal borrowing for CGS and transmission lease financing and translates directly to a lower
revenue requirement and thus more competitive BPA power and transmission rates.
Specifics about Financial Metrics
Reserves for Risk
levels represent unobligated cash and short-term investments in the BPA
fund that can be used to buffer against unexpected losses. Higher reserves for risk result in a
greater buffer against unexpected losses and thus are preferred over lower levels.
Days Cash On Hand
is a metric that measures the number of days a business can operate if
revenue stops coming in. This metric which is an evaluation of liquidity is an important indicator
of financial strength and a key element in the financial analysis of utilities.
Remaining Borrowing Authority
represents the amount of U.S. Treasury borrowing capacity
available to finance BPA construction projects and provide liquidity. Since $750 million of
borrowing authority must be reserved for operating liquidity this analysis assumes BPA will take
debt management actions to ensure that amount is available in any given year.
Interest as a % of Revenue Requirement
is a metric that highlights the amount of BPA’s
revenue requirement that goes to paying interest expense. This metric is important from a
financial flexibility standpoint as interest expense represents the most fixed component of BPA’s
cost structure. The lower the percentage of interest in BPA’s power and transmission revenue
requirement, the more competitive BPA rates will be and the more flexible BPA can be in other
cost areas from rate period to rate period.
Weighted Average Maturity of Outstanding Debt
represents the amount of time, in years,
that it takes for BPA to repay all of its debt. This metric is important when comparing one
long-term rate scenario to another. A declining weighted average maturity means BPA is paying off
debt faster and thus lowering interest expense at a faster rate than if the weighted average
maturity stays the same or increases.
Debt to Asset Ratio
represents the relationship between the amounts of BPA revenue
producing assets versus the amount of total outstanding debt. Figure 10 shows BPA currently
has a debt ratio of 89% driven primarily by debt issuance for non-revenue producing assets.
Figure 10: Summary of Financial Health Metrics
Metrics FY 2016 FY 2030
Financial Reserve Level $830M $755M
Days Cash on Hand 144 94
Remaining Borrowing Authority $2,423M $1,289M
Interest Expense as % of Revenue Requirement 18.73% 15.35%
Weighted Avg. Maturity of Debt Portfolio (Years) 23.09 19.82
9
Summary
Overview of Rates, Risks and Uncertainties
The comparison of rates from current rates to those in 2030 is summarized in Figure 11. Rates
in the
Reference Case
appear nearly level in 2030 in real dollar terms for both Transmission
and Power. However, these rates are the product of multiple assumptions about the future
which, taken together, represent a large degree of uncertainty. For this analysis, uncertain
future contractual relationships or legal obligations were assumed to continue as currently
implemented for the analysis horizon. These, along with general power and transmission market
and environmental variability, are significant sources of uncertainty. Thus, the
Reference Case
is of limited value for predicting the future. This limitation is addressed in two ways: first, a
confidence interval is placed around the
Reference Case
to display the effects of known and
measurable risks on the assumptions used; second, the
Reference Case
serves as a point of
reference to enable the display of effects of different scenarios on BPA’s rates and financial
health going forward.
Figure 11: Summary of Rates Results
Nominal $ 2016 Nominal $ 2018 Nominal $ 2030 Real $ 2016 (2014 dollars) Real $ 2018 (2014 dollars) Real $ 2030 (2014 Dollars) PF Rate 33.75 35.32 43.48 32.40 32.52 32.50 NT Rate 1.74 1.83 2.42 1.69 1.69 1.80 PTP Rate 1.49 1.56 2.06 1.45 1.44 1.54 IS Rate 1.23 1.35 1.71 1.20 1.24 1.28
Financial Disclosure:
This information has been made publicly available by BPA on October
Appendix
Spending Level Inputs
1.
Capital Investment
2.
Power Expenses
11
3.
Transmission Expenses
Reference Case Assumptions
Type
Summary of Assumptions
Capital
Forecasts in FYs 16-17 are consistent with Final 2014 CIR and IPR spending levels. FYs 18-23 match CIR – updated for
IPR2 (which excludes Energy Efficiency) spending levels. Forecasts in FYs 24-30 reflect a 9 year average of CIR
spending levels (with adjustments for Energy Efficiency) increasing annually at the common agency inflation rate.
Expense
BP-16 Final Proposal for FYs 16-17.
Most program expense between FYs 18-30 are inflated from BP-16 Final Proposal expense using common agency
inflation assumptions unless specified in Programmatic/Detailed Assumptions section below.
Non-federal debt service reflects full Energy Northwest debt extension.
Transmission
Rates
The NT loads use the 12 Non-Coincidental peak for allocation of costs and 12 Coincidental peak for billing determinants
to calculate rates. This was used in the BP-16 Initial Proposal and was assumed for twenty years.
The growth rate is approximately 1%.
Power Rates
In order not to obscure the effect of BPA’s costs on power rates in the Reference Case, future revenues from secondary
sales and purchased power costs are held at BP-16 levels, adjusted for inflation.
The risk bands around the Reference Case include expected Mid-C prices modeled using AURORA using all regular risk
modeling (e.g., hydro variation, gas prices, loads). The forecast includes:
–50% California RPS by 2030
–Henry Hub gas prices $3.30/6.74 CY 2016/2030 (nominal) with risk variation
–Regional annual load growth 0.7% with weather and economic risk variation
–Carbon pricing is not taken into account in the forecast
No significant changes in BPA firm requirements power obligations or BPA resources (T1SFCO reductions due to
expiration of the Wauna cogeneration contract and renewables assumptions).
COE/USBR/CGS costs consistent with 2014 CIR and IPR.
Residential Exchange costs follow the Settlement through 2028 and assume the same 7% per rate period escalation
thereafter. Risk analysis shows expectations that the actual post-settlement amounts could be between $0-$600 million.
Debt
Management
Debt management modeling ensures at least $750 million US Treasury Borrowing Authority is available on an annual
basis.
50% of the Transmission capital program is financed through the lease purchase program.
Assumes full Regional Cooperation Debt program.
Conservation 100% expensed starting in 2016.
No additional customer prepays.
Programmatic/Detailed Assumptions
Category
Topic
Assumption-2015
Capital Assumptions Capital Spending Forecasts in years FY 16 and FY 17 match BP-16 Final Proposal and FY 18- 23 match Final 2014 Capital Investment Review (CIR) spending levels and exclude Energy Efficiency starting in FY 16. Forecasts in years FY 24 through FY 30 reflect a ten-year average of CIR spending levels inflated using common agency inflation rate.
Capital Assumptions Capital Spending Cap The spending cap equals $857 million per year, which is consistent with the 2014 CIR (2014 CIR cap less expensed Energy Efficiency).
Capital Assumptions Plant-In-Service Plant-in-service is based on BP-16 Final Proposal in combination with 2014 CIR capital forecasts.
Capital Assumptions Allocation of Headroom, Sustain & Other Reductions
Unallocated capital (Headroom) and Sustain & other Reductions are distributed equally to Fed Hydro and Transmission.
Capital Assumptions Energy Efficiency The Energy Efficiency program is no long capitalized starting in FY 16.
Capital Assumptions Headroom Headroom reduced by total EE program in each year.
Corporate Expenses Assumptions Cost Allocation Corporate Pool costs are allocated between Power and Transmission using approved allocation percentages set by BPA Accounting.
Corporate Expenses Assumptions Program Expenses (General) Program costs are based on 2014 IPR and BP-16 Final Proposal, inflated in the out-years using standard agency assumptions.
Corporate Expenses Assumptions FTE Assumptions FTE related costs are assumed constant over time.
Debt Management Assumptions Treasury Maintain an annual minimum of $750 million of U.S. Treasury Borrowing Authority.
Debt Management Assumptions Lease Purchase 50 % of Transmission Capital is financed via 3rd Party Lease Financing.
Debt Management Assumptions Reserve Financing Transmission Only - $15 million /annually through FY 21.
Debt Management Assumptions Revenue Financing n/a
Debt Management Assumptions Prepay No new prepay.
Debt Management Assumptions Interest Income Official 2015 interest rates forecasts and 2014 CIR forecasts.
Debt Management Assumptions Outstanding Federal Bonds Amount of Federal Bonds as of 3/31/2015.
Debt Management Assumptions Outstanding Non-Federal Debt Amount of non-Federal debt as of 5/21/2015.
14
Category
Topic
Assumption-2015
Debt Management Assumptions Outstanding Appropriations Amount of Federal Appropriations as of3/31/2015.
Debt Management Assumptions Outstanding Capital Leases Transmission Only – Amount of debt being held as capital leases as of 5/31/2015.
Debt Management Assumptions CRFM Capital Forecast Projected capital needs for CRFM activities as of 9/30/2014.
Debt Management Assumptions Long-Term Federal Capital Forecast
Yearly amounts broken out by category through the next ten years. Every year after that is an average of the first ten years.
Debt Management Assumptions Current Rate Period Federal Borrowing Plan
Detailed monthly or quarterly projected federal bonds through the end of the next rate period.
Debt Management Assumptions Replacements and Credit Stream
Amount of capital needed to maintain systems.
Debt Management Assumptions CGS Capital Projections Power Only – Capital requirement as of 3/31/2015.
Debt Management Assumptions TVA Revenues Power Only - Income that Energy Northwest is expected to receive and offset expenditures based on the 2012 Uranium Tails transaction.
Debt Management Assumptions Interest Rate Forecast The official BPA Interest Rate Forecast from Global Insight Forecast as of 3/31/2015.
Debt Management Assumptions Interest Income Rate Rate of interest that we expect to earn on funds being held to pay off debt based on Global Insight Forecast.
Debt Management Assumptions Energy Northwest Regional Cooperation Debt Program (RCD)
Includes all regional cooperation debt transactions (up to $2.94 Billion) through which Energy Northwest issues BPA-supported bonds to refinance debt. That action makes available BPA resources that are then used for the additional repayment to the U.S. Treasury of higher interest Federal Debt
Power Expenses Assumptions Program Expense (General) Ties to the Final IPR Report for FY 15-17. FYs 18-30 are inflated from approved Final IPR expenses. Some program levels are tied to long range plans, known agreements, to a program-specific inflation rate.
Power Expenses Assumptions Columbia Generating Station (O&M)
Long Range Plan from FY18 through FY 30 assumes 3.5% Inflation. Does not include a reduction for DOE settlement dollars.
Power Expenses Assumptions Columbia Generating Station (Decommissioning Trust Fund)
Long Range Plan from FY18 through FY 30 assumes 4 % Inflation. Assumes no significant changes to expected decommissioning costs or fund earnings.
Category
Topic
Assumption-2015
Power Expenses Assumptions Columbia Generating Station (Neil Insurance)
Consistent with IPR. FY18 through FY 30 assumes 4 % Inflation. Investment performance and insurance losses are consistent with history and do not result in increases greater than inflation.
Power Expenses Assumptions Bureau of Reclamation FY15-17 consistent with the IPR2. Consistent with BOR long range plan through 2021. Beyond that, Reclamation is using a 3% increase for 2022-2030 based on our expected increases in trades & crafts wages.
Power Expenses Assumptions Corps of Engineers FY15-17 consistent with the IPR2. Consistent with COE long range plan through 2021. The Corps is using a 3.2% increase based on similar expectations for wages as well as expected increases in non-routine maintenance in that time period.
Power Expenses Assumptions Idaho Falls Bulb Turbine Assumes common agency inflation assumptions.
Assume contract renewal in September 2021 (maintains tier 1 resources) and purchase the output of the City of Idaho Falls hydro project's four bulb turbines at a market index with a floor of $30.50/MWh and a cap of $55.50/MWh.
Power Expenses Assumptions Cowlitz Falls O&M Assumes common agency inflation assumptions. Assumes O&M costs increase consistent with inflation.
Power Expenses Assumptions Billing Credits Generation Assumes Billing Credits costs are flat lined.
Power Expenses Assumptions Wauna Assume no contract renewal in 2017. (Decrease in tier 1 resources)
Power Expenses Assumptions Colville Generation Settlement Assumes common agency inflation assumptions.
Power Expenses Assumptions Tier 2 Power Purchases Assumes common agency inflation assumptions.
Contracts are set through 2019. Actual forecasts are done just prior to each rate period and are based on loads and resources. Forecast assumes current product selections and options continue. All costs are passed along to Tier 2 customers.
Power Expenses Assumptions Augmentation Augmentation is a rate case construct and is based on HydSim studies and customer loads and product selections. Augmentation purchase prices are escalated from BP-16 levels by general inflation. Risk analysis includes expected prices and quantities after application of risk factors.
Power Expenses Assumptions Renewables Assume power purchase contracts will not be renewed (decrease in tier 1 resources), that the $4M resource development budget will be held flat and that support services costs will inflate based on agency assumptions after 2021.
Category
Topic
Assumption-2015
Power Expenses Assumptions Trojan O&M Assumes a 1.95% inflation rate.
Power Expenses Assumptions WNP-1,3&4 O&M Assumes a 3.5% inflation rate.
Power Expenses Assumptions 3rd Party Transmission and Ancillary Services
Assumes a 5% rate of inflation.
Power Expenses Assumptions Clearwater Hatchery Generation
Assumes common agency inflation assumptions.
Power Expenses Assumptions Renewables (Legal) Assumes common agency inflation assumptions.
Power Expenses Assumptions DR & Smart Grid Assumes common agency inflation assumptions.
Power Expenses Assumptions Energy Efficiency Development (Reimbursable)
Assumes common agency inflation assumptions.
Power Expenses Assumptions 3rd party GTA Wheeling Assumes common agency inflation assumptions.
Power Expenses Assumptions Generation Integration Assumes common agency inflation assumptions.
Power Expenses Assumptions Planning Council Assumes common agency inflation assumptions.
Power Expenses Assumptions Lower Snake Hatcheries (Lower Snake River Compensation Plan)
Assumes common agency inflation assumptions.
Power Expenses Assumptions Post-Retirement Benefits Assumes common agency inflation assumptions.
Power Expenses Assumptions Corporate G&A Assumes common agency inflation assumptions.
Power Expenses Assumptions Low Income Weatherization and Tribal Grants
Assumes common agency inflation assumptions.
Assumes that BPA will not scale low income funding with EEI acquisition funding levels.
Power Expenses Assumptions Non Generating Operations (Internal Ops)
Assumes common agency inflation assumptions.
Assumes that labor costs increase by common agency assumptions.
Power Expenses Assumptions Corporate Undistributed Reduction
Assumes common agency inflation assumptions.
Assumes the undistributed reduction does not continue past FY17.
Power Expenses Assumptions Fish and Wildlife (BPA F&W Program)
Assumes stable program levels, with inflation, including accords and existing BiOps.
Power Expenses Assumptions PNCA Headwater Benefits Assumes costs are flat lined after FY17.
Power Expenses Assumptions Market Transformation (NEEA) Assumes level spending within the NEEA fiscal year (calendar year) and 2.8% inflation after the current contract expires.
Category
Topic
Assumption-2015
Power Expenses Assumptions New resources integration wheeling
Assumes new resources integration wheeling costs are flat.
Power Expenses Assumptions Residential Exchange IOU benefits for years 2018 through 2028 were established by settlement agreement (increase 7% per rate period). Increase for 2029-2030 assumed to be 7%.
Power Expenses Assumptions Conservation Acquisition Conservation Acquisition is increased based on Employment Cost projections 2018 through 2023, 2024 to 2030 averaged at 3.8% based on 2015 through 2023.
Power Expenses Assumptions Legacy (Tacoma) Uncertainty in the exact payment amounts through 2025.
Power Expenses Assumptions Other Power Purchase (Short Term)
Modeled in RAM. Costs are calculated annually based on Hoss study forecasts. Reference case escalates BP-16 purchase prices using general inflation.
Power Expenses Assumptions Power Undistributed Reduction IPR-14
Assumes the IPR-2 determined undistributed reduction continues through 2030. The IPR-2 undistributed reduction to offset expensing conservation terminates with FY17.
Power Expenses Assumptions PBL- Transmission and Ancillary Services
Assumes a 5% rate of inflation.
Power Rates Assumptions Loads TRL Forecasts are calibrated to the updated forecast of the Tier 1 System Capability and RHWM Augmentation forecasts out of the new TRM billing determinants model maintained by PSR Power Rates. These were
decomposed into the following product groupings: Block, Slice-Block, Slice Resource, Load Following System Shape Load, Load Following Load Shaping, and Tier 2. Conservation Augmentation, as forecast by KSL Load Forecasting, was included to arrive at net Preference Load.
DSI Loads assumed current long-term contract demand quantities as included in Alcoa and Port Townsends’ contracts. Alcoa’s load reflects the recent reduction in contract demand and assumes this level continues throughout the forecast period even though the contract expires earlier.
Other contract loads rely on forecasts from LORA’s BP-16 study for the Initial Final Proposal.
Power Rates Assumptions Resources Both Federal and non-federal/contracted resource amounts rely on forecasts from LORA’s BP-16 study for the Initial Final Proposal.
Category
Topic
Assumption-2015
Power Rates Assumptions Revenue Requirement Load and resource forecasts were used to forecast the system augmentation amount required to achieve load resource
amounts. Consistent with rate case practice, these modeled market purchases were valued at the average price from Aurora under 1937 water conditions, utilizing escalation assumptions in the market price forecast.
Transmission Expenses for power were computed consistent with the model for the BP-16 period, and apply growth rate assumptions imbedded in the Transmission Rate Forecast to out years.
Power Rates Assumptions Tier 2 and RSS Costs Tier 2 costs were estimated at the system augmentation price computed by RevSim. RevSim assumes escalation implied by the annual increase in Aurora Mid-C prices in the last two fiscal years modeled, and carries this escalation forward through 2030.
Power Rates Assumptions Revenue Credits 4h10C was modeled consistent with RevSim and AURORA market price assumptions through 2030.
Revenues from other contracts were flat-lined from BP-16 modeled levels for 2016-2017 to contract termination date, or 2030, whichever comes first. This includes Downstream Benefits and Pumping Power, Colville and Spokane Settlements, Green Tags, Hungry Horse, Pasadena and Riverside exchange agreements, Upper Baker storage with PSE, Miscellaneous credits (mainly associated with GTA), and WNP3 Settlement.
Generation Inputs assume Corp and Bureau-implied inflation rates in the embedded costs, and assume elections for service move to 15 minute scheduling. The wind forecast is updated to expected RPS standards.
Energy Efficiency Revenue Credits match Energy Efficiency Revenue Costs for this cost-credit program.
Power Rates Assumptions REP – Average System Costs
and Residential and Small Farm Loads
Forecasts were computed for ASCs and residential and small farm loads for BP-16. Escalation beyond the BP-16 period was assumed at the change in utility costs between 2016 and 2017, applies to 2018 and beyond. These assumptions do not affect overall REP benefit levels, just the distribution of benefits among participants.
Category
Topic
Assumption-2015
Power Rates Assumptions Transmission Rate Forecast Power services utilized the NT and Point to Point and Intertie rates as forecast by the Transmission group, incorporating all of Transmission’s out-year assumptions.
Power Rates Assumptions Market Price Forecast Aurora market prices at Mid-Columbia modeled through FY 2030.
Power Rates Assumptions Secondary and Balancing Purchases
Secondary and Balancing purchases are escalated from BP-16 levels by general inflation. Expectations for secondary sales and purchases are modeled in RevSim through 2030, using load and resource assumptions consistent with Power Rates, and Aurora market prices consistent with the escalation assumptions stated above These assume 50 games for 80 water years, and incorporate load and resource variability consistent with BP-16 modeling assumptions. Results are incorporated into risk assessment around the reference case.
Power Rates Assumptions LDD and IRD Costs included in Power Rates
BPA maintains two rate discount programs – one for irrigation loads, and another for customers with a high proportion of pole-miles relative to loads (aka to the “low density discount”). These are modeled consistent with BP-16 assumptions for FY 20BP-16 and 2017, and computed based on the modeled PF Tier 1 Average Net Cost of Power through 2030.
Transmission Expenses Assumptions
Program Expense (General) Program expenses tie to the BP 16 Final Proposal for FY 15-17. Program expenses between FY 18 and FY 30 are inflated off of approved 2014 Final IPR expenses, with exceptions for those programs that have known long-range plans or agreements.
Transmission Expenses Assumptions
Transmission Operations (EIM) EIM costs continue uninflated.
Transmission Expenses Assumptions
Transmission Operations (O&M)
Common agency inflation assumption, except EIM and Control Center.
Transmission Expenses Assumptions
Transmission Engineering (NERC/WECC Expense)
Assumes adding $2M in 2018 for estimated amount of WECC Peak
costs. Assumes a $1M increase over the rate of inflation every 2 year cycle due to likelihood of increasing compliance standards and requirements.
Transmission Expenses Assumptions
Acquisition and Ancillary Services (Non-BBL and BBL Expenses)
Non-BBL and BBL Ancillary costs will remain a flat amount in the out years at the rate assumed in FY17 with exceptions: 1) Settlement costs were increased to be $500k per year beginning in FY18 and then remain uninflated; 2) Transmission Renewables program costs will continue to increase at the rate of inflation; 3) Leases including Avista on-going parallel capacity support will continue uninflated.
Category
Topic
Assumption-2015
Transmission Expenses Assumptions
Undistributed Reduction Miscellaneous expenses, including costs that are not assigned to specific programs. Assumes the IPR-determined undistributed reduction continues through 2030.
Transmission Expenses Assumptions
Transmission Operations (Control Center)
First, general inflation is applied. Second, an additional plan of forecasts is added to the inflated amounts.
Transmission Expenses Assumptions
Transmission Maintenance (O&M)
Common agency inflation assumption, except for HMEM.
Transmission Expenses Assumptions
Transmission Maintenance (HMEM)
This project captures accounting treatment of Heavy Equipment and Maintenance costs. This treatment will match actuals on the financial reports, so the assumption amount is zero.
Transmission Expenses Assumptions
Transmission Engineering (O&M)
Common agency inflation assumptions, except for WECC/NERC.
Transmission Expenses Assumptions
Transmission Reimbursables Common agency inflation assumptions.
Transmission Expenses Assumptions
Post-Retirement Benefits Common agency inflation assumption.
Transmission Expenses Assumptions
Agency Services G&A Common agency inflation assumption, IPR corporate allocation rates.
Transmission Rates Assumptions Network Loads The NT loads use the 12 Non Coincidental peak for allocation of costs and 12 Coincidental peak for billing determinants to calculate rates. This was used in the BP-16 Initial Proposal and was assumed for twenty years.
Transmission Rates Assumptions Point-to-Point sales Increased based on sales in the queue for the capital builds of I-5. There was no assumption for reduction in the short-term market due to market changes or decrease of Long term firm PTP sales due to asset
swaps. There is an assumption of 1350 MW of wind start to come on in FY 18 through FY 2025.
Transmission Rates Assumptions IS Rates (Southern Intertie) There was a PDCI upgrade that would be energized FY 17. There is a partial increase for BP-16 with a full effect in BP-18 with the 125 mw.
Transmission Rates Assumptions Utility Delivery No assumption of more delivery sales. 0.7% load growth.
Transmission Rates Assumptions IM Rates (Montana Intertie) There is no assumption of Colstrip shut down. There is an assumption that the mw do not go away in FY 2027 due to the contract expiration.
Assumes16 mw for PAC.
Transmission Rates Assumptions WECC and PEAK Rates Assumption of costs increases with the common agency inflation rate.
21
Category
Topic
Assumption-2015
Transmission Rates Assumptions Gen Inputs Assumes common agency inflation rate..
Transmission Rates Assumptions Oversupply Rate Pass thru costs.
Transmission Rates Assumptions IR and FPT By FY 2017, there are only a few legacy contracts. Legacy products are assumed to convert to OATT products using the current capacity.