Medicare’s Prospective
Payment System for
Skilled Nursing Facilities:
Effects on Staffing and
Quality of Care
In 1998, Medicare began phasing in a new prospective payment system (PPS) for skilled nursing facilities (SNFs). This paper measures facility-level changes in nurse staffing and quality at freestanding SNFs from 1997 (pre-PPS) to 2001 (post-PPS). Findings show a positive but small association between changes in payment levels and changes in nurse staffing. Among for-profits, the elimination of cost reimbursement is associated with a large drop in nurse staffing. Additionally, the elimination of cost reimbursement is associated with worsening in one of four measures of quality of care; however, the quality results are not statistically robust.
Poor quality care in nursing facilities regularly resurfaces as a major public policy concern in the United States (Institute of Medicine 1986, 2001). The American Health Care Association, a nursing facility trade group, has argued that in-creasing government payment levels is the best way to improve the quality of care (American
Health Care Association 1999). Consumer
groups, on the other hand, tend to favor regulatory approaches, such as mandated minimum staffing levels (National Citizens’ Coalition for Nursing Home Reform 2002). Researchers also have cited a lack of physician oversight, supply caps, the dominance of for-profit providers, and the domi-nance of government payers (Chou 2002; Nyman 1985; Office of Inspector General 1999).
This debate raises three questions regarding payments to nursing facilities. First, if govern-ment paygovern-ments to nursing facilities are increased, to what extent are staffing levels and/or quality of care improved? If higher payment levels have lit-tle or no effect on staffing and quality, that would argue in favor of focusing on other ways to
in-crease staffing and improve quality. The second question is what features of the payment system, besides payment levels per se, affect staffing lev-els and quality. This research focuses on the difference between retrospective cost reimburse-ment and prospective payreimburse-ment, with the key dis-tinction being the extent to which payments are determined by actual costs incurred. The broader question, beyond the scope of this research, is how government payment policy should be com-bined with regulatory and other approaches in order to ensure high-quality care for nursing facil-ity residents.
Medicare’s prospective payment system (PPS) for skilled nursing facilities (SNFs), implemented in 1998, can help answer those questions. In free-standing SNFs, around one-tenth of all resident days are paid for by Medicare. The SNF PPS increased mean Medicare payment rates (from $269 per resident per day in 1997 to $316 in 2001) and also eliminated cost reimbursement. To help interpret SNFs’ responses to these changes, I develop a model of nursing home behavior in
Chapin White, Ph.D., M.P.P.,is a principal analyst at the Congressional Budget Office. Address correspondence to Dr. White at 1011 Olive St., Baltimore, MD 21230. Email: chapin_white@post.harvard.edu
which a nursing facility selects the level of staff-ing in response to payment policy. This model focuses on the effects of payment changes on staffing, and distinguishes between the effects of changes in payment levels and the effects of prospective payment. The model also contrasts the responses of altruistic facilities versus profit-oriented facilities. I then perform an empirical analysis in which I use the implementation of Medicare’s SNF PPS as a source of variation in both payment levels and the degree to which pay-ments are based on costs incurred. Facility-level changes in the outcomes of interest (staffing and quality of care) are regressed on changes in payments.
Briefly, I find that increases in payment levels are associated with slight increases in nurse staff-ing levels. The elimination of cost reimburse-ment, on the other hand, is strongly associated with reduced staffing at for-profit facilities and associated with a reduction in one of the three quality measures examined (though the quality results are not statistically robust). This finding is consistent with the lack of a strong consumer demand response to staffing levels and with for-profit providers not having a high level of altruis-tic concern for their residents’ well-being.
This research makes several contributions to the literature on nursing facility payments and payment systems in general. First, I use the im-plementation of the SNF PPS as an exogenous source of facility-level variation in both payment levels and prospective payment. This mitigates the potential bias from omitted variables that can arise in a cross-sectional analysis, such as a comparison of payment systems across states. Second, I build a rich data set that includes pre-and post-PPS measures of payments, staffing, and quality of care for the universe of freestand-ing SNFs. These data allow me to calculate pay-ment impacts at the SNF level, rather than aggregated across all SNFs; this is important be-cause the impact of the SNF PPS varied widely across SNFs. Furthermore, the staffing data allow me to examine changes in labor input levels, which can shed light on what might otherwise be a ‘‘black box’’ interposed between payments and quality. Finally, this analysis extends the re-search on Medicare hospital payments to a new provider setting. This can support the develop-ment of paydevelop-ment policies that are tailored to par-ticular provider types.
In the next section, I describe Medicare’s changing role in financing nursing facilities; then I review previous research on hospitals’ and nurs-ing facilities’ responses to payment changes. The following sections describe in detail the concep-tual framework and the empirical strategy. I then describe the data sources and the building of the analytic data set, and I present the results and dis-cuss alternative empirical specifications. Finally, I offer some comments on the policy implications of the results.
Changes in Medicare Payments to Nursing Facilities
During the 1970s and 1980s, Medicaid and private-pay residents together accounted for nearly all of the nursing facility population, and Medicare played only a small role in financing nursing fa-cilities (Hing 1981; Hing, Sekscenski and Stra-han 1989). At that time, economic research on payments to nursing facilities focused on Medic-aid payment policy and the interaction between Medicaid demand and private demand (Gertler 1985a, 1985b; Nyman 1985).
From the late 1980s through the mid-1990s, Medicare’s role in financing nursing home care expanded, as an increasing number of nursing facilities became certified as SNFs and, there-fore, eligible to receive Medicare reimbursement. Over this period, the Medicare resident fraction (i.e., fraction of nursing facility residents with Medicare as the primary payer) grew substantially (Gabrel and Jones 2000; Hing, Sekscenski and Strahan 1989). While Medicare-covered SNF days were increasing, so, too, were Medicare payments per resident per day, resulting in rapid spending growth (Committee on Ways and Means 2000). Congress, in an effort to rein in Medicare SNF spending, included a provision in the Balanced Budget Act of 1997 (BBA97) that required the Centers for Medicare & Medic-aid Services (CMS) to phase in a SNF PPS begin-ning in 1998. Under the SNF PPS, the unit of payment is the day (as opposed to the discharge or the episode), and payments are adjusted for case mix and a local wage index. Medicare’s pay-ments per SNF day dropped somewhat in 1999, but then rebounded as a result of ‘‘givebacks’’ (i.e., payment increases) legislated in the Bal-anced Budget Refinement Act of 1999 and the Benefits Improvement and Protection Act of 2000.
The SNF PPS dramatically altered SNFs’ eco-nomic incentives. Under the old cost-reimburse-ment system, SNFs had little incentive to limit the costs of providing care to their Medicare res-idents as long as those costs could be allocated to Medicare. The new Medicare PPS gives SNFs a strong incentive to reduce nursing costs (and most other costs) per resident day. Thus the sys-tem is high-powered with respect to nursing costs, pharmaceuticals, and most other costs per day. (A payment system is referred to as high-powered if payments are not based on the level of costs incurred, and low-powered if payments are based largely or wholly on costs incurred [Newhouse 2002].) On the other hand, SNFs are paid by Medicare per day, rather than per stay or episode, which makes the SNF PPS low-powered with respect to length of stay.
Previous Research
This research builds on three strands of literature: the first on Medicare’s acute care hospital PPS, the second on Medicaid payments to nursing facilities, and the third on the new SNF PPS. In 1983, Medicare began phasing out its retrospec-tive cost-based payment system for acute care hospitals and replacing it with a new case mix-ad-justed, stay-based PPS. Ellis and McGuire (1986) made a useful analogy between demand-side cost sharing (through coinsurance and deductibles) and supply-side cost sharing (through prospec-tive payment); both create incenprospec-tives to reduce the amount of health care consumed. Early stud-ies reported that the hospital PPS reduced growth in costs per case, but did not appear to significantly worsen health outcomes among Medicare hospi-tal patients (Feder, Hadley and Zuckerman 1987; Rogers et al. 1990). Later researchers attempted to disentangle the effects of changes in payment levels from the effects of prospective payment per se. Cutler (1995) reported that drops in pay-ment levels due to the acute care hospital PPS were not associated with any mortality differ-ences at one year, but were associated with a com-pression of mortality into the period soon after admission with no long-term differences. He did not find that the changes to marginal payment had any effect on mortality, though he did report an increase in readmission.
During the 1980s and early 1990s, several pa-pers examined the effects of nursing facility
pay-ment policy on quality in the context of supply caps and excess demand (Gertler 1992; Nyman 1985). Since those papers were written, there has been a sustained decline in nursing facility occupancy rates, from 91.8% in 1985 to 86.6% in 1999 (Hing, Sekscenski and Strahan 1989; Jones 2002). This has shifted attention away from excess demand models and led researchers to test for a positive association between Medicaid pay-ment levels and quality. There also has been in-creased attention to the importance of payment methodology, in particular the distinction be-tween prospective and retrospective payment. Cohen and Spector (1996) did not find an associ-ation between state Medicaid payment levels and registered nurse (RN) staffing, but did find a pos-itive association between the use of a retrospec-tive cost-based payment methodology and RN staffing. Grabowski (2001) found similar results– no association between Medicaid payment levels and RN staffing, but a positive association be-tween retrospective cost-based reimbursement and RN staffing. Grabowski also found an asso-ciation between quality of care (measured by pressure sores) and both Medicaid payment levels and the use of a retrospective cost-based payment methodology.
Research on the Medicare SNF PPS has shown that SNFs substantially altered their rehabilitation services post-PPS (Wodchis 2004). Freestanding SNFs, particularly for-profits, responded to the elimination of cost reimbursement by dramatically reducing the level of rehabilitation therapy provided (White 2003). Konetzka et al. (2004) examined the effects of the SNF PPS on staffing and deficiencies, and attempted to disentangle payment level effects from prospective payment effects. Their findings suggest that SNFs reduced their nurse staffing in response to the PPS, but their analysis and their identification strategy are limited by a lack of facility-specific measures of changes in payment levels. The findings pre-sented subsequently reinforce the key findings in Cohen and Spector (1996), Grabowski (2001), and White (2003)—namely that payment methodology, not just payment rates, affects staffing and outcomes.
Conceptual Framework
In this section I present a simple one-payer model of nursing facility behavior, in which a nursing
facility selects the level of resources to devote to patient care in response to the payment system. This model, which is similar to Hodgkin and McGuire’s (1994) model of a hospital’s choice of treatment intensity, is used to distinguish be-tween two types of payment effects—a ‘‘payment level effect’’ and a ‘‘prospective payment ef-fect’’—and is employed as the basis for the em-pirical analysis that follows. The level of resources devoted to patient care, measured by costs per resident day (c), is assumed to be under the nursing facility’s control, and can be thought of as reflecting the nurse staffing level or, more generally, as the quality of care. (Note that costs per resident day here refers to the costs of the la-bor and other inputs used by the facility in pro-viding care, not the payments made to the facility.) I show that the nursing facility’s choice of costs per resident day depends on the payment system, the facility’s degree of altruistic concern for residents’ health status, and the responsive-ness of individuals’ demand for nursing facility care with respect to the quality of that care.
The key equations are the following:
R¼aþbc b.¼0 ð1Þ p¼Rc ð2Þ H¼HðcÞ ð3Þ N¼NðcÞ N9 .¼0 ð4Þ U¼Uðp;H;gÞ ¼N½ð1gÞpþgH 0,¼g,¼1 ð5Þ c,¼R ð6Þ c,¼c ð7Þ
Revenue (R) per resident per day is a function of a flat-rate component (a) and a cost reimburse-ment component (b). Together,aandb charac-terize the payment system. In a retrospective cost-reimbursement system, a equals 0 and b
equals 1. In a cost-plus system,bis greater than 1. In a pure flat-rate payment system,aequals the flat rate andbequals 0. In a mixed system,a.0 and 0,b,1. Profit per resident per day (p) is simply the excess of revenues over costs (Rc). The health benefit to residents (H) is an increas-ing function of costs and is measured in the same units as costs (dollars per resident per day). Res-idents are all assumed to be identical in terms of their revenue function and health benefits
func-tion. The number of residents in the nursing facil-ity (N) is a non-decreasing function of costs incurred per resident day.N9reflects the increase in the number of individuals demanding nursing facility care in response to an increase in the resources devoted to patient care. IfN9is greater than zero, then there is some ‘‘demand re-sponse,’’ meaning that the nursing facility has some spare capacity, and that the demand for nursing facility care varies positively with the quality of that care. The nursing facility’s utility (U) equals the product of the number of residents and a weighted average of profits and health ben-efits to residents, withgrepresenting the weight (from 0 to 1) placed on residents’ health benefits. A facility that places more emphasis on resident well-being and less emphasis on profits would have a largerg.Ureflects the objective function of the decision maker who determines the level of costs to incur. In reality, that decision making is likely to be shared among managers, owners, boards of directors, and unions. A revenue con-straint (equation 6) is imposed, meaning that costs may not exceed revenues, and a minimum level of costs, c (equation 7), also is imposed. The minimum cost constraint reflects the fact that even a pure profit-maximizing nursing facility has to provide some staffing, due to regulatory requirements and the threat of litigation.
Using this framework, one can now define the two payment effects of interest. The payment level effect is the effect of a change inaon facilities’ choice of costs to incur. The prospective payment effect is the effect on facilities’ choice of costs of a revenue-neutral shift from cost reimbursement (b¼1) to prospective payment (b¼0). A reve-nue-neutral shift is one that eliminates cost reim-bursement but, from that facility’s perspective, leaves revenues per resident day unchanged. I use the first-order condition (FOC) to explore the payment-level and prospective-payment ef-fects, and how these effects vary with the weight placed on residents’ well-being (g), and the de-mand response (N9).
The FOC from equation 5 is:
N9½ð1gÞða ð1bÞcÞ þgH
þN½gH9 ð1gÞð1bÞ ¼0 ð8Þ This FOC, which is explored in more detail in an endnote,1 implies that the nursing facility’s response to payment changes will depend on
the degree of the facility’s altruistic concern for residents’ health status (g) and the demand re-sponse (N9). Intuitively, a nursing facility trades off the benefits and drawbacks of incurring higher costs. The benefits of incurring higher costs can include increased payments (in the case of cost reimbursement or a mixed payment sys-tem), increased health benefits (which may or may not matter to the facility, depending ong), and an increase in the number of patients (in the case of a non-zero demand response). The drawback to increasing costs incurred is a reduc-tion in profits in the case of prospective payment or a mixed payment system; those profits may or may not matter to the facility, depending on g. Increasing costs may not be possible if the reve-nue constraint binds.
The FOC implies that one should expect a pay-ment level effect (i.e., an increase in costs in re-sponse to an increase in payment levels) in only two situations: providers are altruistic and the revenue constraint binds, or there is a positive de-mand response. On the other hand, one should expect to observe a prospective payment effect (i.e., a drop in costs in response to a revenue-neutral switch from cost reimbursement to pro-spective payment) in cases where providers are not purely altruistic. This suggests that nursing facilities’ responses to the new Medicare pay-ment system might vary with market conditions (i.e., the degree of demand response) and with ownership status (i.e., for-profit vs. nonprofit).
Empirical Strategy
I measure changes from 1997 (pre-PPS) to 2001 (post-PPS) in facility-level payments, staffing, and quality of care.2 Changes in staffing and quality of care are regressed on changes in pay-ment levels and the Medicare resident fraction. The Medicare resident fraction measures expo-sure at the facility level to the change from cost reimbursement to prospective payment and is used to measure the prospective payment effect; the change in payment levels is used to measure the payment level effect. Medicare residents make up a small share of residents in most free-standing SNFs, but the changes in Medicare’s payments were substantial enough that it is plau-sible to test for facility-level changes in staffing and quality. As shown in Table 1, among free-standing SNFs in 1997 the mean Medicare
Table 1. Freestanding skilled nursing facility descriptive statistics
1997 2001 Mean S.D. Mean S.D. Time-varying characteristics Number of beds 162.6 104.0 160.3 100.3 Medicare payment per resident per daya($) 269.40 89.86 316.49 42.41 Occupancy (%) 90.3 8.9 86.8 11.7 Medicare resident fraction (%) 9.0 6.0 9.4 6.6 Medicaid resident fraction (%) 48.5 34.4 54.1 31.9 Other payer resident fraction (%) 42.4 33.5 36.5 30.9 Percentage SNFs with Medicare resident fraction of: 0%–5% 22.3 21.5 5%–15% 67.1 65.3 15%–25% 9.0 11.3 25%–50% 1.5 1.6 50%1 .2 .3 Staffing (wage equivalents per resident per day)b ($) Certified nurse aide (CNA) 31.32 10.27 32.40 8.77 Licensed practical nurse (LPN) 14.90 6.82 15.93 6.44 Registered nurse (RN) 15.68 10.23 14.14 8.57 All nurses (CNA, LPN, RN) 61.89 18.49 62.46 16.07 Inspection deficiencies 5.23 4.97 6.97 5.14 Time-invariant characteristicsc Nonprofit (%) 29.0 Member of chain (%) 58.4 Hospital service area-level Herfindahl index .26 .26
Source: Author’s analysis of OSCAR and MEDPAR data. Notes:N¼9,748. Means are weighted by total resident days in 1997. S.D.¼standard deviation.
a
Payments are inflated to July 2001 using the GDP deflator.
bWage equivalents equal full-time equivalents multiplied by
a national wage rate from 2001 plus a 38.3% fringe.
cThe analysis includes only SNFs active in 1997 and 2001.
The number of SNFs and their ownership status are, therefore, time-invariant.
resident fraction was 9%, and around two-thirds had a Medicare resident fraction between 5% and 15%. Because Medicare payments per resi-dent day generally are substantially higher than Medicaid or self-pay payments, Medicare ac-counts for a larger share of facilities’ revenues than patients.
Modeling facility-level changes produces esti-mates similar to the within-facility effects from a panel data analysis with facility-level fixed ef-fects. By using facility-level changes as the depen-dent variables, the analysis implicitly controls for omitted time-invariant facility characteristics. A similar approach was used in Shen’s (2003) anal-ysis of Medicare payments to short-stay hospitals. I exclude hospital-based SNFs from the analysis because they differ from freestanding SNFs on several important dimensions, and previous re-search has shown that they responded very differ-ently to the new PPS (White 2003).
Staffing and quality of care are measured at the facility level and, therefore, reflect the care SNFs provide both to their Medicare and non-Medicare residents. The use of facility-level outcomes raises the issue of how nursing home adminis-trators choose staffing and quality levels, and whether they make payer-specific decisions ver-sus facilitywide decisions. Is staffing set for each payer’s residents based on each payer’s policies, or is staffing set facilitywide based on some com-bination of the various payment policies? I use facility-level staffing and quality measures rather than measures specific to Medicare residents primarily because of data limitations. (Medicare-specific nurse staffing data are not available either pre- or post-PPS, and Medicare-specific quality data are not available for the pre-PPS period.) In describing the empirical strategy, I treat staffing decisions as payer-specific, but this is clearly an oversimplification. I subsequently show that the empirical strategy does not depend on staffing being payer-specific and is consistent with both payer-specific decision making and facilitywide decision making.
The goal in specifying the estimating equation is to identify the effects of the change in Medi-care’s payment policies on changes in the facility-level outcomes of interest (e.g., nurse full-time equivalents [FTEs] per resident per day). The facility-level outcome for facility j, Yj, can be
expressed as follows:
Yj ¼YM;jMjþYO;jð1MjÞ ð13Þ
whereYM,jis the outcome among Medicare
resi-dents, YO, j is the outcome among other
(non-Medicare) residents, and Mj is the Medicare
resident fraction (i.e., the fraction of residents with Medicare as primary payer).
With the implementation of the SNF PPS, both the flat-rate component (a) and the cost reim-bursement component (b) of Medicare payments were changed. The effect of this change can be expressed as follows:
YM;j¼fjðaPPS;j;bPPS;jÞ fjðaCR;j;bCR;jÞ ð14Þ
whereaPPS, jis the flat-rate component under the
prospective payment system, andaCR, jis the
flat-rate component under cost reimbursement. Recall that the payment level effect refers to the effect of a change in the flat-rate component, and the prospective payment effect refers to the effect of a revenue-neutral shift from cost reim-bursement to prospective payment. To be reve-nue neutral, a shift from b¼1 tob¼0 would require that the flat-rate component change from 0 toRCR, whereRCRequals revenue per resident
per day under cost reimbursement and where the resident population is assumed constant. Then, the payment level effect and the prospective pay-ment effect can be defined by expanding equa-tion 14:
YM;j¼ ½fjðaPPS;j;0Þ fjðRCR;j;0Þ
þ ½fjðRCR;j;0Þ fjð0;1Þ ð15Þ
where the first term in square brackets captures the payment level effect and the second term captures the prospective payment effect.
The first key assumption in specifying an esti-mating equation is that the marginal effect of a change in the flat-rate component is approxi-mately constant. This allows equation 15 to be re-written as:
YM;j¼xjðaPPS;jRCR;jÞ þj ð16Þ
where xj represents the payment level effect
(@fj(aPPS, j,bPPS,j)/@aPPS, j) andjrepresents the
prospective payment effect (fj(RCR, j,0)fj(0,1)).
To estimate the payment level effect (xj), I
first calculate the ‘‘Medicare payment impact’’ (PM, j):
PM;j¼aPPS;jRCR;j ð17Þ
which equals the change from 1997 (pre-PPS) to 2001 (post-PPS) in Medicare payment per Medicare resident per day, adjusted for inflation and holding resident case mix constant (as subsequently described). I then calculate the ‘‘overall payment impact’’ (Pj):
Pj¼ ðPM;jÞMj ð18Þ
by multiplying the Medicare payment impact (PM,j) by the Medicare resident fraction in
1997 (Mj). This is equivalent to the change in
the facility-level revenue constraint due to the new PPS, expressed in dollars per resident per day.
One key assumption in specifying the estimat-ing equation is that the Medicare resident frac-tion, Mj, can be treated reasonably as constant
over time.3 Then, the change from 1997 to 2001 in the facility-level outcome of interest, Yj, can be approximated as:
Yj¼xjPjþjMjþYO;jð1MjÞ ð19Þ
To estimate the prospective payment effect (j),
I use each facility’s Medicare resident fraction in 1997 (Mj).
The last key assumption I use is that, after in-cluding a set of controls, the change in outcomes among non-Medicare beneficiaries (YO, j) is
un-correlated with the Medicare resident fraction (Mj) and the overall payment impact (Pj).
Equation 19 then can be parameterized as:
Yj¼xPjþMjþXjdþej ð20Þ
whereXj is a set of controls andeis a residual.
Note that the coefficients on the control variables (state, ownership, and competition) capture dif-ferential trends in the outcomes of interest (not differences in levels).
I have assumed, so far, that facilities make payer-specific decisions regarding staffing and quality. Note, though, that the specification in equation 20 is also consistent with facilitywide decision making. Suppose that facilities choose the outcomes of interest (Y) for all residents based on a facility-level ‘‘average’’ payment policy (i.e., averaged over a facility’s residents). In its simplest formulation, this average payment policy would consist of an average flat-rate component (a) and an average cost reimbursement
compo-nent (b). The overall payment impact (Pj), by
construction, equals the facility-level change in the average flat-rate component, and the Medi-care resident fraction (Mj) equals the (negative
of the) facility-level change in the average cost reimbursement component. The key behavioral parameters (x and ), therefore, may be inter-preted either as reflecting payer-specific decision making (Medicare payment policy affects staff-ing and quality of care for Medicare residents), or as reflecting facilitywide decision making (Medicare payment policy affects staffing and quality of care for all residents).
Based on the predictions from the theoretical model, I expect the payment level effect and pro-spective payment effect to vary with market conditions and ownership status. The estimating equations, therefore, include interactions of the key variables (overall payment impact and Medi-care resident fraction) with a measure of local market competition, and a dummy variable that indicates nonprofit status. I include the measure of local market competition to test for the possibil-ity that SNFs respond differently to payment changes depending on the level of competition they face. Specifically, I am testing whether SNFs that face greater competition exhibit a stronger payment level effect, as suggested by the theoret-ical model. The notion is that if a SNF increases its staffing per resident and its quality of care, then the SNF may be able to increase the number of residents it attracts. I expect that the link between staffing per resident and the number of residents might be stronger in more competitive areas; this link would occur if patients needing SNF care in more competitive areas chose among SNFs at least partly on the basis of quality of care.
Including the interactions of the nonprofit dummy with the other key variables in the model also is based on the predictions of the theoretical model. The model predicts that more altruistic providers, compared with more profit-oriented providers, will exhibit stronger payment level ef-fects and weaker prospective payment efef-fects. The ‘‘dummy variable’’ approach to analyzing differences between for-profit and nonprofit SNFs allows a straightforward specification with easily interpretable results, but potentially ignores strate-gic interactions among different ownership forms (Grabowski and Hirth 2003). The controls include a full set of state dummies, a dummy for nonprofit ownership, and a measure of market-level
compe-tition among SNFs. Because the dependent vari-ables measure changes over time, the inclusion of these controls allows for differential state-, own-ership-, and competition-specific time trends. One concern in estimating the payment effects is that the implementation of the SNF PPS might cause, or simply coincide with, changes in the composition of nursing facility residents. To ac-count for such changes, pre- and post-PPS staffing and quality measures are adjusted for resident case mix, as subsequently described.
Data
I constructed a data set at the nursing facility level containing pre- and post-PPS data on Medicare payments, staffing, and quality of care. The anal-ysis includes all freestanding nursing facilities in the United States with Medicare-covered days in both 1997 (pre-PPS) and 2001 (post-PPS). All analyses are weighted by each facility’s total resident days in 1997 (including Medicare and non-Medicare days).
Medicare Payments and Days
Medicare payments and Medicare-covered
days are measured using the universe of Medi-care Provider Analysis and Review (MEDPAR) SNF claims for 1997 and 2001. Payments are inflated to July 2001 using the gross domestic product (GDP) implicit price deflator (Federal Reserve Bank of St. Louis 2004). Mean Medicare payments per resident per day and total covered days are calculated for each SNF for 1997 and 2001.
Medicare payments to SNFs under the PPS are determined by the facility’s case mix, a wage in-dex at the level of the metropolitan statistical area (MSA), and, during a 3-year transition period, a facility-specific measure of historical costs (U.S. Department of Health and Human Services 2001). For each SNF I want to calculate the change in payments attributable to the PPS for-mula, holding case mix and staffing constant. Because the data collection system for SNF case-mix classification was not in place in 1997, I do not have a direct measure of 1997 case mix. Therefore, I use data from 1998 through 2001 to map acute care hospital primary diagnoses onto SNF case-mix categories (i.e., among all individ-uals nationwide who had acute care hospital stays with a particular primary diagnosis and who had a subsequent SNF stay, I find the fraction
as-signed to each SNF case-mix category). For each SNF, I then simulate case mix (i.e., the fraction of residents in each case-mix category) in 1997 us-ing this diagnosis-case mix map. I follow by cal-culating the simulated payment rate in 2001 using the 1997 simulated case mix, a weighted average of the payment rates in effect for each case-mix category in 2001, and the 2001 MSA-level wage adjuster (U.S. Department of Health and Human Services 2001). The MSA wage index, which is calculated by CMS based on hospital cost reports, is the primary determinant of the simulated 2001 payment rate.
Market Competition
The Center for the Evaluative Clinical Sciences at Dartmouth Medical School has created a geo-graphic classification system that maps zip codes to hospital service areas (HSAs). There are 3,436 HSAs in the United States where each HSA cor-responds roughly to the area served predominant-ly by a single acute care hospital. For each HSA, I calculate a SNF Herfindahl index based on total nursing facility patient days in 1997. This Herfin-dahl index, which reflects both freestanding and hospital-based SNFs, reflects the HSA-level mar-ket concentration in the provision of nursing fa-cility services. The Herfindahl index is assumed to be inversely related to the degree of demand response to the level of costs incurred.
Medicare Resident Fraction, Staffing, and Quality Data
Total resident days and Medicare resident frac-tions for calendar years 1997 and 2001 are calcu-lated from a March 2004 SNF cost report file.4 The CMS Online Survey, Certification and Re-porting (OSCAR) data are used to measure staff-ing levels and quality of care. The most recent OSCAR data for each SNF also were used to identify ownership status and whether the SNF was a member of a nursing home chain. OSCAR data include information on FTEs by type of staff and resident population (e.g., number of residents who are bedfast).5The OSCAR data also include ‘‘deficiencies,’’ which are violations of standards of care as reported by state inspectors. To make the staffing model results more easily interpret-able, I scale the staffing FTEs by wages and fringe benefit costs, using separate national wage rates for certified nurse aides (CNAs), licensed
practical nurses (LPNs), and registered nurses (RNs), and using a national nurse-specific fringe rate. The staffing measures, therefore, represent staffing costs per resident per day.6
Staffing costs (dollars per resident per day) are case mix-adjusted for resident characteristics using ordinary least squares (OLS) models. These models are estimated with data from all OSCAR surveys of all freestanding SNFs from 1996 through 2002 (N¼68,437). Staffing costs by type of staff are modeled as functions of the fractions of residents dependent in each ADL (bathing, dressing, transferring, toileting, eating), the fraction who are incontinent, and the fractions receiving a number of special treatments (the models are not shown here but details and the es-timated coefficients are available upon request). The coefficients in these models appear to be rea-sonable, thoughR-squares are not high, ranging from .0364 for the CNA model to .0888 for the RN model. Reassuringly, the resident character-istics that are estimated in these models to have the greatest impact on staffing costs have been identified previously as being associated with higher nurse staffing costs and are used in Medi-care’s case-mix adjustment system for SNFs (Fries et al. 1994). For each type of staffing, adjusted staffing costs are calculated by adding the residuals from the case-mix models to the overall means.
The OSCAR surveys occur at approximately yearly intervals and are conducted by state in-spectors. The surveys measure resident census and staffing levels at a point in time and are, therefore, subject to measurement error. To in-crease the precision of the staffing and census measures, I allow multiple surveys to be included in the calculation of the pre- and post-PPS mea-sures of SNF-level staffing and quality. At the SNF level, I calculate pre-PPS staffing and qual-ity measures averaging all surveys occurring from July 1996 through June 1998; similarly, post-PPS staffing and quality measures are calcu-lated using all surveys occurring from July 2000 through June 2002. Typically, one to three sur-veys are used here to calculate the pre- and post-PPS measures. Surveys with unreasonable staffing data are excluded from the analysis.7
Researchers have devoted substantial effort in recent years to developing valid measures of the quality of care in nursing homes (CMS 2003). Currently, the key data source for generating
quality measures in the nursing facility setting is the Minimum Data Set (MDS), a detailed resident-level assessment of health and functional status. Unfortunately, MDS data were not made available nationally in electronic form until after the implementation of the SNF PPS; this prevents me from using MDS-based quality measures in this analysis. Instead, I use facility-level measures from the OSCAR. These OS-CAR-based measures are poor substitutes for modern MDS-based measures, but are some of the only facility-level quality measures available for the period analyzed here.
To assess changes in the quality of care, I use pressure sores as a measure of health outcomes, and two process-based quality measures—use of restraints and survey deficiencies. Pressure sores, also referred to as decubitus ulcers or bed-sores, are defined by the Institute of Medicine (2001) as ‘‘bruises or open sores . . .from pres-sure or friction on the skin.’’ Because they can cause serious medical complications and are gen-erally preventable, pressure sores are commonly used as indicators of the quality of care in nursing facilities (Chou 2002; Cohen and Spector 1996; Grabowski 2001). The Institute of Medicine also cites the use of unnecessary physical and chemi-cal restraints as common sources of poor quality care in nursing facilities (Institute of Medicine 2001). The OSCAR resident census data are used to calculate the fraction of residents with new pressure sores and new restraints.8
Survey deficiencies, which reflect the number of violations of federal regulatory standards as reported by state inspectors during annual certi-fication surveys, are used as another measure of quality of care. Researchers have expressed con-cern regarding the use of survey deficiencies as a measure of quality of care in light of the signif-icant variability across states in the interpreta-tion of federal regulatory standards (Institute of Medicine 2001). This concern is lessened in the current research because I use facility-level changes in survey deficiencies as the outcome of interest, and all models include state-level dummy variables as controls. These measures of quality of care are adjusted for case mix using OLS models analogous to those used to adjust staffing levels. The R-squares for the case-mix models are lower for the quality measures than for staffing costs, ranging from .0212 for new pressure sores to .0454 for deficiencies.
Excluded Facilities and Missing Data
There were 18,210 SNFs that submitted Medi-care claims in 1997 or 2001, including freestand-ing SNFs, hospital-based SNFs, and hospital swing-bed units. Excluded from the analysis are SNFs that: did not have claims in both 1997 and 2001 (3,695 SNFs), were swing-bed units (1,099), were hospital-based (1,615 SNFs), or were located in Puerto Rico or a territory (three SNFs). SNFs also were excluded if there was missing or invalid data (476 SNFs had missing OSCAR data, 1,541 SNFs had missing cost re-port data, and 33 had other missing data). The 9,748 freestanding SNFs included in the analysis accounted for 3.49 million Medicare SNF stays in 1997 and 2001 combined. The 2,050 SNFs ex-cluded due to missing or invalid data accounted for .43 million Medicare SNF stays. Compared to the freestanding SNFs included in the analysis, SNFs excluded due to missing data appear to be smaller, have lower occupancy, and lower Medicare resident fractions, and similar in other respects.
Results
Table 1 presents simple descriptive statistics on the SNFs included in the analysis. These statistics illustrate some of the basic features of the nursing facility market. A minority are nonprofit (29.0%) and most are part of a chain (58.4%). Medicaid is the predominant payer, accounting for around half of all residents, with other (non-Medicare) payers accounting for the second largest share. Medicare is the payer for less than one-tenth of residents, with nearly all freestanding SNFs hav-ing Medicare resident fractions between 0% and 15%. Between 1997 and 2001, mean Medicare payments per Medicare resident per day (in real 2001 dollars) increased $47.09, from $269.40 to $316.49. Over the same period, the mean Medicare resident fraction increased from 9.0% to 9.4%, while mean nurse staffing costs per res-ident per day among all resres-idents increased slightly, from $61.89 to $62.46.9
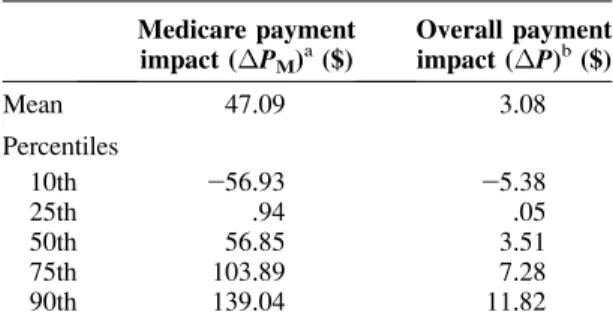
Table 2 shows that the Medicare and overall payment impacts varied greatly across individual SNFs. The Medicare payment impact (change in Medicare payment per Medicare resident per day) has an interquartile range of over $100. The overall payment impact (i.e., the Medicare payment impact multiplied by the Medicare
resi-dent fraction in 1997) has a much narrower range because the Medicare resident fraction is generally small. Still, the overall payment impact interquar-tile range is around $7, which is over 5% of the average cost per day of nursing facility care ($128 in 1999) (National Center for Health Sta-tistics 2002). This shows that the changes in Medicare payment levels varied widely across SNFs, and that the magnitudes are large enough that it is plausible to test for associated changes in staffing and quality.
Table 3 presents the staffing results. The over-all payment impact is associated with increases in CNA, LPN, RN, and all-nurse staffing. For a for-profit facility, an increase of $100 in payments per resident per day is associated with an increase in nurse staffing costs of $12.09 per resident per day. This payment level effect does not appear to vary with market competitiveness or with non-profit status. To help interpret the payment level effect, note that the mean overall payment impact ($3.08) would be associated with an increase in nurse staffing costs of $.37 per resident per day (i.e., [$12.09/100] * $3.08).
The Medicare resident fraction in 1997, which measures the prospective payment effect, has a strong negative association with changes in CNA, LPN, RN, and all-nurse staffing. The pro-spective payment effect is substantially smaller among nonprofit facilities (note the large positive coefficient on the interaction of the Medicare res-ident fraction in 1997 and the nonprofit dummy). Multiplying the mean Medicare resident fraction in 1997 (9.0%) by the all-nurse staffing coeffi-cient on Medicare resident fraction ($42.07)
Table 2. Payment impacts (change in payments per resident per day,
1997 to 2001) Medicare payment impact (PM)a($) Overall payment impact (P)b($) Mean 47.09 3.08 Percentiles 10th 256.93 25.38 25th .94 .05 50th 56.85 3.51 75th 103.89 7.28 90th 139.04 11.82
Notes:N¼9,748. Weighted by total resident days in 1997.
aMeasured in July 2001 dollars per Medicare resident per day. b
yields a change in nurse staffing costs of$3.79 per resident per day.
To provide an alternative sense of the magni-tudes involved, the staffing results can be restated in terms of nurse staff minutes per resident per day. The mean nurse staffing costs in 1997 ($61.89) is equivalent to around 210 minutes of nursing staff time per resident per day. In the all-nurse staffing regression, the coefficient on the simulated overall payment impact ($12.09) implies that the mean overall payment impact ($3.08) is associated with an increase in nurse staff time per resident per day of just over one minute (i.e., $3.08 * [$12.09/100] * [210/ $61.89]). The coefficient on Medicare resident fraction ($42.07) implies that the mean Medi-care resident fraction in 1997 (9.0%) is associ-ated with a drop in nurse staff time per resident per day of almost 13 minutes (i.e., 9.0% * [$42.07] * [210/$61.89]).
The quality results, shown in Table 4, are less precisely estimated than the staffing results, and some are counterintuitive. The Medicare resident
fraction is associated with a statistically signifi-cant increase in the number of deficiencies, which is consistent with predictions and with the staff-ing results (assumstaff-ing staffstaff-ing and deficiencies are inversely related). Surprisingly, though, this result is reversed in the less competitive markets (i.e., markets with a high Herfindahl index). In less competitive markets, the overall payment im-pact is associated with a reduction in the fraction of residents in restraints, but in more competitive markets this effect is reversed; this last result is counterintuitive. Overall, these results suggest that nonprofit nursing facilities showed some im-provements in quality relative to for-profit facili-ties over the period analyzed (note the negative coefficients on the nonprofit dummy in two of three models). The only quality results with p -values less than .01 are the nonprofit dummy in the restraints model (which reflects a differential time trend) and the Medicare resident fraction in the deficiencies model. If a Bonferroni correc-tion is applied to the quality regression results, only the association between the nonprofit
dum-Table 3. Staffing regressions, SNF-level change in wage equivalents per resident
CNA LPN RN All nurses
Overall payment impact
($100s, simulated) $3.18 (1.67)* $3.32 (.91)*** $5.58 (1.31)*** $12.09 (2.68)*** Medicare resident fraction
in 1997 $29.67 (2.92)*** $24.60 (1.59)*** $227.79 (2.29)*** $242.07 (4.67)*** HSA-level Herfindahl
index $2.01 (.78) $2.11 (.42) $.74 (.61) $.61 (1.24)
Overall payment impact ($100s, simulated) * HSA-level Herfindahl
index $1.93 (5.01) $1.84 (2.72) $2.25 (3.92) $6.02 (8.02)
Medicare resident fraction in 1997 * HSA-level
Herfindahl index $2.26 (7.27) $.09 (3.95) $11.53 (5.70)** $11.36 (11.65)
Nonprofit $2.27 (.43) $2.10 (.24) $.05 (.34) $2.31 (.70)
Overall payment impact ($100s, simulated) *
Nonprofit $21.32 (2.79) $22.30 (1.52) $21.87 (2.18) $25.50 (4.46) Medicare resident fraction
in 1997 * Nonprofit $9.14 (4.01)** $4.59 (2.18)** $14.70 (3.14)*** $28.44 (6.43)***
Intercept $2.38 (2.72) $2.26 (1.48) $2.29 (2.13) $2.93 (4.36)
R2 .0183 .0220 .0648 .0421
Dependent mean $.84 $.37 2$2.01 2$.80
Notes:N¼9,748. Weighted by total resident days in 1997. Standard errors are in parentheses.
Staffing is measured in wage equivalents (full-time equivalents multiplied by a national wage rate plus a 38.3% fringe factor) per resident per day. Staffing is adjusted for case mix among all residents (Medicare and non-Medicare) as described in the text. All models include state dummies (coefficients not shown).
*P< .10. **P< .05. ***P< .01.
my and the fraction of residents in restraints re-mains statistically significant at the 5% level.
One potentially serious concern with this anal-ysis is that changes in state Medicaid payments over the time period analyzed might drive the observed staffing changes. This concern is justi-fied given that the BBA97 overhauled Medi-care’s SNF payments and, at the same time, repealed the Boren amendment (the Boren amendment limited states’ leeway in constraining Medicaid nursing facility spending). Researchers recently examined trends in Medicaid payments from 1998 to 2002 (Grabowski et al. 2004). They found that there was moderate variation across states in changes in Medicaid payment levels, and that in general Medicaid payment rates rose fairly steadily over this period. Perhaps more im-portantly, they found no major shifts over this period in Medicaid payment methods (e.g. from cost reimbursement to prospective payment). In the models presented here, none of the coeffi-cients on the state dummies is statistically signif-icant, which is consistent with the relative stability of Medicaid payments.
The staffing results may underestimate the
payment level effect if SNFs significantly de-layed changing their staffing levels in response to the new payment system. Such delays might be due either to simple inertia or to uncertainty regarding future changes in Medicare payment levels. Another concern is that changes in the composition of SNFs’ resident populations might account for the observed changes in staffing lev-els and quality measures. The analysis attempts to account for these changes by adjusting staffing levels and quality measures based on resident characteristics as recorded in the OSCAR data. Additional analyses, available from the author, show that there were shifts in the composition of SNF resident populations from 1997 to 2001, but that these shifts were small relative to the observed changes in staffing levels. This analysis is limited by including only freestanding SNFs, and by including only SNFs that remained open throughout the period examined. Future research could focus on hospital-based SNFs and SNFs that opened and closed during this period.
I experimented with several alternative empir-ical approaches and found that the staffing results are statistically quite robust, though the quality
Table 4. Quality of care regressions, SNF-level changes in selected measures of quality of care
Pressure soresa In restraintsb Deficiencies Overall payment impact
($100s, simulated) 2.27% (.52) 2.93% (1.67)* .57 (.86)
Medicare resident fraction in 1997 2.43% (.90) 1.11% (2.92) 4.09 (1.50)***
HSA-level Herfindahl index .32% (.24) 2.01% (.78) .62 (.40)
Overall payment impact ($100s, simulated) *
HSA-level Herfindahl index 2.37% (1.55) 211.4% (5.01)** .69 (2.58)
Medicare resident fraction in 1997 *
HSA-level Herfindahl index 2.20% (2.26) 4.60% (7.28) 27.44 (3.75)**
Nonprofit .10% (.13) 22.30% (.43)*** 2.45 (.22)**
Overall payment impact
($100s, simulated) * Nonprofit 2.23% (.86) 22.44% (2.79) .06 (1.44)
Medicare resident fraction in 1997 *
Nonprofit 2.38% (1.24) 4.82% (4.02) 22.41 (2.07)
Intercept .51% (.84) 22.41% (2.72) 4.04 (1.40)***
R2 .0183 .0626 .0969
Dependent mean 2.03% 21.82% 1.47
Notes:N¼9,748. Weighted by total resident days in 1997. Standard errors are in parentheses.
Measures of quality of care are adjusted for case mix among all residents (Medicare and non-Medicare) as described in the text. All models include state dummies (coefficients not shown).
aPercentage of residents who have a pressure sore (excluding stage 1) and did not have a pressure sore on admission. b
Percentage of residents who are physically restrained and who did not have orders for restraints on admission. *P< .10.
**P< .05. ***P< .01.
results are less robust. One alternative model that yielded substantially similar results used the actual Medicare and overall payment impacts rather than simulated payment impacts. I also found similar results using raw staffing measures (rather than those adjusted for case mix). Results also changed little if the models included a measure of the SNF-level difference from 1997 to 2001 in Medicare resident fraction.
Discussion
This paper analyzes the effects of Medicare’s new SNF PPS on payments, payer mix, staffing, and quality of care at freestanding nursing facili-ties. I find that payment levels, which generally increased, had a positive but small association with changes in staffing levels. The magnitude of the payment level effect did not vary with ownership status or with market competitiveness, which does not support predictions from theory. I find a large prospective payment effect on staff-ing, indicating that the elimination of cost reim-bursement was associated with a large decline in staffing. The magnitude of the prospective payment effect for staffing was much smaller among nonprofits compared to for-profits, which is consistent with theory. These two payment effects partially offset each other; thus, despite a sizable increase in Medicare payment levels, staffing remained fairly stable.
This analysis has several limitations. Due to the data, only a limited set of quality measures are available over the period examined. Of the three quality measures used, two depend on unaudited facility-reported data, and the three together cap-ture only narrow aspects of nursing home quality. Research on current trends in nursing home qual-ity would benefit from the availabilqual-ity of much richer data sources. Also, the analysis identifies changes in staffing patterns between two points in time, but does not identify the timing of those changes. Examining longer time periods could produce different results if staffing responses lagged substantially behind payment changes.
It is informative to compare Medicare payment policy for SNFs versus acute care hospitals. Both the SNF PPS and the acute care hospital PPS mix high- and low-powered elements. The SNF PPS is high-powered with respect to nursing costs per resident day (meaning that payments do not vary with nursing costs), but is low-powered with
respect to length of stay and rehabilitation therapy costs per day. The acute care hospital PPS is high-powered with respect to length of stay, but has low-powered elements (i.e., procedure-based diagnosis-related group [DRG] codes and outlier payments). The question is whether these two payment systems are appropriately ‘‘powered,’’ given the very different institutional settings. Most freestanding SNFs are for-profits and mem-bers of chains, while hospitals are predominately nonprofit and independent. The workforces also differ sharply, with freestanding SNFs having a largely low-paid workforce and little physician involvement.
The key insight from Ellis and McGuire (1986) is that if providers do not act as agents on their patients’ behalf and have a strong profit orientation, then the optimal payment system would incorporate an element of cost reimburse-ment (i.e., would not be too high-powered). This argument is particularly salient in settings where there is little ‘‘consumerism’’—that is, the de-mand response to quality is weak. Nursing facil-ities, where most residents are immobile and/or mentally incapacitated, certainly fall into this category. This paper shows that nursing facilities, particularly those that are for-profit, respond strongly to a switch to a high-powered payment system. The policy question, then, is whether the SNF PPS is too high-powered.
Looking ahead, policymakers should be con-cerned about the possibility of a downward pay-ment ratchet occurring in Medicare paypay-ments to SNFs. Medicare payments to most freestanding SNFs increased substantially with the new PPS, while nurse staffing levels were essentially un-changed. These factors have contributed to high Medicare margins for freestanding SNFs in re-cent years (Medicare Payment Advisory Com-mission 2004). High margins will tend to put pressure on policymakers to reduce payments which, as demonstrated in this research, will lead to decreases in staffing levels. The question is whether there is some mechanism in place to off-set this downward ratchet—perhaps altruistic concern for residents’ well-being on the part of providers, mandated minimum staffing levels, concern over litigation, or a ‘‘consumerist’’ de-mand response.
If policymakers want to add an element of cost reimbursement within the existing payment framework they have several options. One
option would be to implement an outlier provi-sion similar to the one used in Medicare’s acute care hospital PPS. This approach would help shield nursing facilities from financial losses due to unusually costly individuals.10 Another option would be to implement an explicit partial cost reimbursement system. Under such an ar-rangement, payments would equal a base amount plus some fraction of the difference between costs incurred and the base amount. The base amount could be determined in the same way the current prospective payments are determined (i.e., a base payment rate adjusted for local wages and facility-specific case mix). Such an
arrange-ment would dampen nursing facilities’ incentives to reduce costs because they would be reim-bursed for some fraction of costs incurred. A third option would be to alter the case-mix classi-fication system to better account for the costs of non-therapy ancillaries and nurse staffing. The outlier provision and partial cost reimbursement arrangements involve direct (though partial) cost reimbursement, in the sense that payments would be based partly on actual costs incurred. Case-mix classification differs in that payments are ad-justed for the expected costs of providing appro-priate care without taking into account actual costs incurred.
Notes
The author is grateful to Joseph Newhouse, David Cutler and Joan Buchanan for their invaluable help at every stage of this research project. The author also is grateful to Sally Kaplan, Mohan Ramanujan, Jus-tine Larson, and Meredith Rosenthal. This research was supported by pre-doctoral fellowships from the Agency for Healthcare Research and Quality and the National Institute on Aging and a post-doctoral fellowship from the National Institute on Aging.
The views expressed in this paper are those of the author and should not be interpreted as those of the Congressional Budget Office.
1 We can examine the implications of the FOC in four extreme cases, where each case is defined by the nursing facility’s profit orientation (g) and the demand response (N9).
Case 1. Nursing facility is purely profit-oriented (g¼0), and there is no demand response (N9¼0). In this case, the FOC simplifies to:
Nð1bÞ ¼0 ð9Þ The FOC in this case is not particularly helpful, but the behavioral predictions are simple. First, note that under cost reimbursement (a¼0,b¼ 1), the FOC is satisfied and profits are 0 regardless of the level of costs. I will assume, then, that under cost reimbursement, costs are very high (techni-cally,þ‘). Under cost-plus (b.1) costs are also þ‘, and in all other cases (b, 1) costs are at the minimum (c). The key features of this case are that costs bear no relationship to payment levels, and that a change from cost reimbursement or cost-plus to prospective payment will lead to a substantial reduction in costs (from very high to the minimum).
Case 2. Nursing facility is purely profit-oriented (g¼0), and there is a positive demand response
(N9 .0). With some rearranging, the FOC in this case simplifies to:
c¼ ½h=ð1þhÞ½a=ð1bÞ ð10Þ wherehrepresents the elasticity of the number of residents with respect to costs incurred. In this case, like in case 1, cost reimbursement (a¼0,
b¼1) implies that the FOC is satisfied and profits are 0 regardless of the level of costs. This case dif-fers from case 1 in the following way: under pro-spective payment (b¼0) the level of costs may (depending on whether the minimum cost con-straint binds) increase with the payment level (a). Case 3. Nursing facility is purely altruistic (g¼1), and there is no demand response (N9¼0). The FOC in this case simplifies to:
H9¼0 ð11Þ This FOC implies that costs will be determined either by the ‘‘flat of the curve’’ (no health returns to additional costs) or by the revenue constraint (assuming that the minimum cost constraint is set below the flat of the curve). In this case, a revenue-neutral shift inbwill not result in any change in costs. Under prospective payment there will, how-ever, be a strong payment level effect (assuming that the payment level is below the flat of the curve and, therefore, that the revenue constraint binds).
Case 4. Nursing facility is purely altruistic (g¼1), and there is a positive demand response (N9 .0). The FOC in this case simplifies to:
c*¼ hðH=H9Þ ð12Þ This case is similar to case 3. A revenue-neutral shift inbwill not affect costs, but under prospec-tive payment there may be a strong payment level effect.
between 1997 and 2001, I use a differences ap-proach rather than a full panel data analysis. The SNF PPS was phased in over several years during which payments were based on a blend of each SNF’s historical costs (trended forward using an in-flation factor) and the case mix-adjusted ‘‘federal’’ rate. I chose to exclude the transition years for two reasons: payment impacts were relatively small dur-ing the intervendur-ing years (because of the blended payments), and I was not sure whether to expect SNF staffing responses to lag behind payment changes or precede payment changes (or both). 3 Additional analyses (not shown) suggest that the
facility-level Medicare resident fractions were relatively stable over the period studied, and that although the Medicare resident fraction appears to respond to changes in Medicare payment levels, the magnitude of this response was relatively small.
4 Some nursing facilities have fiscal years that do not coincide with the calendar year. For these fa-cilities, I calculated calendar-year measures by weighting each cost report by the fraction of the calendar year it includes.
5 The OSCAR data are generated in conjunction with the annual inspection process conducted by state regulators. These staffing and resident data are reported by the facilities and are not audited.
6 Wages for each type of nurse are from the Bureau of Labor Statistics’ Occupational Employment Statistics (Bureau of Labor Statistics 2002). For fringe benefits, I use a nurse-specific 38.3% fringe rate, which is calculated by dividing 2001 total benefits by 2001 wages and salaries using data for all civilian nurses from the Bureau of Labor Statistics’ Employer Costs for Employee Compen-sation Survey (Bureau of Labor Statistics 2003). 7 A survey was included only if: CNAs per resident is
between .1 and 4, LPNs per resident is between 0 and 1, RNs per resident is between 0 and 1, reha-bilitation therapists per resident is between 0 and 1, total staff per resident is between .2 and 8, and occupancy is between 25% and 120%.
8 New pressure sores and new restraints mean that the resident did not have a pressure sore or orders for restraints on admission, respectively. Stage I pressure sores are excluded.
9 Nurse staffing costs include wages and fringe benefits for CNAs, LPNs, and RNs.
10 Nontherapy ancillary costs (e.g., pharmaceuticals) exhibit much higher variation across nursing facil-ity residents than do staffing costs (White, Pizer and White 2002). An outlier provision, therefore, would serve mainly as protection for the nursing facility against unusually high nontherapy ancillary costs.
References
American Health Care Association. 1999. American Health Care Association: LTC Providers Call for Immediate Action to Protect Patients. Available at: http: //www.ahca.org/brief/archived_releases/ nr99310b.pdf. Accessed September 12, 2002. Bureau of Labor Statistics. 2002. Bureau of Labor
Statistics: 2001 National Occupational Employ-ment and Wage Estimates, Healthcare Practi-tioners and Technical Occupations, Available at: http://www.bls.gov/oes/2001/oes_29He.htm. Ac-cessed May 28, 2003.
——— 2003. Bureau of Labor Statistics: Employer Costs for Employee Compensation (Nurses, All Civilian), Available at: http://data.bls.gov/labjava/ outside.jsp?survey¼cc. Accessed September 9, 2003.
Centers for Medicare & Medicaid Services (CMS). 2003. Nursing Home Quality Initiative: Overview, Available at: http://www.cms.hhs.gov/quality/ nhqi/OverView20030731.pdf.
Chou, S.-Y. 2002. Asymmetric Information, Owner-ship and Quality of Care: An Empirical Analysis of Nursing Homes.Journal of Health Economics
21(2): 293–311.
Cohen, J.W., and W.D. Spector. 1996. The Effect of Medicaid Reimbursement on Quality of Care in Nursing Homes. Journal of Health Economics
15(1): 23–48.
Committee on Ways and Means. 2000. Green Book: Background Material and Data on Programs
within the Jurisdiction of the Committee on Ways and Means. Washington, D.C.: U.S. House of Representatives.
Cutler, D.M. 1995. The Incidence of Adverse Medical Outcomes Under Prospective Payment. Econo-metrica63(1): 29–50.
Ellis, R.P., and T.G. McGuire. 1986. Provider Behavior under Prospective Reimbursement: Cost Sharing and Supply.Journal of Health Economics
5(2): 129–151.
Feder, J., J. Hadley, and S. Zuckerman. 1987. How Did Medicare’s Prospective Payment System
Affect Hospitals? New England Journal of
Medicine317(14): 867–873.
Federal Reserve Bank of St. Louis. 2004. U.S. Department of Commerce: Bureau of Economic Analysis: Gross Domestic Product: Implicit Price Deflator (GDPDEF). Available at: http:// research.stlouisfed.org/fred2/series/GDPDEF/ downloaddata/GDPDEF.xls. Accessed May 6, 2004.
Fries, B.E., D.P. Schneider, W.J. Foley, M. Gavazzi, R. Burke, and E. Cornelius. 1994. Refining a Case-Mix Measure for Nursing Homes: Re-source Utilization Groups (RUG-III). Medical Care32(7): 668–685.
Gabrel, C., and A. Jones. 2000. The National Nurs-ing Home Survey: 1997 Summary. Vital and Health Statistics, Series 13, No. 147, Hyattsville, M d : U . S . D e p a r t m e n t o f H e a l t h a n d
Human Services, Centers for Disease Control and Prevention, National Center for Health Statistics. Gertler, P.J. 1985a. Regulated Price
Discrimina-tion and Quality: The ImplicaDiscrimina-tions of Medicaid Reimbursement Policy for the Nursing Home Industry. NBER Working Paper. Cambridge, Mass.: National Bureau of Economic Research. ———. 1985b. Subsidies, Quality and Regulation in
the Nursing Home Industry. NBER Working Paper. Cambridge, Mass.:NBER.
———. 1992. Medicaid and the Cost of Improving
Access to Nursing Home Care. Review of
Economics and Statistics74(2): 338–345. Grabowski, D.C. 2001. Medicaid Reimbursement and
the Quality of Nursing Home Care. Journal of Health Economics20(4): 549–569.
Grabowski, D.C., Z. Feng, O. Intrator, and V. Mor. 2004. Recent Trends In State Nursing Home Payment Policies. Health Affairs web exclusive: hlthaff.w4.363.
Grabowski, D.C., and R.A. Hirth. 2003. Competi-tive Spillovers across Non-profit and For-profit Nursing Homes. Journal of Health Economics
22(1): 1–22.
Hing, E. 1981. Characteristics of Nursing Home Residents, Health Status, and Care Received: National Nursing Home Survey United States, May-December 1977. Vital and Health Statistics, Series 13, Number 51. DHHS publication; no. (PHS) 81-1712. Hyattsville, MD: National Center for Health Statistics.
Hing, E., E. Sekscenski, and G. Strahan. 1989. The National Nursing Home Survey: 1985 Summary for the United States. Vital and Health Statistics, Series 13, Number 97. Hyattsville, MD: National Center for Health Statistics.
Hodgkin, D., and T.G. McGuire. 1994. Payment Levels and Hospital Response to Prospective Payment. Journal of Health Economics 13(1): 1–29.
Institute of Medicine. 1986.Improving the Quality of Care in Nursing Homes. Washington, DC: National Academy Press.
———. 2001. Improving the Quality of Long-term Care. Washington, DC: National Academy of Sciences.
Jones, A. 2002. The National Nursing Home Survey: 1999 Summary. Vital and Health Statistics, Series 13, Number 152. Hyattsville, MD: US Depart-ment of Health and Human Services, Centers for Disease Control and Prevention, National Center for Health Statistics.
Konetzka, R.T., D. Yi, E.C. Norton, and K.E. Kilpatrick. 2004. Effects of Medicare Payment
Changes on Nursing Home Staffing and Deficien-cies.Health Services Research39(3): 463–488. Medicare Payment Advisory Commission. 2004.
Report to the Congress: Medicare Payment Policy, Washington, DC: Medicare Payment Advisory Commission.
National Center for Health Statistics. 2002. Health, United States, 2002. DHHS Publication No. 1232, Hyattsville, MD: Centers for Disease Control and Prevention.
National Citizens’ Coalition for Nursing Home Reform. 2002. National Citizens’ Coalition for Nursing Home Reform: Government Study Pro-vides ‘‘Compelling Evidence’’ For Nurse Staffing Standards in Nursing Homes, Available at: http:// nccnhr.newc.com/govpolicy/51_162_2852.CFM. Accessed June 25, 2003.
Newhouse, J.P. 2002.Pricing the Priceless: A Health Care Conundrum.Cambridge, MA: MIT Press. Nyman, J.A. 1985. Prospective and ‘‘Cost-plus’’
Medicaid Reimbursement, Excess Medicaid De-mand, and the Quality of Nursing Home Care.
Journal of Health Economics4(3): 237–259. Office of Inspector General. 1999. Quality of Care in
Nursing Homes: An Overview. OEI-02-99-00060, New York, NY: Office of Inspector General, Office of Evaluations and Inspections.
Rogers, W.H., D. Draper, K.L. Kahn, E.B. Keeler, L.V. Rubenstein, J. Kosecoff, and R.H. Brook. 1990. Quality of Care Before and After Imple-mentation of the DRG-based Prospective Payment System: A Summary of Effects. Journal of the American Medical Association 264(15): 1989– 1994.
Shen, Y.-C. 2003. The Effect of Financial Pressure on the Quality of Care in Hospitals. Journal of Health Economics22(2): 243–269.
U.S. Department of Health and Human Services. 2001. Medicare Program, Prospective Payment System and Consolidated Billing for Skilled Nursing Facilities–Update; Proposed Rule. Fed-eral Register66(91): 23983–24036.
White, C. 2003. Rehabilitation Therapy in Skilled Nursing Facilities: Effects of Medicare’s New Prospective Payment System. Health Affairs
22(3): 214–223.
White, C., S.D. Pizer, and A.J. White. 2002. Assessing the RUG-III Resident Classification System for Skilled Nursing Facilities. Health Care Financing Review24(2): 7–15.
Wodchis, W.P. 2004. Physical Rehabilitation follow-ing Medicare Prospective Payment for Skilled Nursing Facilities. Health Services Research