Deutsches Institut für Wirtschaftsforschung
www.diw.de
Matthias Keese • Hendrik Schmitz
Wi
Broke, Ill, and Obese:
The Effect of Household Debt on Health
350
SOEPpapers
on Multidisciplinary Panel Data Research
SOEPpapers on Multidisciplinary Panel Data Research
at DIW Berlin
This series presents research findings based either directly on data from the German
Socio-Economic Panel Study (SOEP) or using SOEP data as part of an internationally comparable
data set (e.g. CNEF, ECHP, LIS, LWS, CHER/PACO). SOEP is a truly multidisciplinary
household panel study covering a wide range of social and behavioral sciences: economics,
sociology, psychology, survey methodology, econometrics and applied statistics, educational
science, political science, public health, behavioral genetics, demography, geography, and
sport science.
The decision to publish a submission in SOEPpapers is made by a board of editors chosen
by the DIW Berlin to represent the wide range of disciplines covered by SOEP. There is no
external referee process and papers are either accepted or rejected without revision. Papers
appear in this series as works in progress and may also appear elsewhere. They often
represent preliminary studies and are circulated to encourage discussion. Citation of such a
paper should account for its provisional character. A revised version may be requested from
the author directly.
Any opinions expressed in this series are those of the author(s) and not those of DIW Berlin.
Research disseminated by DIW Berlin may include views on public policy issues, but the
institute itself takes no institutional policy positions.
The SOEPpapers are available at
http://www.diw.de/soeppapers
Editors:
Georg
Meran
(Dean DIW Graduate Center)
Gert G.
Wagner
(Social Sciences)
Joachim R.
Frick
(Empirical Economics)
Jürgen
Schupp
(Sociology)
Conchita
D’Ambrosio
(Public Economics)
Christoph
Breuer
(Sport Science, DIW Research Professor)
Anita I.
Drever
(Geography)
Elke
Holst
(Gender Studies)
Martin
Kroh
(Political Science and Survey Methodology)
Frieder R.
Lang
(Psychology, DIW Research Professor)
Jörg-Peter
Schräpler
(Survey Methodology)
C. Katharina
Spieß
(Educational Science)
Martin
Spieß
(Survey Methodology, DIW Research Professor)
ISSN: 1864-6689 (online)
German Socio-Economic Panel Study (SOEP) DIW Berlin
Mohrenstrasse 58 10117 Berlin, Germany
Matthias Keese and Hendrik Schmitz
1Broke, Ill, and Obese: The Eff ect of
Household Debt on Health
Abstract
We analyze the eff ect of household indebtedness on diff erent health outcomes using data from the German Socio-Economic Panel from 1999–2009. To establish a causal eff ect, we rely on (a) fi xed-eff ects methods, (b) a subsample of constantly employed individuals, and (c) lagged debt variables to rule out problems of reverse causality. We apply diff erent measures of household indebtedness, such as the percentage shares of household income spent on consumer credit and home loan repayments (which indicate the severity of household indebtedness) and a binary variable of relative overindebtedness (which indicates a precarious debt situation). We fi nd all debt measures to be strongly correlated with health satisfaction, mental health, and obesity. Controlling for unobserved heterogeneity and reversed causality we fi nd evidence that household debt also causally deteriorates physical and mental health. However, there is no causal eff ect on being obese.
JEL Classifi cation: D12, D14, I12
Keywords: Debt; health satisfaction; mental health; obesity; fi xed-eff ects
December 2010
1 Matthias Keese, Ruhr Graduate School in Economics and University of Duisburg-Essen; Hendrik Schmitz, RWI and Ruhr Graduate School in Economics. – Financial support by the RGS Econ and the Leibniz Association is gratefully acknowledged. We are grateful for comments during presentations at the 2nd annual meeting of the German association of health economists (dggoe) in Berlin, the 15th Spring Meeting of Young Economists in Luxembourg, the 2010 Annual Congress of the European Society for Population Economics in Essen, the 2010 IRDES Workshop on Applied Health Economics and Policy Evaluation in Paris, the 9th SOEP User conference in Berlin, and the RGS Workshop at the University of Duisburg-Essen. – All correspondence to Hendrik Schmitz, RWI, Hohenzollernstr. 1-3, 45128 Essen, Germany, E-Mail: hendrik.schmitz@rwi-essen.de.
1
Introduction
Household indebtedness has notably risen in the last years. In 1993, the volume of out-standing loans of banks to private households in Germany amounted to about 390 billion euros. In 1995 it exceeded 600 billion for the first time, and since 2005 it has always been
more than 1,000 billion euro with about 80 percent falling upon home loans.1 From 1998
to 2008, average consumer debt has risen from 1,300 to 1,700 euros per household. At the same time, the average mortgage debt has increased from 18,600 to 24,500 euros per household (Federal Statistical Office, 2008).
Without question, the possibility to take out a loan and to incur debt is usually welfare enhancing for the household since it enables consumption smoothing over time. However, it may also be harmful if individuals involuntarily run into financial distress or overindebtedness. This may be the case if individuals underestimate the financial burden of repaying debt in the future or if unexpected shocks like job loss or disability cause repayment arrears. Indeed, overindebtedness of private households has become a widespread phenomenon. In Germany, for instance, 2.8 million households (7.1 percent of all households) were overindebted in 2007 (Zimmermann, 2008). Indeed, the upgrowth of private indebtedness has slown down since its peak in 2006 but the recent credit crunch and the successive economic crisis might increase the number of households facing severe debt-related financial difficulties.
Apart from other problems that come along with debt-related financial problems (e.g., the intertemporal misallocation of financial resources and private insolvency), debt might affect the health status for several reasons. First, it may provoke stress and foster mental distress, especially if households are confronted with high repayments. This permanent distress may cause psychosomatic conditions and, consequently, may worsen the physical health status as well. Second, high repayment burdens tighten the financial situation. Thus, individuals may save on costly medical care utilization and health protection like, e.g., healthy food that is often seen to be more expensive than junk food.
Analyzing the effect of household debt on health is important for several reasons. If debt has adverse health effects, this will require stronger effort of policy makers to prevent households from entering a precarious debt situation. This will be particularly important if people run into a poverty trap, i.e., if deteriorated health (due to indebtedness) induces job loss which results in even higher relative debt burdens. Moreover, only the precise knowledge of which health aspect is affected by debt problems allows to react in an appropriate manner – i.e., adverse effects on mental health call for different solutions than obesity caused by debt burdens. While one solution to the first problem would be to strengthen debt counselling and to improve financial literacy, especially debt literacy
1The loan figures are taken from time series data provided by the Deutsche Bundesbank
(Lusardi and Tufano, 2009), some authors suggest to increase the availability of healthy food by low-pricing campaigns to react to obesity caused by debt problems (Münster et al., 2009).
Another reason to analyze the effects of debt on health is to learn more about the socioeconomic gradient in health. The literature consistently finds that, around the world, poorer households are in worse health but it is difficult to show that income is the reason for this (see, e.g., Adams et al., 2003; Cutler et al., 2006). Debt-related financial distress (usually correlated with low income) could be a pathway to deteriorated health and, therefore, add to the explanation of the income gradient in health.
There is strong support in the literature for a correlation between debt burdens and both bad physical and mental health, see e.g., Marmot et al. (1997), Kempson (2002), Brown et al. (2005), or Duygan-Bump and Grant (2009). However, up to now, it is not entirely clear if debt problems are also causal for health problems. In our analysis, we use data from the German Socio-Economic Panel (SOEP) for the years 1999-2009 and go beyond the existing literature that mostly provides a descriptive picture of the relationship between debt and health. There are several econometric challenges in finding causal effects of indebtedness on health. First, unobservable factors may coincide with financial problems and bad health. To rule out omitted variable bias due to unobserved heterogeneity we exploit the panel-nature of our data and use fixed-effects methods.
Second, we also address potential problems arising from reverse causality. Since the German health insurance system covers basically all medical expenses we can exclude a direct effect of health on debt due to high medical bills. However, individuals may become unemployed or be forced to leave the labor market due to an adverse health shock and, consequently, get into trouble repaying their debt. We deal with this indirect effect of health on debt problems by looking at a subsample of constantly employed individuals, thus excluding individuals that might have stopped working due to bad health. Moreover, we control for changes in household composition that are due to divorce, separation, or death of the partner. These events might have own effects on health and the financial situ-ation. Lastly, we rely on lagged debt variables to ensure that starting the debt repayment was prior to the observed health outcome so that the effect we seek to identify does indeed go from debt to health and not viceversa. In our approach we do not rely on untestable exclusion restrictions as do most of the previous studies based on instrumental-variable techniques. Therefore, we use arguably weaker identifying assumptions to establish a causal effect.
Our dependent variables are three different health measures: overall health satisfac-tion, mental health, and being obese. Our main explanatory variables are three different measures of household indebtedness: consumer debt and housing loan repayments as a share of household income as well as a binary variable for being overindebted. We find a
negative correlation between household debt and health. On average, indebted individu-als report to be less satisfied with their health status, have worse mental health, and are more likely to be obese. Controlling for unobserved heterogeneity and reverse causality, we find that household debt does indeed worsen health satisfaction and mental health. In contrast, the likelihood of being obese is not significantly affected by debt. Our results largely hold for all three debt measures. Thereby, repayments for home loans and for consumer debt exhibit broadly similar effects on health.
The paper proceeds as follows: in the second section, we provide an overview of the empirical literature on debt and health. The third section presents the data and econometric methods. Estimation results are reported in Section 4. Section 5 presents some robustness checks while Section 6 concludes.
2
Literature review
There is a vast literature on the relation between health and socio-economic status (SES), virtually always finding an income gradient in health, both within and between countries. However, the causal effect of income on health as well as potential reasons for the gradient are debated and difficult to show (see e.g., Adams et al., 2003; Cutler et al., 2006).
As an indirect effect of a life event that frequently coincides with a precarious fi-nancial situation, one strand of the literature analyzes the effects of unemployment on health. Because authors usually control for the income drop due to job loss, the effect of unemployment on health also captures non-monetary impacts, especially in countries with fairly generous unemployment insurance systems such as Germany. Job loss can be seen as a pathway for the socio-economic gradient if income per se is not causal for bad health but life events such as unemployment (usually correlated with low income) are.
The evidence on the effect of unemployment on health, however, is mixed.2
Only a few contributions deal explicitly with issues concerning household indebted-ness and health. Moreover, the causal relation between health and debt remains still unclear. Brown et al. (2005) estimate an ordered probit model with a GHQ12 score as the dependent variable that captures the answers to different questions on psychological well-being. They show that psychological distress is higher among household heads with a higher amount of outstanding non-mortgage debt using the British Household Panel Survey. In contrast, they find no significant effects for mortgage debt. However, they do not estimate a panel model and "cannot firmly establish that our parameter estimates
2See, e.g., Browning et al. (2006), Salm (2009), Kuhn and Lalive (2009), Eliason and Storrie (2009),
Sullivan and Wachter (2009) for recent international studies as well as Schmitz (2010) for a recent study using German data.
are the causal effects" (p. 657).
Using data from the British Families’ and Children’ Survey (FACS), Lenton and Mosley (2008) find an impact of being indebted on both physical and mental health. With the same dataset, Bridges and Disney (2010) find a link between perceived debt problems and self-assessed depression of mothers. Both studies account for the possible interaction between debt and health by estimating simultaneous-equation models that require strong exclusion restrictions. For instance, Bridges and Disney (2010) assume that debt directly affects the mental health status but not vice versa. Duygan-Bump and Grant (2009) use the European Community Household Panel. Their analysis of different European countries yields the finding that arrears are often followed by adverse health shocks. Drentea (2000) and Drentea and Lavrakas (2000) find associations between credit card debt and health problems, namely anxiety (the former study) as well as different subjective and objective health measures (the latter one). However, both studies are only cross-sectional and use representative but rather small samples of adults in the US state of Ohio. Webley and Nyhus (2001) focus on the economic and psychological determinants of consumer debt. Their results from dynamic analyses of Dutch panel data indicate an association between debt in previous periods and psychological outcomes in later periods. The contribution of our paper is to provide a more comprehensive analysis than is done in most of the mentioned studies. We use a large and representative household dataset, combine objective and subjective measures of mental and physical health with objective measures of household debt and use panel data techniques instead of IV approaches.
3
Data and empirical strategy
We use data from the German Socio-Economic Panel (SOEP) for the years 1999 to 2009. This dataset started in 1984 and surveyed more than 20,000 persons in about 11,000
households in the 2008 wave (Wagner et al., 2007).3 The questionnaire asks both on the
individual and on the household level. For instance, health-related variables are captured on an individual base, while we obtain information on debt in the household questionnaire only. The respective household characteristics (such as debt repayments, net household income, and household composition) are assigned to each member of the household.
We base our analysis on adult individuals below the age of 65 since the elderly usually do not take out loans in the same magnitude as working-age individuals do. At the same
3The data used in this paper were extracted using the Add-On package PanelWhiz v3.0 (Jul 2008)
for Stata. PanelWhiz was written by Dr. John P. Haisken-DeNew (john@panelwhiz.eu). The PanelWhiz generated DO le to retrieve the SOEP data used here and any Panelwhiz Plugins are available upon request. Any data or computational errors in this paper are our own. Haisken-DeNew and Hahn (2006) describe PanelWhiz in detail.
time, they naturally face more health problems. In the regression analysis it is difficult to control for these non-linear effects, i.e., for the spurious positive correlation between debt and health. Therefore, our analysis focuses on the active population.
We apply three different measures of relative indebtedness. They do not reflect debt stocks, but debt repayments. We argue that the impact of a debt burden on personal stress is reflected by the relative burden it puts on the household budget. Specifically, we argue that the share of household income dedicated to debt repayments constitutes an adequate measure of a household’s debt intensity. Consequently, the first debt measure we apply is the ratio of consumer credit repayments and household net income. The higher this measure, the higher is the relative debt burden the household faces. The second measure is the ratio of home loan repayments and household income. We include both ratios in one regression to check whether different debt types (secured housing debt vs. presumably unsecured consumer debt) exhibit different effects on health.
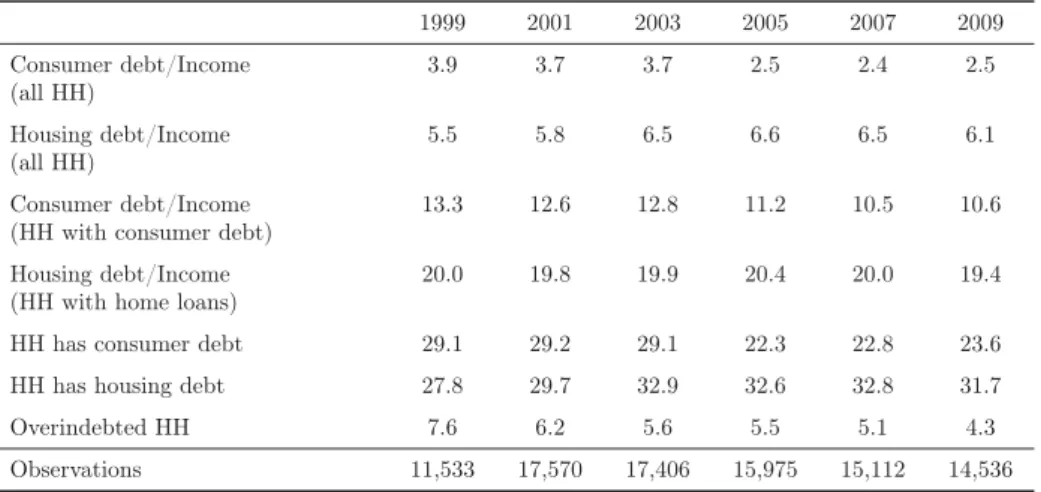
Table 1. Descriptive statistics: Indebtedness trend over time
1999 2001 2003 2005 2007 2009 Consumer debt/Income 3.9 3.7 3.7 2.5 2.4 2.5 (all HH) Housing debt/Income 5.5 5.8 6.5 6.6 6.5 6.1 (all HH) Consumer debt/Income 13.3 12.6 12.8 11.2 10.5 10.6 (HH with consumer debt)
Housing debt/Income 20.0 19.8 19.9 20.4 20.0 19.4 (HH with home loans)
HH has consumer debt 29.1 29.2 29.1 22.3 22.8 23.6 HH has housing debt 27.8 29.7 32.9 32.6 32.8 31.7 Overindebted HH 7.6 6.2 5.6 5.5 5.1 4.3 Observations 11,533 17,570 17,406 15,975 15,112 14,536
Note.All figures are in percent. Consumer debt/Income: ratio of debt repayments (consumer credit) and household net income. Housing debt/Income: ratio of debt repayments (home loans) and household net income. HH with a debt ratio larger than 0.7 excluded. Source: SOEP, 1999-2009. Own calculations.
However, while small relative debt burdens may not come along with high stress levels, a precarious financial situation may have a strong impact on personal well-being. Thus, a third debt measure is a binary variable indicating whether a household is overindebted (Zimmermann, 2007). A household will be considered overindebted if its net income after debt repayments (for home loans and consumer credit) falls below the social assistance level (and if the household is indeed indebted). Thereby, the potential social assistance a household would obtain constitutes the socially accepted subsistence level. Since the
social assistance level takes household size and composition into account, it also serves as an equalizing factor to improve the comparability of debt burdens and income between different household types. Social legislation changed several times in the last years. To ensure comparability over the entire observation period, we calculate the potential social assistance level for 2009 and deflate the computed amounts to earlier periods.
After excluding observations with unreasonably high debt ratios (more than 0.7), we use information from 32,132 individuals with 176,468 observations in person-year form. Table 1 illustrates the development of household debt in our sample over time. The average ratio of debt repayments for consumer credit and income ranges between two and four percent. For home loans, the mean ratio amounts to 5.5 to 6.5 percent. However, conditional on having a certain debt type, the mean values are notably higher: up to 13.3 (consumer debt) and 20.4 percent (housing debt), respectively. Between 22 and 29 percent of the sample live in households with consumer credit, up to 33 percent in households with home loans. The time trends of the two debt types show a somewhat different evolution. Consumer indebtedness peaked around the turn of the millennium. As for housing debt, the figures are relatively stable since the peak around 2003. The share of individuals living in overindebted households has decreased over the observation period. Nevertheless, about four to five percent of the sample lives in an overindebted household. However, these sample descriptions are possibly influenced by different factors. First, there was a major SOEP refreshment in the 2000 wave. Since then, we observe a slightly aging panel. Second, we focus on debt repayments. The evolution of debt stocks may have exhibited a different path.
The debt measures are only available at the household level. Moreover, the SOEP does not ask for the liability of the debt. Thus, we cannot identify the debitor within the household. Therefore, we attain the same debt measures to all adults in a household. We argue that this procedure is justified because a household’s debt repayment is perceptible to all household members (e.g., due to consumption reductions of all members). At the same time, all household members may derive utility from the durable and non-durable goods financed by credits. Moreover, cohabiting couples are likely to conclude their loan agreements jointly. Therefore, if debt burdens have an impact on health, these effects
should be detectable for all household members.4
As regards the health status, we employ three different measures. (1) The satisfaction with health, a self-stated measure on an 11-point scale, ranging from 0 (totally happy) to 10 (totally unhappy). (2) A mental health score between 0 and 100 (with higher values implying a worse mental health) which is calculated based on the SF12v2-questionnaire
4When we consider household heads only, we roughly lose half of the observations. However, the
regression results for this subsample are similar to the results with the full sample. We discuss this and other robustness checks in detail in the fifth section.
in the SOEP5, and (3) a binary indicator for obesity, defined as a body mass index of
more than 30. Health satisfaction is widely used in the literature to proxy the health status, e.g. by Frijters et al. (2005), Jones and Schurer (2010), or Schmitz (2010). It is subjective but it might be the preferred measure when we think of health in terms of the utility derived from it. While health satisfaction is asked in each of the years, the mental health score and the body mass index are only available biennially between 2002 and 2008. Therefore, the number of observations is smaller in these regressions using the latter two measures.
Table 2 reports means of the three health measures. According to all health measures, those who have to repay consumer debt and those who live in overindebted households are in worse health. This holds in particular for overindebted households. In contrast, households with home loans are even in better health compared to the entire sample. The average health satisfaction is slightly better (3.0 vs. 3.1 percent, respectively), the mental health scores are similar (50.0 and 50.1, respectively), and the probability of being obese is smaller (13.4 and 14.3 percent, respectively). This reflects the fact that those who are in better health and in a better financial situation are also more likely to actually get a home loan.
Table 2. Sample means of health measures
Full HH with HH with Overin- Observations sample consumer debt home loans debted HH full sample Health satisfaction 3.1 3.2 3.0 3.3 176,468 MCS 50.1 51.1 50.0 52.2 63,849 Obesity in % 14.3 16.4 13.4 17.8 65,350
Note.Source: SOEP, 1999-2009. MCS = Mental health score. Higher values = worse health. Own calculations.
Obviously, Table 2 does not tell anything about a causal effect of debt on health. Several reasons may lead to the correlation. First, observable and unobservable third factors might both affect bad health and debt. Unobservable factors could be, for instance, time preferences or risk aversion. Risk loving individuals might have a higher propensity to take out a loan. At the same time, they might care less for preventive health behavior (like
5The SF12v2-questionnaire includes several questions about health quality and health satisfaction
of individuals. The exact questions which include questions about phases of melancholy, emotional problems or social limitations due to mental health problems are given in Table A1 in the appendix. The Mental Component Summary Scale is provided by the SOEP-group and calculated using explorative factor analysis. It ranges from 0 to 100, with – originally – a higher value indicating a better health status. We recoded it in this paper. The mean value of the SOEP 2004 population is 50 points with a standard deviation of 10 points (see Andersen et al., 2007, for a description).
medical check-ups or non-smoking). Although we are able to include a rich set of covariates and, thus, control for a great deal of observable heterogeneity between financially sound and indebted households, these unobserved factors are likely to lead to biased estimates of the effect of debt on health. One solution to this endogeneity problem could be an instrumental variable approach. However, in practice, it is very hard to find convincing (that is, strong and valid) instruments. Here, we exploit the fact that we have a panel. In addition to benchmark estimations that use ordinary least squares (OLS), we control for the unobserved heterogeneity by using fixed-effects estimation methods. Thereby, we assume that the unobserved effects like risk aversion or time preferences are time-constant. We argue that the assumption of these personality traits being invariant over a short period of time is much less restrictive than the (also) non-testable assumptions of valid instruments.
A second potential reason for the observed correlation is that bad health might cause debt problems. If this is the case, the fixed-effects estimates will turn out to be biased and we overestimate possible negative health effects of debt. Reverse causality could result from several sources. Bad health increases the demand for health services. In principle, this could cause high bills for hospital treatments or expensive drugs with the need to take out a loan to pay for them. Yet, this is not a problem at all in Germany, where basically every individual has comprehensive health insurance coverage that pays for all treatments and drugs, except for fairly small copayments. However, bad health reduces the productivity, hence the ability to generate income. For instance, Arrow (1996) and Riphahn (1999) show that bad health increases the risk of job loss. Unemployment, in turn, is often seen as a trigger of overindebtedness. Indeed, Keese (2009) finds that unemployment increases the risk of overindebtedness in Germany. To take this potential problem into account we use, in one specification, a subsample of individuals who have been working constantly between 1999 and 2009. That is, we disregard all individuals who where unemployed or out of the labor force at least once in the observation period and might subsequently have problems to repay debt. By doing this, we exclude all those who possibly lost their job or left the labor market due to health problems.
Table 3 compares the subsamples of individuals who never changed their employment status between 1999 and 2009 and of individuals who did so at least once. Average health satisfaction is worse in the latter group (2.9 vs. 3.3 percent). These people do also have a worse mental health score and they are more likely to be obese. Thus, the working group is healthier. The group of constantly working individuals also has, on average, higher debt repayments (consumer debt: 3.5 vs. 3.0 percent; home loans: 7.4 vs. 5.3 percent). This is due to a higher likelihood of being indebted and points to the fact that these people are more likely to actually get a credit when they demand one. Conditional on having debt repayments, the shares of debt repayments to income are very similar in both groups.
Overindebtedness, however, is much less common among those constantly participating in the labor market.
We include a wide range of control variables in our regressions, such as age, the presence of children in the household, education, employment status, health insurance status (public or private health insurance) and we distinguish between West and East Germany. In addition, we include the net equivalent household income and an indicator of being homeowner to control for effects of income and wealth (possibly correlated with having debt) on health. Importantly, we control for the marital status. The death of the partner, separation, or divorce are likely to have an impact on the health status. In addition, loss of the breadwinner, household split-up, or funeral costs may increase debt burdens. We therefore include dummy variables for being widowed or divorced in the regression to rule out that these life events affect our results. Sample means of all covariates are reported in Table A2 in the Appendix.
Table 3. Descriptive statistics for subgroups
Always Not always employed employed Consumer debt/Income (all HH) in % 3.5 3.0 Housing debt/Income (all HH) in % 7.4 5.3 HH has consumer debt in % 28.9 24.4 HH has housing debt in % 36.8 26.8 Consumer debt/Income (HH with consumer debt) in % 12.0 12.2 Housing debt/Income (HH with home loans) in % 20.2 19.7 Overindebted HH in % 4.0 6.7 Health Satisfaction 2.9 3.3 MCS 49.5 50.7 Obese in % 13.7 14.7 Observations 78,000 98,468
Note.Source: Source: SOEP, 1999-2009. MCS = Mental health score. Higher values = worse health.
Using the subsample of constantly employed individuals rules out the possibility that ill individuals lose their job and run into financial trouble afterwards. However, it does not account for the potential problem that individuals have phases of melancholy or depression and self-medicate it by increased shopping (followed by consumer debt). Although it is debatable if the share of affected individuals is large enough to bias the results, we use, as a final specification, lagged debt variables, again with the entire sample. Together
with the fixed-effects specification this ensures that changes in debt predate changes in health. Since the interpretation of the thus estimated parameters differs somewhat from the original ones (it can be interpreted as a medium-term effect of past debt on health) this should primarily be seen as a robustness check.
4
Estimation results
Tables 4 and 5 report the estimated effects for the three health measures and the different debt measures. As a benchmark, we use ordinary least squares (OLS) to regress all health
measures on the two debt ratios and the overindebtedness indicator, respectively.6 These
results are displayed in column (1) in the tables. For the sake of brevity we only report the coefficients of the debt variables. Full estimation results are presented in Tables A2 to A7 in the appendix.
The OLS regressions show that even after controlling for a large set of covariates, indebted individuals are in worse health, according to all debt and health measures. As displayed in column (1) in Table 4, an increase in the debt-repayment-to-income ratio (consumer credit) by 10 percentage points is associated with a higher expected value of health satisfaction of 0.1692 (note again that this means worse health satisfaction). Interestingly, the unconditionally positive association between health and home loans (Table 2) turns into a negative relationship once we condition on observable variable (like household income). The respective effect is about 0.05. Being overindebted (Table 5) is associated with a 0.202 higher value of the health satisfaction variable. The same holds for mental health and obesity. The higher the debt burden, the worse is the mental health status and the more frequent is obesity. The latter relationship, however, only holds for consumer debt.
Due to potential endogeneity problems as discussed above, these benchmark results should not be interpreted as causal impacts of debt on health. Column (2) show the fixed-effects results for debt repayment (Table 4) and overindebtedness (Table 5). As expected, the sizes of the coefficients diminish notably in most specifications. Apparently, unobservable effects that both influence health and debt problems play an important role in explaining the correlation between debt and health. Still, the effects are highly significant in the health satisfaction and the mental health regression. For instance, being overindebted is associated with an increase of 0.057 of the health satisfaction variable and reduces the mental health score by 0.673. This is about one thirteenth of a standard
6Although health satisfaction is an ordered variable we use linear models instead of ordered models
for simplicity. Note that Ferrer-i-Carbonell and Frijters (2004) report that there is little difference in the resulting effects between linear fixed-effects models and their fixed-effects ordered logit.
deviation of the mental health score, thus both effects are rather moderate. Nevertheless, they are highly significant. Again, the direction of the effect of debt on health is the same for consumer credit and home loans. While the strength of the impact on health satisfaction is similar for both debt types, home loans do affect the mental health status somewhat stronger.
Table 4. Regression results: Debt repayments
Dependent Explanatory OLS FE FE FE variable variables Full sample Full sample Alw. employed Lagged vars
(1) (2) (3) (4) Health Consumer debt/ 1.692*** 0.290*** 0.216** 0.155** satisfaction Income (0.117) (0.076) (0.103) (0.078) Housing debt/ 0.534*** 0.218** 0.256** 0.160** Income (0.109) (0.086) (0.110) (0.071) MCS Consumer debt/ 7.406*** 1.607** 3.109*** 1.155 Income (0.823) (0.750) (0.988) (0.757) Housing debt/ 2.357*** 2.487*** 3.168*** 1.490** Income (0.645) (0.768) (0.987) (0.689) Obese Consumer debt/ 0.148*** -0.003 0.012 -0.030* Income (0.019) (0.017) (0.025) (0.017) Housing debt/ 0.018 0.004 0.004 0.007 Income (0.015) (0.017) (0.023) (0.015)
Note.Standard errors in parentheses; *p <0.1, **p <0.05, ***p <0.01. Source: SOEP, 1999-2009. Full estimation results in Tables A2-A7 in the appendix.
Table 5. Regression results: Overindebtedness
Dependent Explanatory OLS FE FE FE variable variables Full sample Full sample Alw. employed Lagged vars
(1) (2) (3) (4) Health Overindebted 0.203*** 0.057** 0.037 0.018 satisfaction (0.036) (0.024) (0.036) (0.023) MCS Overindebted 0.972*** 0.673*** 0.615* 0.196 (0.264) (0.234) (0.350) (0.236) Obese Overindebted 0.020*** -0.001 -0.007 0.006 (0.006) (0.005) (0.009) (0.006)
Note.Standard errors in parentheses; *p <0.1, **p <0.05, ***p <0.01. Source: SOEP, 1999-2009. Full estimation results in Tables A2-A7 in the appendix.
After controlling for fixed effects, the likelihood of being obese is not significantly af-fected neither by the magnitude of debt repayments nor by being overindebted. Therefore, the observation of a higher incidence of obesity in the group of overindebted households is apparently not caused by the debt situation but by other factors.
Our findings remain stable when we restrict the sample to individuals who constantly participated in the labor market. The fixed-effects results for this subgroup are reported in column (3) in Tables 4 and 5. For both debt-repayment-to-income ratios, there is a statistically significant effect of health satisfaction and on the mental health score. In all cases, the health status deteriorates in response to a tightened debt situation. Home loan repayments are somewhat worse for mental health than consumer credit repayments. Contrary to our expectations, the effects of debt in the subsample of individuals without a change in their employment status are stronger compared to the entire sample (for mental health). As regards obesity, we get results similar to those for the entire sample. There is no causal effect of the household’s debt situation on the probability of being obese. In contrast, the effect of overindebtedness is weakly or not significant in the restricted sample.
Column (4) in Tables 4 and 5 presents results from fixed-effects specifications with lagged debt variables (debt repayment and overindebtedness in t-1). As regards statis-tical significance, the effects of debt on health are similar to our previous findings (with two exceptions). Consumer debt and homeloan repayments have a negative impact on health satisfaction. Furthermore, housing debt has adverse effects on mental health while consumer debt has not. The latter result could be explained by a reversed causality effect from mental health to consumer debt (due to the “shopping therapy”) which is less likely in this specification and only applies to consumer debt and not to housing loans. How-ever, the estimated coefficient of 1.155 is not zero but just insignificant. Unsurprisingly, all effects in this specification are smaller since we measure contemporaneous effects of past indebtedness. In particular, lagged overindebtedness does not affect the health mea-sures significantly. Altogether, these results provide evidence that the estimation results in column (2) are not entirely driven by reversed causality.
To sum up, there is evidence for negative effects of debt on health satisfaction and mental health, but not on the likelihood of being obese. This suggests that debt and overindebtedness cause health problems via mental distress and not via the need to reduce the consumption of healthy food due to financial constraints.
Interestingly, our results are similar for both debt measures, although they differ in some aspects. While the ratios of repayments and income weight a change in relative debt repayments equally irrespective of whether the household is on a low or on an already high debt level, the indicator for overindebtedness represents a change from a sound to a precarious financial situation. The health status responds to the debt burden, irrespective
of whether it is secured (like mortgage debt) or unsecured (like consumer credit). For mental health, we find that housing debt has an even more severe impact. The reason for this difference might be that secured debt induces higher stress because it implies the loss of a property in case of consumer insolvency.
5
Robustness checks
We check for the robustness of our results by differing the health variables and the sample composition. The results of all robustness checks are not presented here but available upon request. First, we use an indicator for overweight (BMI exceeding 25) and the body-mass index as outcome variables instead of obesity. This does not affect the results at all. While overindebted individuals have a higher BMI and are more likely to be overweight, fixed-effects results show that there is no causal effect of debt on the body-mass index.
Second, we restrict the analysis to household heads only, instead of including all adult household members. This would be the preferred specification when assuming that house-hold heads make financial decisions of the househouse-hold independently and are the only household members that suffer from overindebtedness and financial distress. The results stay broadly the same. Hence, the adverse health effects of debt hold for all household members, irrespective of who the financial decision-maker is and who legally owes the debt burden.
Third, we take a closer look into the debt measures. A relative debt burden can increase due to higher debt repayments or due to reductions in income. Similarly, a household can become overindebted after a change in debt repayment, income, or subsis-tence level. It could be argued that the three different channels through which an increase in relative indebtedness may occur have different effects on health. In our data set, in most cases, an increase (or decrease) in relative indebtedness is mainly driven by changes in the debt repayment and not by changes in income. Nevertheless, we repeat our anal-ysis and exclude all observations for which income changes are the dominating factor for changes in relative indebtedness. These are about eight per cent of all observations and this sample restriction does not alter the results.
Finally, we test for another possible pathway of worse health due to debt problems. It might be that indebted individuals forego doctor visits to save on the (albeit fairly low) copayments. Therefore, we use the number of doctor visits within the last three months prior to the interview as an outcome variable and also control for the health status of the respondents. The results suggest that people in indebted households are actually more likely to attend the doctor. Thus, the hypothesis of debt causing less doctor visits – and,
thus, being one pathway for the worse health status of indebted individuals – due to the financial burden of copayments can be rejected.
6
Conclusion
We analyze the impact of household indebtedness on physical and mental health using a large and representative panel dataset, the German Socio-Economic Panel for the years 1999-2009. We use several measures that display different aspects of individual health, namely health satisfaction, a mental health score, and an indicator of obesity. Our ex-planatory variables of main interest are three measures of household debt: monthly debt repayments for consumer credit as share of household income, home loan repayments as a share of income, and a binary indicator of overindebtedness. We address several empirical challenges resulting from the complex relation of debt and health, such as endogeneity problems due to unobserved heterogeneity and potential reverse causality running from health to debt. We do this by using fixed-effects methods, by including lagged debt vari-ables, and by constructing a subsample unaffected by unemployment or a drop out of the labor market in the entire observation period.
In accordance with the existing literature, we find that indebted individuals are more likely to be in bad health. This correlation holds for all three health measures. Our results from fixed-effects regressions suggest that both health satisfaction and mental health deteriorate with the debt burdens and, similarly, are negatively affected in case the household is overindebted. While we find that obese individuals are more likely to be indebted, we do not find a causal effect of debt on obesity. The results are qualitatively the same for all debt measures indicating that unsecured debt (consumer credit) and secured debt (home loans) impose a similar pressure on the respondents’ health status. As regards the ratios of debt repayments and income, we come to similar conclusions when restricting the sample to individuals participating in the labor market over the entire observation period. Moreover, the lagged ratios of debt repayments and income have a significant effect on health (in contrast to the lagged indicator of relative overindebtedness), however, with a weaker impact compared to the contemporaneous debt measures.
Our results add to the literature on the socio-economic gradient in health. While it is difficult to show that income is causal for the worse health status of poorer individuals, indebtedness might be a pathway for the gradient, because severe indebtedness is usu-ally correlated with low income. Moreover, negative health effects of debt might cause individuals to enter a poverty trap, since bad health is shown to increase the likelihood of losing the job. In turn, unemployment further tightens the financial situation of the
indebted households.
Therefore, political action should focus more on avoiding overindebtedness. A first step can be the improvement of financial literacy, with a special focus on debt literacy (Lusardi and Tufano, 2009). Ideally, opportunities and risks associated with loan contracts, leasing, and payments by installments should become part of school curricula. Furthermore, an adequate funding of debt counselling agencies is necessary to support households affected by financial problems to reschedule debt payments. But this may not be sufficient. Before the financial crisis, the volume of unsecured credit strongly increased in the EU as well as the US, thereby fostering severe indebtedness of private households. There is empirical evidence that household debt rises in response to extended credit lines (Gross and Souleles, 2002). In the light of our results we strongly recommend further research on the costs and benefits of household debt and we encourage an intensive and more critical discussion on the spreading credit culture in Western societies. In contrast, increasing the availability of healthy food by low-pricing campaigns, as called for in the literature (Münster et al., 2009), does not seem to be an appropriate measure.
References
[1] Adams, P., Hurd, M. D., McFadden, D., Merrill, A., and Ribeiro, T., 2003. Healthy, wealthy, and wise? Tests for direct causal paths between health and socioeconomic
status.Journal of Econometrics112(1), 3-56.
[2] Andersen, H. H., Mühlbacher, A., Nübling, M., Schupp, J., and Wagner, G. G., 2007. Computation of standard values for physical and mental health scale scores using the
SOEP version of SF12v2. Journal of Applied Social Science (Schmollers Jahrbuch)
127(1), 171-182.
[3] Arrow, J., 1996. Estimating the influence of health as a risk factor on unemployment: A survival analysis of employment durations for workers surveyed in the German
Socio-Economic Panel (1984-1990).Social Science and Medicine 42(12), 1651-1659.
[4] Bridges, S. and Disney, R., 2010. Debt and depression.Journal of Health Economics
29(3), 388-403.
[5] Brown, S., Taylor, K., and Wheatley Price, S., 2005. Debt and distress: Evaluating
the psychological cost of credit.Journal of Economic Psychology 26(5), 642-663.
[6] Browning, M., Moller Dano, A., and Heinesen, E., 2006. Job displacement and
[7] Cutler, D., Deaton, A., and Lleras-Muney, A., 2006. The determinants of mortality.
Journal of Economic Perspectives 20(3), 97-120.
[8] Drentea, P., 2000. Age, debt and anxiety. Journal of Health and Social Behavior
41(4), 437-450.
[9] Drentea, P. and Lavrakas, P. J., 2000. Over the limit: The association among health,
race and debt.Social Science and Medicine 50(4), 517-529.
[10] Duygan-Bump, B. and Grant, C., 2009. Household debt repayment behaviour: What
role do institutions play? Economic Policy 24(57), 107-140.
[11] Eliason, M. and Storrie, D., 2009. Does job loss shorten life? Journal of Human
Resources 4, 277-302.
[12] Federal Statistical Office, 2008. Wirtschaftsrechnungen, Einkommens- und
Ver-brauchsstichprobe, Geld- und Immobilienvermögen sowie Schulden privater
Haushalte. Fachserie 15, Heft 2. Wiesbaden.
[13] Ferrer-i-Carbonell, A. and Frijters, P. (2004). How important is the methodology for
the estimates of the determinants of happiness? Economic Journal114(497):641–659.
[14] Frijters, P., Haisken-DeNew, J. P., and Shields, M. A. (2005). The causal effect
of income on health: Evidence from German reunification.Journal of Health
Eco-nomics24(5), 997–1017.
[15] Gross, D. B. and Souleles, N. S., 2002. Do liquidity constraints and interest rates
matter for consumer behavior? Evidence from credit card data. Quarterly Journal
of Economics 117(1), 149-185.
[16] Haisken-DeNew, J. P. and Hahn, M., 2006. Panelwhiz: A exible modularized Stata interface for accessing large-scale panel data sets. http://www.panelwhiz.eu. [17] Jones, A. M. and Schurer, S. (2010). How does heterogeneity shape the socioeconomic
gradient in health satisfaction? Journal of Applied Econometrics (forthcoming,
pub-lished online: 14 Dec 2009, doi: 10.1002/jae.1134).
[18] Keese, M., 2009. Triggers and determinants of severe household indebtedness in Ger-many. Ruhr Economic Paper #150.
[19] Kempson, E., 2002. Over-indebtedness in Britain. A report to the department of trade and industry. London: Department of Trade and Industry.
[20] Kuhn, A. and Lalive, R., 2009. The public health costs of job loss.Journal of Health
[21] Lenton, P. and Mosley, P., 2008. Debt and health. University of Sheffield, Department of Economics, Working Paper #2008004.
[22] Lusardi, A. and Tufano, P., 2009. Debt literacy, financial experiences, and overindebt-edness. National Bureau of Economic Research Working Paper #14808.
[23] Marmot, M., Ry, C. D., Bumpass, L. L., Shipley, M., and Marks, N. F., 1997. Social
inequalities in health: Next questions and converging evidence. Social Science and
Medicine44(6), 901-910.
[24] Munster, E., Rueger, H., Ochsmann, E., Letzel, S., and Toschke, A. M., 2009. Overindebtedness as a marker of socioeconomic status and its association with
obe-sity: A cross-sectional study.BMC Public Health 92(9), 286.
[25] Riphahn, R. T., 1999. Income and employment effects of health shocks. A test case
for the German welfare state.Journal of Population Economics 12(3), 363-389.
[26] Salm, M., 2009. Does job loss cause ill health? Health Economics 18(9), 1075-1089.
[27] Schmitz, H., 2010. Why are the unemployed in worse health? The causal effect of
unemployment on health.Labour Economics (forthcoming).
[28] Sullivan, D. and von Wachter, T., 2009. Job displacement and mortality: An analysis
using administrative data.Quarterly Journal of Economics124(3), 1265-1306.
[29] Wagner, G. G., Frick, J. R., and Schupp, J., 2007. The German Socio-Economic
Panel Study (SOEP): Scope, evolution, and enhancements.Journal of Applied Social
Science Studies (Schmollers Jahrbuch)127(1), 139-169.
[30] Webley, P. and Nyhus, E. K., 2001. Life-cycle and dispositional routes into problem
debt.British Journal of Psychology 92, 423-446.
[31] Zimmermann, G. E., 2007. Wer ist überschuldet und was sind die Ursachen der Überschuldung. In: Schufa (ed.), 2007. Schuldenkompass 2007. Wiesbaden, 91-116. [32] Zimmermann, G. E., 2008. Entwicklung des Ausmasses überschuldeter
Pri-vathaushalte 2007. In: Schufa (ed.), 2008. Schuldenkompass 2008. Wiesbaden, 121-129.
Appendix
Table A1. Sample summary statistics
Variable Mean S.D. Min Max Health Satisfaction 3.115 2.126 0 10 MCS 50.144 9.772 22.23 98.73 Obesity 0.143 0.350 0 1 Consumer debt/Income 0.032 0.071 0 0.7 Home loans/Income 0.062 0.113 0 0.7 Overindebtedness 0.055 0.228 0 1 Age 41.940 13.331 17 65 Log. equiv. HH income 7.378 0.500 0 11.18 Homeowner 0.512 0.500 0 1 Years of education 11.824 3.334 0 18 Male 0.485 0.500 0 1 Married 0.606 0.489 0 1 Widowed 0.021 0.142 0 1 Divorced 0.078 0.268 0 1 Children in HH 0.366 0.482 0 1 Foreign 0.085 0.279 0 1 West 0.755 0.430 0 1 Unemployed 0.082 0.275 0 1 Out of labor force 0.236 0.425 0 1 Education/Vocational training 0.070 0.254 0 1 Part time 0.121 0.326 0 1 Blue collar 0.198 0.399 0 1 Selfemployed 0.066 0.248 0 1 Civil servant 0.052 0.221 0 1 Private health insurance 0.138 0.345 0 1 Observations 176,468
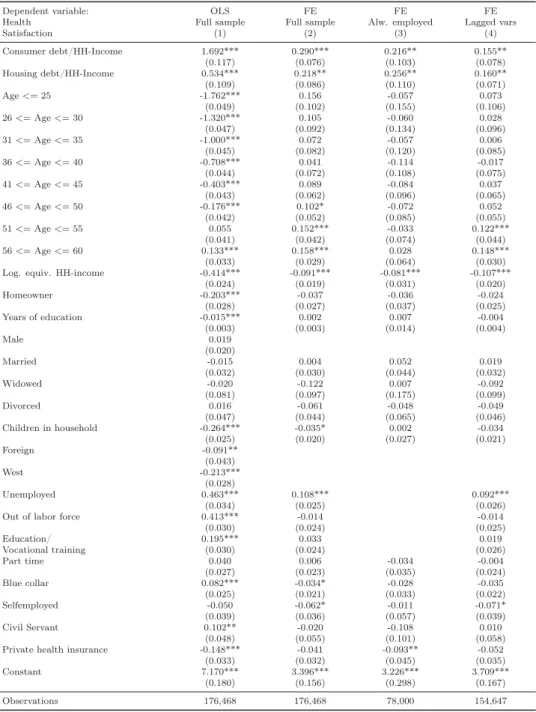
Table A2. Regression results: Health satisfaction - Debt repayments
Dependent variable: OLS FE FE FE
Health Full sample Full sample Alw. employed Lagged vars
Satisfaction (1) (2) (3) (4) Consumer debt/HH-Income 1.692*** 0.290*** 0.216** 0.155** (0.117) (0.076) (0.103) (0.078) Housing debt/HH-Income 0.534*** 0.218** 0.256** 0.160** (0.109) (0.086) (0.110) (0.071) Age<=25 -1.762*** 0.156 -0.057 0.073 (0.049) (0.102) (0.155) (0.106) 26<=Age<=30 -1.320*** 0.105 -0.060 0.028 (0.047) (0.092) (0.134) (0.096) 31<=Age<=35 -1.000*** 0.072 -0.057 0.006 (0.045) (0.082) (0.120) (0.085) 36<=Age<=40 -0.708*** 0.041 -0.114 -0.017 (0.044) (0.072) (0.108) (0.075) 41<=Age<=45 -0.403*** 0.089 -0.084 0.037 (0.043) (0.062) (0.096) (0.065) 46<=Age<=50 -0.176*** 0.102* -0.072 0.052 (0.042) (0.052) (0.085) (0.055) 51<=Age<=55 0.055 0.152*** -0.033 0.122*** (0.041) (0.042) (0.074) (0.044) 56<=Age<=60 0.133*** 0.158*** 0.028 0.148*** (0.033) (0.029) (0.064) (0.030) Log. equiv. HH-income -0.414*** -0.091*** -0.081*** -0.107***
(0.024) (0.019) (0.031) (0.020) Homeowner -0.203*** -0.037 -0.036 -0.024 (0.028) (0.027) (0.037) (0.025) Years of education -0.015*** 0.002 0.007 -0.004 (0.003) (0.003) (0.014) (0.004) Male 0.019 (0.020) Married -0.015 0.004 0.052 0.019 (0.032) (0.030) (0.044) (0.032) Widowed -0.020 -0.122 0.007 -0.092 (0.081) (0.097) (0.175) (0.099) Divorced 0.016 -0.061 -0.048 -0.049 (0.047) (0.044) (0.065) (0.046) Children in household -0.264*** -0.035* 0.002 -0.034 (0.025) (0.020) (0.027) (0.021) Foreign -0.091** (0.043) West -0.213*** (0.028) Unemployed 0.463*** 0.108*** 0.092*** (0.034) (0.025) (0.026)
Out of labor force 0.413*** -0.014 -0.014
(0.030) (0.024) (0.025) Education/ 0.195*** 0.033 0.019 Vocational training (0.030) (0.024) (0.026) Part time 0.040 0.006 -0.034 -0.004 (0.027) (0.023) (0.035) (0.024) Blue collar 0.082*** -0.034* -0.028 -0.035 (0.025) (0.021) (0.033) (0.022) Selfemployed -0.050 -0.062* -0.011 -0.071* (0.039) (0.036) (0.057) (0.039) Civil Servant 0.102** -0.020 -0.108 0.010 (0.048) (0.055) (0.101) (0.058) Private health insurance -0.148*** -0.041 -0.093** -0.052 (0.033) (0.032) (0.045) (0.035) Constant 7.170*** 3.396*** 3.226*** 3.709***
(0.180) (0.156) (0.298) (0.167) Observations 176,468 176,468 78,000 154,647
Note.Standard errors in parentheses; *p <0.1, **p <0.05, ***p <0.01. Source: SOEP, 1999-2009. Year dummies included. Male, Foreign, West dropped in fixed-effects regressions because they are not time-varying.
Table A3. Regression results: Health satisfaction - Overindebtedness
Dependent variable: OLS FE FE FE
Health Full sample Full sample Alw. employed Lagged vars
Satisfaction (1) (2) (3) (4) Overindebted 0.203*** 0.057** 0.037 0.018 (0.036) (0.024) (0.036) (0.023) Age<=25 -1.712*** 0.144 -0.076 0.074 (0.049) (0.103) (0.156) (0.107) 26<=Age<=30 -1.264*** 0.096 -0.072 0.032 (0.047) (0.092) (0.135) (0.096) 31<=Age<=35 -0.939*** 0.068 -0.063 0.011 (0.044) (0.082) (0.120) (0.085) 36<=Age<=40 -0.649*** 0.040 -0.118 -0.015 (0.044) (0.072) (0.108) (0.075) 41<=Age<=45 -0.354*** 0.089 -0.087 0.036 (0.043) (0.062) (0.096) (0.066) 46<=Age<=50 -0.143*** 0.099* -0.075 0.051 (0.042) (0.052) (0.085) (0.055) 51<=Age<=55 0.078* 0.151*** -0.036 0.118*** (0.041) (0.042) (0.074) (0.044) 56<=Age<=60 0.149*** 0.157*** 0.028 0.145*** (0.033) (0.029) (0.064) (0.030) Log. equiv. HH-income -0.393*** -0.096*** -0.092*** -0.107***
(0.024) (0.019) (0.031) (0.020) Homeowner -0.162*** -0.004 0.006 -0.009 (0.024) (0.023) (0.031) (0.025) Years of education -0.017*** 0.002 0.005 -0.004 (0.003) (0.003) (0.013) (0.004) Male 0.024 (0.020) Married 0.010 0.011 0.061 0.018 (0.032) (0.031) (0.044) (0.032) Widowed 0.010 -0.108 0.016 -0.099 (0.082) (0.098) (0.177) (0.100) Divorced 0.048 -0.060 -0.044 -0.058 (0.047) (0.044) (0.065) (0.046) Children in household -0.259*** -0.034* 0.004 -0.034 (0.025) (0.020) (0.027) (0.021) Foreign -0.084* (0.044) West -0.225*** (0.028) Unemployed 0.446*** 0.105*** 0.095*** (0.035) (0.025) (0.026)
Out of labor force 0.391*** -0.017 -0.009
(0.030) (0.024) (0.025) Education/Vocational training 0.187*** 0.030 0.024 (0.030) (0.024) (0.026) Part time 0.030 0.004 -0.040 -0.000 (0.027) (0.023) (0.035) (0.024) Blue collar 0.083*** -0.032 -0.022 -0.035 (0.025) (0.021) (0.033) (0.022) Selfemployed -0.043 -0.068* -0.015 -0.073* (0.039) (0.036) (0.058) (0.039) Civil Servant 0.100** -0.017 -0.111 0.021 (0.049) (0.055) (0.100) (0.058) Private health insurance -0.148*** -0.044 -0.101** -0.050 (0.033) (0.032) (0.045) (0.035) Constant 7.062*** 3.447*** 3.334*** 3.712***
(0.183) (0.157) (0.296) (0.167) Observations 175,730 175,730 77,669 153,628
Note.Standard errors in parentheses; *p <0.1, **p <0.05, ***p <0.01. Source: SOEP, 1999-2009. Year dummies included. Male, Foreign, West dropped in fixed-effects regressions because they are not time-varying.
Table A4. Regression results: Mental health - Debt repayments
Dependent variable: OLS FE FE FE
Full sample Full sample Alw. employed Lagged vars
MCS (1) (2) (3) (4) Consumer debt/Income 7.406*** 1.607** 3.109*** 1.155 (0.823) (0.750) (0.988) (0.757) Housing debt/Income 2.357*** 2.487*** 3.168*** 1.490** (0.645) (0.768) (0.987) (0.689) Age<=25 1.301*** 2.524*** 2.351* 2.218** (0.296) (0.878) (1.283) (0.924) 26<=Age<=30 2.449*** 2.753*** 2.588** 2.422*** (0.282) (0.785) (1.119) (0.825) 31<=Age<=35 3.092*** 2.621*** 2.108** 2.396*** (0.269) (0.695) (0.985) (0.734) 36<=Age<=40 3.285*** 2.723*** 2.282*** 2.564*** (0.262) (0.607) (0.864) (0.643) 41<=Age<=45 3.141*** 2.537*** 2.206*** 2.469*** (0.252) (0.524) (0.750) (0.555) 46<=Age<=50 2.909*** 2.044*** 1.543** 1.947*** (0.246) (0.438) (0.643) (0.465) 51<=Age<=55 2.734*** 1.811*** 1.493*** 1.720*** (0.237) (0.343) (0.537) (0.366) 56<=Age<=60 1.671*** 1.255*** 1.048** 1.316*** (0.210) (0.232) (0.427) (0.248) Log. equiv. HH-income -1.890*** -0.648*** -0.298 -0.904***
(0.137) (0.183) (0.268) (0.192) Homeowner -0.312* -0.560** -0.823*** -0.349 (0.162) (0.232) (0.299) (0.221) Years of education 0.055*** -0.050 -0.243* -0.101** (0.018) (0.033) (0.141) (0.041) Male -1.761*** (0.108) Married -1.341*** -1.279*** -0.952*** -1.258*** (0.190) (0.262) (0.357) (0.276) Widowed -0.397 1.836* 2.483 2.245** (0.478) (0.979) (1.775) (1.054) Divorced 0.032 -0.953** -0.970* -0.848** (0.260) (0.383) (0.517) (0.413) Children in household -0.469*** -0.115 -0.001 -0.161 (0.150) (0.174) (0.225) (0.184) Foreign -0.293 (0.265) West -0.582*** (0.160) Unemployed 0.951*** 0.536** 0.441* (0.218) (0.233) (0.241)
Out of labor force 1.061*** -0.139 -0.155
(0.173) (0.208) (0.222) Education/ 0.602*** -0.299 -0.644*** Vocational training (0.195) (0.207) (0.223) Part time -0.017 -0.312 -0.105 -0.358* (0.165) (0.199) (0.322) (0.212) Blue collar -0.102 -0.022 -0.136 -0.084 (0.147) (0.188) (0.315) (0.196) Selfemployed 0.045 -0.071 0.125 -0.192 (0.216) (0.299) (0.499) (0.327) Civil Servant 0.621** 1.112** 0.312 1.408*** (0.261) (0.476) (0.923) (0.514) Private health insurance -0.003 0.122 0.340 0.214
(0.188) (0.286) (0.385) (0.317) Constant 62.756*** 54.448*** 53.855*** 57.351***
(1.040) (1.543) (2.785) (1.641)
Observations 63,954 63,954 28,461 57,422
Note.Standard errors in parentheses; *p <0.1, **p <0.05, ***p <0.01. Source: SOEP, 1999-2009. Year dummies included. Male, Foreign, West dropped in fixed-effects regressions because they are not time-varying.
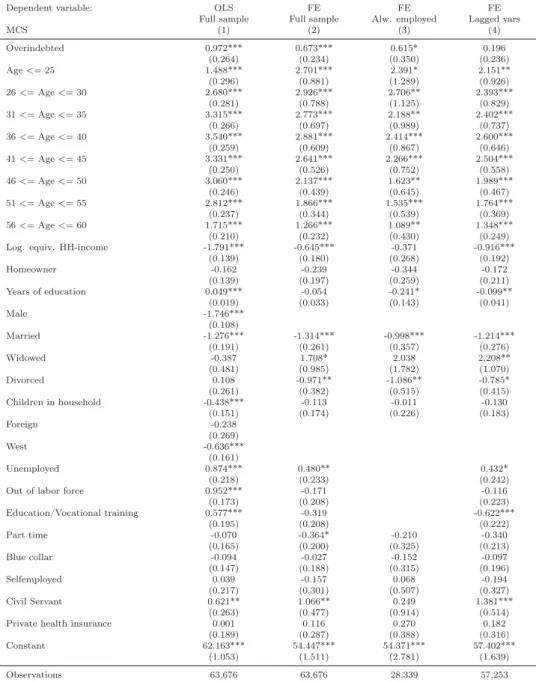
Table A5. Regression results: Mental health - Overindebtedness
Dependent variable: OLS FE FE FE
Full sample Full sample Alw. employed Lagged vars
MCS (1) (2) (3) (4) Overindebted 0.972*** 0.673*** 0.615* 0.196 (0.264) (0.234) (0.350) (0.236) Age<=25 1.488*** 2.701*** 2.391* 2.151** (0.296) (0.881) (1.289) (0.926) 26<=Age<=30 2.680*** 2.926*** 2.706** 2.393*** (0.281) (0.788) (1.125) (0.829) 31<=Age<=35 3.315*** 2.773*** 2.188** 2.402*** (0.266) (0.697) (0.989) (0.737) 36<=Age<=40 3.540*** 2.881*** 2.414*** 2.600*** (0.259) (0.609) (0.867) (0.646) 41<=Age<=45 3.331*** 2.641*** 2.266*** 2.504*** (0.250) (0.526) (0.752) (0.558) 46<=Age<=50 3.060*** 2.137*** 1.623** 1.989*** (0.246) (0.439) (0.645) (0.467) 51<=Age<=55 2.812*** 1.866*** 1.535*** 1.764*** (0.237) (0.344) (0.539) (0.369) 56<=Age<=60 1.715*** 1.266*** 1.089** 1.348*** (0.210) (0.232) (0.430) (0.249) Log. equiv. HH-income -1.791*** -0.645*** -0.371 -0.916***
(0.139) (0.180) (0.268) (0.192) Homeowner -0.162 -0.239 -0.344 -0.172 (0.139) (0.197) (0.259) (0.211) Years of education 0.049*** -0.054 -0.241* -0.099** (0.019) (0.033) (0.143) (0.041) Male -1.746*** (0.108) Married -1.276*** -1.314*** -0.998*** -1.214*** (0.191) (0.261) (0.357) (0.276) Widowed -0.387 1.708* 2.038 2.208** (0.481) (0.985) (1.782) (1.070) Divorced 0.108 -0.971** -1.086** -0.785* (0.261) (0.382) (0.515) (0.415) Children in household -0.438*** -0.113 -0.011 -0.130 (0.151) (0.174) (0.226) (0.183) Foreign -0.238 (0.269) West -0.636*** (0.161) Unemployed 0.874*** 0.480** 0.432* (0.218) (0.233) (0.242)
Out of labor force 0.952*** -0.171 -0.116
(0.173) (0.208) (0.223) Education/Vocational training 0.577*** -0.319 -0.622*** (0.195) (0.208) (0.222) Part time -0.070 -0.364* -0.210 -0.340 (0.165) (0.200) (0.325) (0.213) Blue collar -0.094 -0.027 -0.152 -0.097 (0.147) (0.188) (0.315) (0.196) Selfemployed 0.039 -0.157 0.068 -0.194 (0.217) (0.301) (0.507) (0.327) Civil Servant 0.621** 1.066** 0.249 1.381*** (0.263) (0.477) (0.914) (0.514) Private health insurance 0.001 0.116 0.270 0.182
(0.189) (0.287) (0.388) (0.316) Constant 62.163*** 54.447*** 54.371*** 57.402***
(1.053) (1.511) (2.781) (1.639)
Observations 63,676 63,676 28,339 57,253
Note.Standard errors in parentheses; *p <0.1, **p <0.05, ***p <0.01. Source: SOEP, 1999-2009. Year dummies included. Male, Foreign, West dropped in fixed-effects regressions because they are not time-varying.
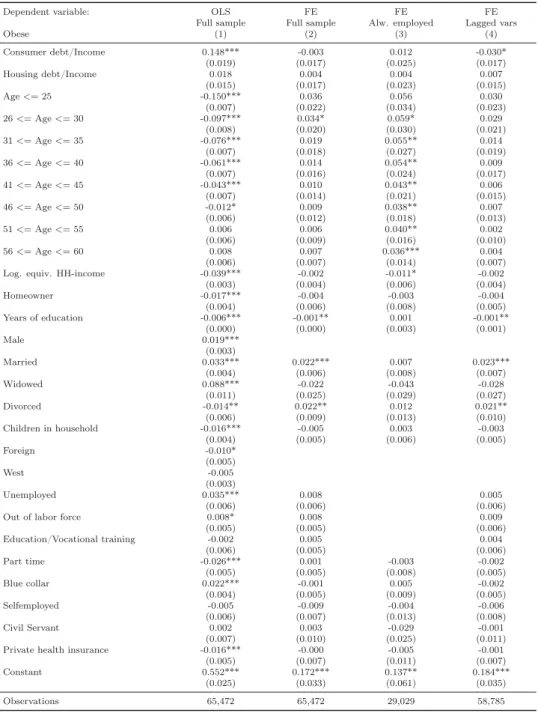
Table A6. Regression results: Obesity - Debt repayment
Dependent variable: OLS FE FE FE
Full sample Full sample Alw. employed Lagged vars
Obese (1) (2) (3) (4) Consumer debt/Income 0.148*** -0.003 0.012 -0.030* (0.019) (0.017) (0.025) (0.017) Housing debt/Income 0.018 0.004 0.004 0.007 (0.015) (0.017) (0.023) (0.015) Age<=25 -0.150*** 0.036 0.056 0.030 (0.007) (0.022) (0.034) (0.023) 26<=Age<=30 -0.097*** 0.034* 0.059* 0.029 (0.008) (0.020) (0.030) (0.021) 31<=Age<=35 -0.076*** 0.019 0.055** 0.014 (0.007) (0.018) (0.027) (0.019) 36<=Age<=40 -0.061*** 0.014 0.054** 0.009 (0.007) (0.016) (0.024) (0.017) 41<=Age<=45 -0.043*** 0.010 0.043** 0.006 (0.007) (0.014) (0.021) (0.015) 46<=Age<=50 -0.012* 0.009 0.038** 0.007 (0.006) (0.012) (0.018) (0.013) 51<=Age<=55 0.006 0.006 0.040** 0.002 (0.006) (0.009) (0.016) (0.010) 56<=Age<=60 0.008 0.007 0.036*** 0.004 (0.006) (0.007) (0.014) (0.007) Log. equiv. HH-income -0.039*** -0.002 -0.011* -0.002 (0.003) (0.004) (0.006) (0.004) Homeowner -0.017*** -0.004 -0.003 -0.004 (0.004) (0.006) (0.008) (0.005) Years of education -0.006*** -0.001** 0.001 -0.001** (0.000) (0.000) (0.003) (0.001) Male 0.019*** (0.003) Married 0.033*** 0.022*** 0.007 0.023*** (0.004) (0.006) (0.008) (0.007) Widowed 0.088*** -0.022 -0.043 -0.028 (0.011) (0.025) (0.029) (0.027) Divorced -0.014** 0.022** 0.012 0.021** (0.006) (0.009) (0.013) (0.010) Children in household -0.016*** -0.005 0.003 -0.003 (0.004) (0.005) (0.006) (0.005) Foreign -0.010* (0.005) West -0.005 (0.003) Unemployed 0.035*** 0.008 0.005 (0.006) (0.006) (0.006)
Out of labor force 0.008* 0.008 0.009
(0.005) (0.005) (0.006) Education/Vocational training -0.002 0.005 0.004 (0.006) (0.005) (0.006) Part time -0.026*** 0.001 -0.003 -0.002 (0.005) (0.005) (0.008) (0.005) Blue collar 0.022*** -0.001 0.005 -0.002 (0.004) (0.005) (0.009) (0.005) Selfemployed -0.005 -0.009 -0.004 -0.006 (0.006) (0.007) (0.013) (0.008) Civil Servant 0.002 0.003 -0.029 -0.001 (0.007) (0.010) (0.025) (0.011) Private health insurance -0.016*** -0.000 -0.005 -0.001 (0.005) (0.007) (0.011) (0.007) Constant 0.552*** 0.172*** 0.137** 0.184***
(0.025) (0.033) (0.061) (0.035)
Observations 65,472 65,472 29,029 58,785
Note.Standard errors in parentheses; *p <0.1, **p <0.05, ***p <0.01. Source: SOEP, 1999-2009. Year dummies included. Male, Foreign, West dropped in fixed-effects regressions because they are not time-varying.
Table A7. Regression results: Obesity - Overindebtedness
Dependent variable: OLS FE FE FE
Full sample Full sample Alw. employed Lagged vars
Obese (1) (2) (3) (4) Overindebted 0.020*** -0.001 -0.007 0.006 (0.006) (0.005) (0.009) (0.006) Age<=25 -0.149*** 0.034 0.053 0.033 (0.007) (0.022) (0.034) (0.024) 26<=Age<=30 -0.095*** 0.032 0.057* 0.032 (0.008) (0.020) (0.030) (0.021) 31<=Age<=35 -0.074*** 0.018 0.055** 0.017 (0.007) (0.018) (0.027) (0.019) 36<=Age<=40 -0.059*** 0.014 0.053** 0.012 (0.007) (0.016) (0.024) (0.017) 41<=Age<=45 -0.042*** 0.009 0.042** 0.009 (0.007) (0.014) (0.021) (0.015) 46<=Age<=50 -0.011* 0.008 0.038** 0.008 (0.006) (0.012) (0.018) (0.013) 51<=Age<=55 0.005 0.005 0.040** 0.004 (0.006) (0.009) (0.016) (0.010) 56<=Age<=60 0.006 0.007 0.036*** 0.006 (0.006) (0.007) (0.014) (0.008) Log. equiv. HH-income -0.037*** -0.002 -0.013** -0.002 (0.003) (0.004) (0.006) (0.004) Homeowner -0.017*** -0.004 -0.001 -0.005 (0.003) (0.005) (0.007) (0.005) Years of education -0.006*** -0.001** 0.001 -0.001** (0.000) (0.000) (0.003) (0.001) Male 0.019*** (0.003) Married 0.034*** 0.023*** 0.007 0.023*** (0.004) (0.006) (0.008) (0.007) Widowed 0.089*** -0.021 -0.042 -0.024 (0.011) (0.025) (0.029) (0.028) Divorced -0.012* 0.023** 0.014 0.022** (0.006) (0.009) (0.013) (0.010) Children in household -0.016*** -0.004 0.003 -0.003 (0.004) (0.005) (0.006) (0.005) Foreign -0.010* (0.005) West -0.006* (0.003) Unemployed 0.034*** 0.009 0.005 (0.006) (0.006) (0.006)
Out of labor force 0.007 0.009 0.009
(0.005) (0.005) (0.006) Education/Vocational training -0.003 0.006 0.005 (0.006) (0.005) (0.006) Part time -0.026*** 0.001 -0.003 -0.002 (0.005) (0.005) (0.008) (0.005) Blue collar 0.022*** -0.000 0.005 -0.002 (0.004) (0.005) (0.009) (0.005) Selfemployed -0.004 -0.009 -0.004 -0.007 (0.006) (0.008) (0.013) (0.008) Civil Servant 0.001 0.000 -0.030 -0.000 (0.007) (0.010) (0.026) (0.012) Private health insurance -0.015*** 0.001 -0.006 -0.000 (0.005) (0.007) (0.011) (0.007) Constant 0.540*** 0.168*** 0.155** 0.125***
(0.026) (0.032) (0.061) (0.036)
Observations 65,161 65,161 28,897 58,595
Note.Standard errors in parentheses; *p <0.1, **p <0.05, ***p <0.01. Source: SOEP, 1999-2009. Year dummies included. Male, Foreign, West dropped in fixed-effects regressions because they are not time-varying.
Table A8. SF-12v2 questionnaire in the SOEP Very Good Good Satis-factory Poor Bad How would you describe your current health?
Greatly Slightly Not at all
– – When you ascend stairs, i.e. go up several floors
on foot: Does your state of health affect you greatly, slightly or not at all?
And what about having to cope with other tiring everyday tasks, i.e. where one has to lift something heavy or where one requires agility: Does your state of health affect you greatly, slightly or not at all?
Please think about the last four weeks. Always Often Some- Almost Never How often did it occur within this period of
time,. . .
times never
that you felt rushed or pressed for time?
that you felt run-down and melancholy?
that you felt relaxed and well-balanced?
that you used up a lot of energy?
that you had strong physical pains?
that due to physical health problems
. . .you achieved less than you wanted to at work or in everyday tasks?
. . .you were limited in some form at work or in everyday tasks?
that due to mental health or emotional problems
. . .you achieved less than you wanted to at work or in everyday tasks?
. . .you carried out your work or everyday tasks less thoroughly than usual?
that due to physical or mental health problems you were limited socially, i.e. in contact with friends, acquaintances or relatives?