Limitations of Secure Network Coordinate Systems
1
Eric Chan-Tin, Victor Heorhiadi, Nicholas Hopper, Yongdae Kim University of Minnesota
{dchantin, victor, hopper, kyd}@cs.umn.edu
A network coordinate system assigns Euclidean “virtual” coordinates to every node in a network to allow easy estimation of network latency between pairs of nodes that have never contacted each other. These systems have been implemented in a variety of applications, most notably the popular Vuze BitTorrent client. Zage and Nita-Rotaru (at CCS 2007) and independently, Kaafaret al.(at SIGCOMM 2007), demonstrated that several widely-cited network coordinate systems are prone to simple attacks, and proposed mechanisms to defeat these attacks using outlier detection to filter out adversarial inputs. Kaafaret al. goes a step further and requires that a fraction of the network is trusted. More recently, Sherret al. (at USENIX ATC 2009) proposed Veracity, a distributed reputation system to secure network coordinate systems. We describe a new attack on network coordinate systems, Frog-Boiling, that defeats all of these defenses. Thus, even a system with trusted entities is still vulnerable to attacks. Moreover, having witnesses vouch for your coordinates as in Veracity does not prevent our attack. Finally, we demonstrate empirically that the Frog-Boiling attack is more disruptive than the previously known attacks: systems that attempt to reject “bad” inputs by statistical means or reputation cannot be used to secure a network coordinate system.
Categories and Subject Descriptors: C.2.0 [Computer-Communication Networks]: General— Security and protection
General Terms: Security, Measurement
Additional Key Words and Phrases: network coordinate, attack, secure
1. INTRODUCTION
Network coordinate systems assign virtual coordinates to every node in a network. These coordinates allow efficient estimation of the latency between any pair of nodes in the network: instead of directly measuring the O(n2) pairwise
laten-cies, each of the n nodes computes its coordinates based on the coordinates of, and the round-trip times to, a few other nodes, greatly reducing the communica-tion costs. Several possible uses of network coordinate systems include choosing peers to download from in a filesharing network [Ng and Zhang 2001], choosing peers for routing in a DHT [Dabek et al. 2004], finding the closest node in a content-distribution network [Vuze 2010], reducing the state in routers [Abraham and Malkhi 2004; Gummadi et al. 2004; Ledlie et al. 2007], reducing communica-tion among ISPs [Lumezanu et al. 2007; Choffnes and Bustamante 2008], detecting Sybil attackers [Douceur 2002; Bazzi and Konjevod 2005], performing leader elec-tion [Cowling et al. 2009], and online game matchmaking [Agarwal and Lorch 2009]. There have been several network coordinate systems proposed in the literature; these schemes can be categorized into centralized systems [Ng and Zhang 2001;
2004; Francis et al. 2001] that depend on a small set of “trusted” nodes, and decen-tralized systems [Dabek et al. 2004; Costa et al. 2004; Shavitt and Tankel 2003]. A widely-implemented and studied example of decentralized coordinate systems is Vi-valdi [Dabek et al. 2004], which has been shown to produce accurate estimations and converge quickly under various network conditions. Although it is decentralized, Vivaldi can be easily disrupted by spurious or malicious nodes, rendering the net-work coordinate system useless and impractical since the nodes’ coordinates never stabilize. Zage and Nita-Rotaru [2007] proposed a mechanism, based on real-time statistical analysis of nodes’ coordinates, to detect and discard adversarial inputs. A similar mechanism was proposed and evaluated by Kaafar et al. [2007]. Both methods rely on outlier detection using statistical models — respectively, the Ma-halanobis distance and Kalman filters — of coordinate evolution. More recently, Veracity [Sherr et al. 2009] — a decentralized reputation system, which verifies the self-reported coordinates of peers and aims at preventing peers from delaying their network measurements — was proposed as a “secure” network coordinate system. In this paper, we demonstrate the inherent challenge in designing a secure net-work coordinate system based on rejecting “bad” inputs that do not conform. We propose thefrog-boiling attack, where an adversary disrupts the network while con-sistently operating within the threshold of rejection. This is analogous to the pop-ular account that a frog put in hot water will quickly jump out but a frog placed in cold water that is gradually brought to a boil will not notice the change and boil to death. The adversary sends “small-step” fake updates (inflated RTT or coordinates) to nodes in the network. The “step” is small enough that it does not trigger either the anomaly detection or the verification methods used by Veracity, but the nodes targeted are still disrupted — their network coordinates are not ac-curate. Thus, the coordinates of the nodes in the attacked network quickly become very different from the coordinates of the same nodes in the original network. We argue that our attack generalizes since any network coordinate system will have to accept changes in coordinates due to dynamic network conditions. The effective-ness of the attack can also be significantly increased when conducted in conjunction with a Sybil attack [Douceur 2002]. We show in this paper that the frog-boiling attack is effective at disrupting the three aforementioned “secure” schemes [Zage and Nita-Rotaru 2007; Kaafar et al. 2007; Sherr et al. 2009].
We implement, and empirically evaluate, three variants of the frog-boiling attack to demonstrate its effectiveness against outlier-detection based defenses. In the
Basic-Targetedattack, a single targeted node is pushed to an arbitrary coordinate in the network; in the Network-Partition attack the network is divided into two subnetworks in coordinate space, effectively partitioning the whole network into two arbitrary smaller clusters; and in the Closest-Node attack the adversary becomes the closest neighbor to a targeted node. Partitioning a network is bad because two nodes which are close to each other in terms of network latency (for example in the same ISP) will appear to be far away from each other. If, for example, an adversary becomes the closest neighbor to every peer in a file-sharing system, the adversary will receive most of the requests in that system. All three attacks rely on a simple concept: lying can be harmful but telling consistent, believable lies is even more harmful.
We evaluated our frog-boiling attack on the Mahalanobis distance outlier detec-tion, Kalman filter anomaly detecdetec-tion, and Veracity. Our evaluation on a PlanetLab deployment of Vivaldi shows that even the basic frog-boiling attack ismore disrup-tiveagainst the security mechanism proposed in [Zage and Nita-Rotaru 2007] than the random attacks (from [Zage and Nita-Rotaru 2007]) on the mechanism. In particular, with only 5% of attackers in the network, frog-boiling causes a median relative error of 0.28 after 720 update intervals (2 hours) and 0.57 after 5040 update intevals (14 hours). This translates to each malicious node being contacted only twice and 10 times respectively. The median relative error indicates how accurate the network coordinate system is. A relative error of 0.57 for a pair of nodes means that the estimated network latency is different from the actual network latency by 57%. Without any attacks, the median relative error is less than 0.15. This shows that our attack is actually relatively fast. Although our attack only works if the attacker nodes are contacted by the victim nodes, this is very likely to happen as in any peer-to-peer system, peers have to frequently contact each other. For example in a file-sharing application like Vuze [Vuze 2010], peers have to frequently contact other peers in the network to maintain their routing tables and to find content. The same network with no attackers has a median relative error of 0.11, and un-der Zage and Nita-Rotaru’s “random” attack the insecure coordinate scheme has a maximum median relative error of 0.22, even when the fraction of attackers is above 10%. Thus the outlier detection mechanism is completely ineffective against frog-boiling. We note that while the step size of the attack is small — nodes are pushed “little by little” — the result of the attack is neither slow nor small, result-ing in similar errors just as quickly as previously known attacks but causresult-ing greater damage over time. See Section 4.2.3 for more details.
While similar attacks on outlier detection mechanisms appear in the literature (including [Wagner and Soto 2002; Denning 1987; Barreno et al. 2006]), to our knowledge we are the first to demonstrate the effectiveness of frog-boiling in the context of network coordinate systems. Furthermore, we demonstrate that the attacks are more disruptive than previous work and are completely unmitigated by the existing approaches to securing network coordinate systems. These results suggest that new approaches and/or stronger assumptions are needed to construct secure network coordinate systems.
Since the Mahalanobis outlier detection mechanism failed, the natural next step is to use another detection mechanism with trusted peers. Kaafaret al. described a Kalman filter-based anomaly detection secure network coordinate system [Kaafar et al. 2007]. They also required that a fixed percentage of the network be trusted. These trusted nodes only contact each other and cannot be influenced by non-trusted nodes. We show that our frog-boiling attack is also successful against this scheme. Our network-partition variant of the attack effectively divided the whole network into two independent subnetworks. Moreover, our attack barely increases the median relative error of the network and remains mostly undetected through-out the experiment. We emphasize that our attack is still successful even in the presence of trusted entities — having trusted components in a network coordinate system does not mean that it will be harder to disrupt. Finally, we show that our attack is effective against a distributed reputation network coordinate system
named Veracity [Sherr et al. 2009]. Veracity is different from the two other secure schemes in that it does not use any statistical means to accept or reject coordinate updates from peers. However, we show that Veracity is vulnerable to our attack as the attacker can still lie in small steps without being detected — Veracity allows each verifier to accept coordinates from the publisher as long as the error calculated by the majority of the witnesses is below a certain threshold. Thus the frog-boiling attack can lie in small steps and still stay below the threshold. From our experi-mental results, our attack can still partition the network into two separate clusters. Veracity also includes a second verification step in an attempt to prevent nodes from delaying their replies, and so inflating their network latency. Our attack does not need to bypass this step and is still successful. Thus, the second verification step of Veracity is not triggered.
The remainder of the paper is organized as follows. We give a brief background on network coordinate systems, existing attacks, and the “secure” mechanisms in Section 2. A detailed description of the attacks outlined above is given in Section 3. The evaluations of our experiments on a wide area network for the Mahalanobis distance based outlier detection [Zage and Nita-Rotaru 2007] are shown in Section 4. Section 5 shows our attack results on the Kalman filter [Kaafar et al. 2007] and Section 6 shows our frog-boiling attack evaluations on Veracity [Sherr et al. 2009]. Finally, we conclude in Section 7.
2. BACKGROUND
2.1 Network Coordinate Systems
The first network coordinate systems developed were centralized: trusted infras-tructure nodes computed coordinates for all other nodes. Centralized network co-ordinate systems include IDMaps [Francis et al. 2001], GNP [Ng and Zhang 2001] and NPS [Ng and Zhang 2004].
To improve the ease of deployment of network coordinate systems, decentralized network coordinate systems were introduced [Dabek et al. 2004; Pias et al. 2003; Shavitt and Tankel 2003; Lehman and Lerman 2004]. A decentralized network coordinate system has no infrastructure nodes. Instead, normal nodes pick peers out of the set of all nodes, and compute their own coordinates with respect to those peers only. Finding potential peers is delegated to the underlying network. Decentralized network coordinate systems are attractive for P2P applications, since they can be deployed alongside the client software. Moreover, decentralized network coordinate systems are scalable as there are no centralized servers which could become overloaded.
2.1.1 Vivaldi. Vivaldi [Dabek et al. 2004] is a decentralized network coordinate system. It provides fast convergence and resilience to changing network conditions such as churn in a P2P environment.
Vivaldi is based on a spring model. Its behavior is analogous to a physical model made of springs and balls, in which each ball represents a network node and the spring connecting any two balls is longer when the latency between those nodes is larger. Over time, such a model reaches a stable equilibrium. A Vivaldi node begins by selecting an arbitrary set of peers, and sets its initial coordinate to the origin. It then begins an iterative algorithm that pulls it closer to peers with
lower latencies, and pushes it away from peers with higher latencies. After many iterations, the coordinate system reaches an equilibrium, and subsequent changes are due only to the changing latency between nodes. Each node will pick 64 other nodes in its reference set — 32 nodes are “close” and 32 nodes are “far”. On each iteration, a Vivaldi node sends a probe packet (which could be piggybacked on top of application-level messages) to each of its peers. It receives a response to each probe packet containing the peer’s current coordinate and self-reported error estimate (can also be piggybacked on top of application-level messages), and learns its latency to that peer from the RTT of the transaction. It then computes a new position that is closer to the peer if the estimated latency is too large, and farther from the peer if the estimated latency is too small.
The estimated latency between two nodes is calculated by applying a distance function to their coordinates. A modified Euclidean distance function that incor-porates a height component on top of Euclidean space is empirically more accurate than a simple Euclidean distance function. The height component captures the “last-mile” distance. To calculate the difference between two network coordinates with height, the Euclidean distance is calculated for the two coordinates, and then the two height distances are added. The number of dimensions also affects the accu-racy of the coordinate system. Self-reported error estimates enhance the accuaccu-racy of the coordinate system. Typically, nodes compute an error estimate based on their coordinate history. A node with rapidly fluctuating coordinates should report a large error, since its coordinates at any given moment are unlikely to reflect its latency to other nodes. This error detection mechanism is entirely voluntary.
Vivaldi’s coordinate system isn-dimensional. It was shown in [Dabek et al. 2004] that a 2-dimensional space withheightworks well for the topologies they considered. Moreover, Vivaldi boasts a low convergence time, a low reported error, and is shown to be accurate. Churn is an important issue in all P2P networks. Due to the public nature of a P2P network, hosts can join and leave the network at any time and for any duration of time. Vivaldi handles churn well due to its low convergence time. However, Vivaldi was not designed for an adversarial environment and it is simple for an attacker to disrupt the whole network.
2.1.2 Pyxida. Pyxida [Pyxida 2009] implements a virtual coordinate network. It is being used in both academia and commercially — to track the coordinates of all the PlanetLab [PlanetLab 2010; Bavier et al. 2004] nodes; and in the Vuze [Vuze 2010] BitTorrent client. It is designed to work on a P2P network and implements the Vivaldi algorithm. Pyxida uses a 4-dimensional with height coordinate space. Moreover, it is open source, enabling easier modification to implement the counter-measures and attacks. We implemented the Mahalanobis distance defense mech-anism [Zage and Nita-Rotaru 2007] on top of Pyxida in our experiments since it implements the Vivaldi algorithm, provides a stable network coordinate system, and has been used in a large-scale deployment [Ledlie et al. 2007]. A detailed description of Pyxida is given in [Ledlie et al. 2006].
Pyxida contains a “gossip” protocol. Every 10 seconds, it will randomly pick a node it knows and send it a “ping” request. When the node replies, Pyxida will add that node to its neighbors list (the list can contain a maximum ofn= 50 neighbors). When a Pyxida node receives a ping request, it will just send a response — it does
not add that node to its neighbors list. After receiving a response, which contains the other node’s coordinates, error, and RTT, the Pyxida node will calculate the current force. All the nodes in its neighbors list are inspected (coordinates and error) and the current force calculated from these data. The system coordinates are then updated accordingly. Thus, Pyxida will only update its coordinates when it initiates a request and this is performed every 10 seconds.
2.2 Performance Metrics
We use several metrics to evaluate the performance of a network coordinate system: —error: The median relative error is calculated as
|RT Testimated−RT Tactual|
RT Tactual
whereRT Tactualis the actual RTT between two nodes andRT Testimated is the RTT obtained by taking the difference in the coordinates of the two nodes. The lower this number is, the more accurate the network coordinate system is (each node believes it has the right coordinate). We note that errors are inherent in network coordinate systems because an embedding from a matrix of RTTs (high dimension) to a Euclidean coordinate (low dimension) will contain errors. —RRL, Lua et al. [2005] Relative Rank Loss: Pyxida calculates the rrl as the
pairwise orderings of each neighbor, that is, for every pair of neighborsAandB,
ifRT TA≥RT TB and the coordinate distance to A is less than the coordinate
distance toB, then this counts as a “wrong ordering”, that is, if there is a sign mismatch. The rrl is thus the number of “wrong orderings” over the total number of possible orderings. The lower therrl is, the better as there are more “correct orderings”. Notice that a ranking that chose randomly between each pair of nodes would have an expected rrl of 0.5, so in some sense this represents the “worst possible” value of rrl.
—RALP: The relative application latency penalty [Pietzuch et al. 2005] — this cal-culates the percentage of “lost latency” when using a network coordinate system. It is calculated as follows. For every pair of neighborsAandB, ifRT TA≥RT TB
and the coordinate distance toAis less than the coordinate distance toB, then theralp-lossis|RT TA−RT TB|. Theralpis then the sum of theralp-lossfor each pair divided by the sum of the “correct” RTTs for each pair. IfRT TA≥RT TB, the “correct” RTT isRT TA. For the other case, the “correct” RTT isRT TB. A ralp of 0.5 means that it takes 50% longer in terms of latency to get a file using the network coordinates than using the real RTT.
—false positive rate: The false positive rate denotes the number of updates that are rejected, although they should have been accepted. This is used to determine the optimal thresholds for the Mahalanobis distance.
—intercluster/intracluster ratio: This is a measure of how far apart two sets of nodes are from each other. This is used to measure the effectiveness of one variant of our frog-boiling attack, which attempts to partition the whole network into two independent subnetworks. An intercluster/intracluster ratio of 2 means that a node from one cluster is twice as far apart on average from a node in the other cluster than to a node from the same cluster. A ratio of 1 implies that the
network is not partitioned. A higher ratio indicates that our attack is effective. The ratio is calculated as the average coordinate distance of all the nodes of one set to the center of the other set, divided by the average coordinate distance of all the nodes of one set to the center of the same set.
2.3 Existing Attacks
Several attacks on network coordinate systems have been described in the litera-ture [Kaafar et al. 2006a; 2006b; Kaafar et al. 2007; Zage and Nita-Rotaru 2007]. These include theDisorder attack,Repulsion attack,Colluding Isolation attack, In-flation/Deflation attack, and the Oscillation attack. The Repulsion and Colluding Isolation attacker sends the same coordinates each time in an attempt to move the victim nodes to some location. The Disorder attacker always reports randomly cho-sen coordinates and a low error. Basically, an attacker can lie about its self-reported coordinates and/or delay its reply so that the measured RTT will be higher than the real RTT. The reader is referred to those papers for a more detailed description of the attacks.
2.4 Countermeasures
Several mechanisms [Kaafar et al. 2007; Zage and Nita-Rotaru 2007; Sherr et al. 2009; Saucez et al. 2007; Wang and Ng 2008] have been proposed to secure network coordinate systems. We give an overview of each of them here. We refer the reader to the respective papers for a more detailed description.
Mahalanobis Distance: The first defense mechanism that we will look at uses statistical means to reject inputs that do not conform to past accepted inputs. Zage and Nita-Rotaru [2007] use the Mahalanobis distance, an outlier detection system, to flag “bad” coordinate updates. Based on past good updates, the system deter-mines if a new coordinate update is acceptable or not. A full description of the scheme and our attack on this system are in Section 4.
Kalman Filter:The system by [Kaafar et al. 2007] also uses a statistical method to determine if a coordinate is acceptable. They implement the Kalman filter [Kalman 1960], an anomaly detection system. The main difference from the previous scheme is that this system requires that some peers in the network are trusted. These trusted nodes communicate only with each other to determine the parameters for the Kalman filter, which other non-trusted nodes use. We show in Section 5 that our attack is effective against this scheme.
Veracity: Veracity [Sherr et al. 2009] is a distributed reputation system. A peer’s self-reported coordinate can be verified by other peers, and a peer is prevented from delaying its reply to an update in an attempt to inflate its network latency. A full description of Veracity is given in Section 6. We also show in that section that Veracity is also vulnerable to our attacks.
Other schemes: RVivaldi [Saucez et al. 2007] is a reputation system that assigns weighted trust to peers and uses the trust metric to accept coordinate updates from these peers. Wang and Ng [2008] proposed using a two-step verification method to mitigate malicious nodes in the network. The first step is to verify the self-reported coordinates of peers. This is performed by having witnesses attest to each peer’s coordinate update. A verifier can then audit that peer to make sure that the peer computed its coordinates correctly. The second step is to prevent nodes from
delaying their reply so as to increase the network latency. This step involves using their triangle inequality violation (TIV) detection mechanism [Wang et al. 2007], as the authors claim that a peer which delays its reply is more likely to be part of a TIV than a honest peer which is not delaying its reply. Since their TIV detection scheme can filter out TIVs, then since they claim a malicious peer is part of a TIV, the scheme should be able to filter out the adversarial node.
3. OUR ATTACKS 3.1 Frog-boiling Attack
Previous secure network coordinate schemes create a range of acceptable new coor-dinates. Updated coordinates are accepted if they fall inside this range and rejected otherwise. These mechanisms correctly identify spurious peers that return random coordinates as these updates will not fit inside the range. Since honest and cor-rectly operating peers are unlikely to change their coordinates faster than average, their updates will fit inside the range of acceptable coordinates and be accepted by the scheme. The Mahalanobis distance and Kalman filter are statistical out-lier detection schemes, so honest nodes will be considered normal while randomly behaving nodes will be flagged as outliers. Although Veracity does not use any statistical method, it accepts peers that are within a threshold and rejects peers with computed error greater than the threshold. Since honest peers behave as per the protocol, their computed error will be less than the threshold, while malicious peers’ computed error will be greater than the threshold.
However, an intelligent adversary can send “random” data points that still fall within the acceptable range. Thus, the data points will be accepted although they are “wrong”. We call this approach thefrog-boiling attack. If the adversary lies too much, its peers will not accept its updates. If it lies too little, the attack will not succeed in disrupting the network. The frog-boiling attack can be used to disrupt the whole network by continuously lying to all the nodes.
As a simple example, assume there are only two nodesA andB in the network and they have converged to stable coordinates. An attacker node C is introduced and obtains its coordinates from both A and B. However, each time C receives a request (say from A), it replies with CoordC =CoordC+δ, whereδ is a small offset. For example, if its coordinates in 2 dimensions are (120,100), the reported coordinate will be (120.5,100.5). Since the coordinate reported is not outside of the Mahalanobis thresholds, Kalman filter, or the Veracity error ratio cut-off, A will accept the coordinate and update its own coordinate accordingly. Then whenever
BqueriesA, the response will be a coordinate that is slightly higher than what the “real” coordinate should have been. Thus,B’s coordinate changes slightly as well. This process continues with the attacker continuously lying in small increments about its own coordinate. It is conceivable that this whole process might just shift the coordinates, but not affect the estimated distance between any two nodes. However, we show in Sections 4, 5, and 6 that this is not the case; our attack effectively renders the network coordinates ineffective.
(a) (b) (c)
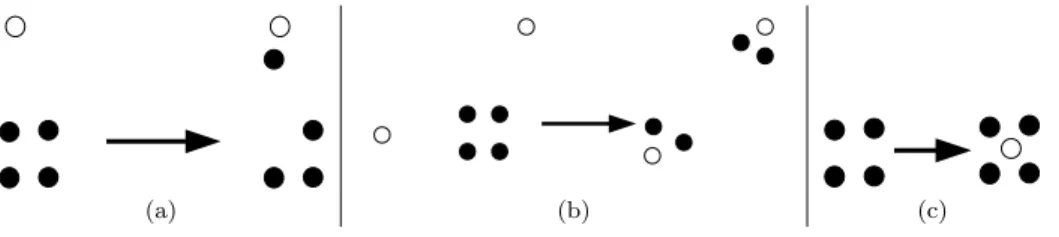
Fig. 1. (a) Basic-Targeted attack: moving the targeted nodes to some coordinate, (b) Network-Partition attack: dividing the network into two separate smaller subnetworks, and (c) Closest-Node attack: attacker becomes the closest node to the victims. Honest nodes are shaded whereas malicious nodes are white. The network before and after attack is shown for each type of attack.
3.2 Targeted Attack
Our targeted attack relies on the simple concept that consistent lies will not be caught by any of the secure schemes since the attacker’s reported coordinates are similar over time. Thus neither the Mahalanobis spatial and temporal thresholds, nor the Kalman filter will be triggered. Moreover, the attack will pass both verifi-cation tests for Veracity, as the error would still be below the cut-off. The attacker can also select which nodes to lie to and which nodes not to respond to, since nei-ther of the security mechanisms considered here nor any of the deployed network coordinate system implement any explicit sharing of information about other nodes. The targeted attack works as follows. The attacker attempts to move some victim nodes (a small fraction of the whole network) to some arbitrary network coordinates. The targeted location in this case is far from the rest of the network. Although those nodes can still communicate with the rest of the network, they will not be able to calculate a correct coordinate for themselves and will report a “false” coordinate and error to the rest of the network. The three secure mechanisms will flag those nodes as outliers, anomalous, or misbehaving, and will not accept their updates. This effectively isolates the victim nodes from the rest of the network.
Moving a victim node to an arbitrary location with a single update would typi-cally require a force of sufficient magnitude to trigger an outlier filter. In order to avoid this, the victim node will be moved to a target location in small steps. The rest of the network will still accept updates from that victim node if the move is small. Thus, the rest of the network will also be pulled to that location by the vic-tim node. However, since the vicvic-tim nodes consist of a small portion of the network (less than 5%), the rest of the network will get pulled back together, further from the victim nodes at every update.
One way of performing this attack is for the adversary to consistently report its coordinates to the victim nodes so that the latter end up at locationA. Note that the attacker will not be able to pull the victim nodes all the way to A, but the victims will be closer to Athan the rest of the network. This is because, although the rest of the network might not accept updates from the victim nodes, the latter will still accept updates from the rest of the network. Thus, the victim nodes are pushed to Aby the attacker but also pulled back to the rest of the network. The success of the attack is for the attacker nodes to exert a greater force on the victim
nodes than the rest of the network.
In this paper we evaluate three variants of this attack:
—TheBasic-Targetedattack described above is shown in Figure 1(a). The shaded nodes are part of the original network while the white nodes denote the attackers. —The Network-Partitionattack is an extension of the previous attack, shown in Figure 1(b), where the whole network is partitioned into two subnetworks or clusters. The partition can be arbitrary as the frog-boiling attacker is perform-ing a Basic-Targeted attack to a certain coordinate location on a subset of the network and performing the same Basic-Targeted attack to a different coordinate location on the rest of the network.
—The Closest-Node attacker tries to become the closest node (in terms of co-ordinate distance) to the victim nodes, as shown in Figure 1(c). Becoming the closest node might not be important by itself. However, if the network coordinate system is used with an application such as in Vuze, then the closest node could be used to initiate a file transfer. If the attacker becomes the closest node to a victim node, it will then be the first node that the victim contacts for a file. This can have various implications such as preventing any node in a file-sharing network from being able to download a file.
This attack is performed in a similar way to the targeted attack. Instead of pulling the victim node to a certain coordinate space, the attacker pushes itself close to the victim node. One way of doing this is for the attacker (after learning the victim’s coordinate) to report its network coordinates as being very close to that of the victim’s.
3.3 Implementation Issue
In most network coordinate systems, a peer V only updates its coordinate after it initiates contact. A malicious peerA cannot contact other peers to force them to update their coordinates. Thus, the malicious peerAneeds to be contacted by
V before A can affect V’s coordinates. However, peers in a network coordinate system need to frequently contact other peers, and the malicious peer will most likely be contacted at some point. There are numerous reasons why a peer needs to contact other nodes in the network: 1) coordinates are constantly changing due to dynamic network conditions, 2) applications using network coordinate systems require frequent exchange of information, for example, in a file-sharing system like Vuze, nodes have to contact each other to find the desired content.
4. MAHALANOBIS DISTANCE
Zage and Nita-Rotaru [2007] proposed a countermeasure that uses two statistical filters to ignore peers that report unusually large changes in coordinates or rapidly changing coordinates. The first filter is called the spatial filter, while the second is called thetemporal filter. Each node applies both filters to incoming data from its peers, and discards data that do not pass both filters.
The spatial filter uses three variables: the peer’s reported error, change in the peer’s coordinate since the last iteration, and the latency of the probe packet to that peer. An average of these three variables recorded from all nodes is stored from the last u iterations (we use u = 64 in our experiments). Intuitively, we
expect all peers to have roughly the same reported error and location change at a given time. Peers that greatly exceed the averages are likely to be lying. The Mahalanobis outlier detection function used by the spatial filter determines if the new spatial vector falls inside an ellipsoid defined by previously seen vectors. In the case of the spatial filter, we are defining a three-dimensional ellipsoid with axis lengths that are a multiple of the variances of the three variables (the “multiple” is a configuration parameter). Data points that fall inside this ellipsoid are accepted, while data points that fall outside it are discarded.
The temporal filter uses five variables: the remote error, local error, latency, change in the peer’s coordinate since the last iteration, and local coordinate change in the last iteration. The ellipsoid for the Mahalanobis outlier detection function is based on these variables, collected over the entire lifetime of the node; since the data set is much larger, a constant-time and constant-space but slightly less accurate variant of the Mahalanobis function is used for this filter. Intuitively, as the network becomes more stable, we expect the peer’s error, the peer’s coordinate change, the local node’s error, and the local node’s coordinate change to decrease. Peers that report large errors and coordinate changes while the local node’s values are small are likely to be lying.
Since the cost of a false positive is small, nodes can afford to set their thresholds very low. However, if the thresholds are too low, nodes will only accept data points that fit into a small range, leading to inaccurate coordinates. To our knowledge, the correct choice of thresholds to maximize security vs correctness has not been studied. When a peer’s data fails either the spatial or temporal filter, there are two consequences. First, that peer’s data is not used to update the node’s current coordinate. Second, that peer’s data is not used as history for the filters in the next iteration. However, there is no permanent blacklist of nodes which fail the filters. 4.1 Experimental Setup
To evaluate the impact of the attacks on a network coordinate system with the Mahalanobis distance implemented, we deployed a standalone Pyxida service (see Section 2) on PlanetLab [Bavier et al. 2004]. Since the original Pyxida code imple-ments the basic Vivaldi coordinate system, the Mahalanobis distance outlier detec-tion mechanism proposed in [Zage and Nita-Rotaru 2007] was added to the Pyxida code using a third-party library [CommonSense 2008]. The number of PlanetLab nodes available to our service varied from 200 to 600.
We made some small modifications to Pyxida before deploying it. The neighbor list was modified to contain a maximum of 32 nodes (due to an estimated PlanetLab network size of 400). We used 50 nodes as the common “bootstrap” nodes, that is, all the Pyxida nodes contact those nodes when they first start. We wait until the network stabilizes before introducing any adversaries in the network. Stabilization occurs when the median relative error of the whole network remains constant and when the coordinates of all the nodes in the network do not change by more than a small amountǫat each update step.
We note that most of the experiments here were also performed using a simulated network to verify implementation correctness. The results of these simulations are consistent with the experimental results and are thus omitted.
0 0.1 0.2 0.3 0.4 0.5 3 4 5 6 7 8
Median Relative Error
Spatial Threshold 0.16 0.18 0.2 0.22 0.24 0.26 0.28 0.3 0.32 0.34 3 4 5 6 7 8 Fraction Spatial Threshold RALP RRL (a) (b)
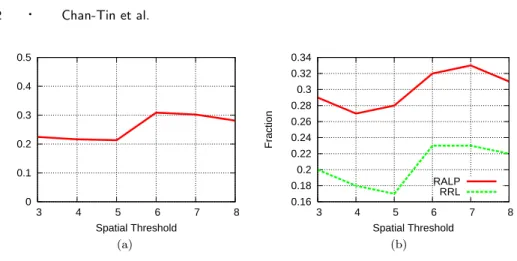
Fig. 2. The average (a) median relative error, and (b) rrl and ralp, of all the Pyxida nodes for varying spatial thresholds
10 15 20 25 30 35 40 45 50 55 60 3 4 5 6 7 8
False Positive Rate (%)
Spatial Threshold 0.14 0.15 0.16 0.17 0.18 0.19 0.2 0.21 0.22 4 5 6 Spatial Threshold 3 4 5 6 7 Temporal Threshold 0.14 0.15 0.16 0.17 0.18 0.19 0.2 0.21 0.22 (a) (b)
Fig. 3. (a) The average false positive rate of all the Pyxida nodes for varying spatial thresholds and (b) The average median relative errors of all the Pyxida nodes for varying spatial and temporal thresholds (note the reverse z-axis)
4.1.1 Mahalanobis Thresholds. We deployed a modified version of Pyxida, with the Mahalanobis distance implemented and no attackers. As with any other out-lier detection, the thresholds used are important. Although Zage and Nita-Rotaru [2007] reported the spatial and temporal thresholds used as 1.5 (determined ex-perimentally) and 4.0 (allow the four variables to vary by one standard deviation) respectively, those thresholds are not effective for Pyxida when deployed on Plan-etLab, due to the differences in network topology.
Increasing the threshold will naturally lower the false positive rate as more up-dates are accepted by the Mahalanobis distance mechanism but this also increases the relative error as more “bad” updates are accepted. A “bad” update could oc-cur due to a long RTT or the local node taking longer than expected to reply to a request. Thus a trade-off is needed to determine better spatial and temporal thresholds which result in a low false positive rate, error, rrl, and ralp.
0.135 0.14 0.145 0.15 0.155 0.16 0.165 0.17 0.175 4 5 6 Spatial Threshold 3 4 5 6 7 Temporal Threshold 0.135 0.14 0.145 0.15 0.155 0.16 0.165 0.17 0.175 0.2 0.22 0.24 0.26 0.28 0.3 4 5 6 Spatial Threshold 3 4 5 6 7 Temporal Threshold 0.22 0.23 0.24 0.25 0.26 (a) (b)
Fig. 4. The average (a) rrl, and (b) ralp of all the Pyxida nodes for varying spatial and temporal thresholds (note the reverse z-axis)
4 6 8 10 12 14 4 5 6 Spatial Threshold 3 4 5 6 7 Temporal Threshold 4 5 6 7 8 9 10 11 12 13 14 15 0 10 20 30 40 50 60 70 80 4 5 6 Spatial Threshold 3 4 5 6 7 Temporal Threshold 0 10 20 30 40 50 60 70 80 (a) (b)
Fig. 5. The average (a) spatial false positive rate and (b) temporal false positive rate for the whole network for varying spatial and temporal thresholds (note the reverse z-axis)
0.05 0.1 0.15 0.2 0.25 0.3 0.35 0 5 10 15 20 25 30 35 40 45
Median Relative Error
Time (hours) 0.05 0.1 0.15 0.2 0.25 0.3 0 5 10 15 20 25 30 35 40 45 rrl Time (hours) 0.05 0.1 0.15 0.2 0.25 0.3 0.35 0.4 0 5 10 15 20 25 30 35 40 45 ralp Time (hours) (a) (b) (c)
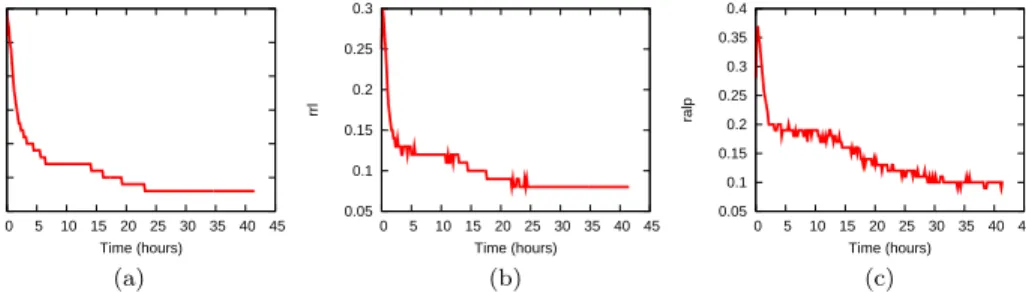
Fig. 6.The average (a) median relative error, (b) rrl, and (c) ralp of all the Pyxida nodes over time with no attackers, with both a spatial and temporal threshold of 5
and ralp. We also attempted to minimize the false positive rate, that is, updates sent to a Pyxida node that are not accepted, because they are outside of the threshold. In a pristine Pyxida environment with no attackers, this should not happen. The main reasons are attributed to the variance in latency between Planetlab nodes, and the variance in the CPU usage of Planetlab nodes. We then determine the best spatial-temporal threshold pair.
Spatial Thresholds. We set the temporal threshold to be a high number so as not to affect the analysis of the spatial threshold, and varied the spatial thresholds from 3 to 8 to determine the spatial threshold value that minimized median relative error, rrl, ralp, and the false positive rate. Figures 2 and 3(a) show the median relative error, ralp and rrl, and the false positive rate in these experiments. Based on those graphs, we experimentally that a spatial threshold of 5 produces the lowest combinations of relative error, rrl, ralp, and false positive rate.
Temporal Thresholds. Next, we vary both the spatial and temporal thresh-olds. Since we know that the best spatial threshold is 5, we varied the spatial threshold from 3 to 6. We varied the temporal threshold from 3 to 7. Fig-ures 3(b), 4(a), 4(b), 5(a), and 5(b) show the median relative error, the rrl value, the ralp value, the spatial false positive rate, and the temporal false positive rate re-spectively. Our results suggest that the optimal temporal threshold is 5. Although a spatial threshold of 5 and a temporal threshold of 3 have a slightly lower relative error, rrl, and ralp than a spatial threshold of 5 and a temporal threshold of 5, the false positive rate (either spatial or temporal) is much higher. Similarly, a spatial threshold of 6 and a temporal threshold of 7 have a lower false positive rate but the relative error is much higher.
4.1.2 Long-running experiment. We use both a spatial and temporal threshold of 5 in the remainder of our experiments. We then started a long-running exper-iment of about 400 PlanetLab nodes for almost 2 days with no attackers. The median relative error, rrl, and ralp are shown in Figure 6(a), 6(b), and 6(c) respec-tively. It can be seen that the network starts to stabilize after 2 hours, indicating a low convergence time. Both the median relative error and rrl are 0.1, indicating that the network coordinates are very accurate. Moreover the ralp is 0.15, eventu-ally becoming as low as 0.1. This shows that for our deployment, using a network coordinate system does not impose a high latency penalty.
4.2 Attack Evaluations
We evaluate our attacks from Section 3, using the spatial and temporal thresholds of 5 as determined in Section 4.1.1. The attackers join the network at time 120 minutes, as this is when the network has stabilized. Note that all numbers reported are at time 500 minutes unless otherwise specified.
4.2.1 Previous Attacks. To establish a baseline for comparison with the effec-tiveness of our attacks, we implemented the previously proposed “coordinate oscil-lation” attack [Zage and Nita-Rotaru 2007] (in which attacker nodes report com-pletely random coordinates with low relative error) and measure the performance of the attack against our Pyxida deployment (without the Mahalanobis distance filter enabled). The progress over time of the median relative error with 11% attacker nodes is shown in Table I.
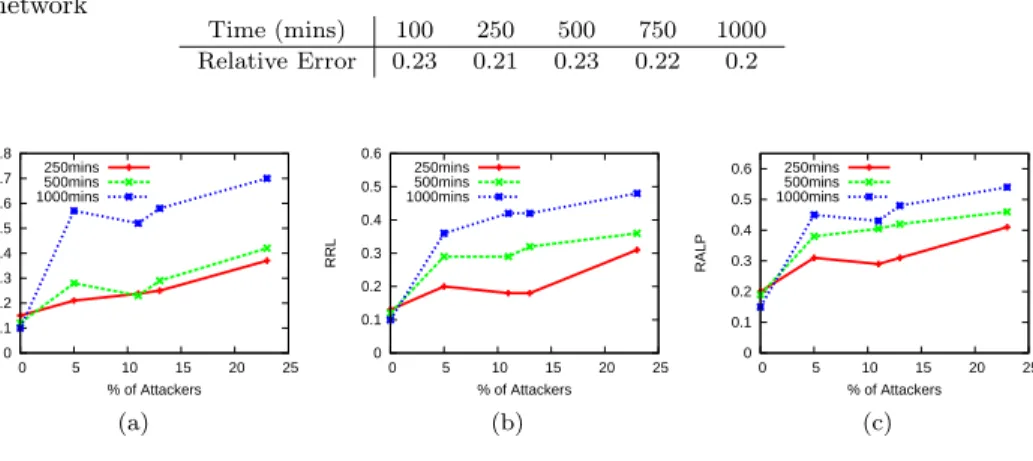
Table I.The median relative error with 11% of attackers at different time snapshots for the network Time (mins) 100 250 500 750 1000 Relative Error 0.23 0.21 0.23 0.22 0.2 0 0.1 0.2 0.3 0.4 0.5 0.6 0.7 0.8 0 5 10 15 20 25
Median Relative Error
% of Attackers 250mins 500mins 1000mins 0 0.1 0.2 0.3 0.4 0.5 0.6 0 5 10 15 20 25 RRL % of Attackers 250mins 500mins 1000mins 0 0.1 0.2 0.3 0.4 0.5 0.6 0 5 10 15 20 25 RALP % of Attackers 250mins 500mins 1000mins (a) (b) (c)
Fig. 7.The average (a) median relative error, (b) rrl, and (c) ralp for varying % of attackers at different timestamps in the Mahalanobis distance secure mechanism
4.2.2 Basic-Targeted Attack. The Basic-Targeted attacker targets a victim node and attempts to change the victim’s coordinates in small steps. We attempt to change the coordinate of the victim nodes to be LocT = (2000,2000,2000,2000) with height 2000. Initially, for each victim node V (say with coordinate CV), the attacker node A will report its coordinate to be CA−V = CV +δ. For each
subsequent time that V contactsA, the latter reports its coordinate asCA−V = CA−V +δ, until CA−V =LocT. Thus, V’s coordinate is moved in small steps to
the target coordinate.
Recall from Section 2 that a Pyxida node only updates its coordinate when it has sent a “ping” request. Thus, the victim nodes have to contact the attacker nodes for the attack to work. With 10% of attackers, the victim will contact one attacker node 10% of the time. Once an attacker node becomes a neighbor of the victim, it will stay in the neighbor’s list for at least the next 32 iterations, which is long enough for another attacker to be contacted and added to the list. The probability of an attacker node being part of the neighbor list after 32 iterations is 1−0.932= 96.5%. Thus, there is a very high probability that a victim node will
have at least one attacker node in its neighbor list. Recall that the neighbor list is used every 10 seconds in Pyxida to calculate the current force. Since the attacker is updating its coordinate to be closer to the target coordinate at each time step, the victim will thus go closer to the target coordinate progressively. The Mahalanobis distance does not work in this case because the attacker is within the thresholds (sinceδis small). The attacker only attacks the victim nodes and does not respond to other nodes in the network. Since there is no gossiping in Pyxida, this does not affect the attack.
Figure 7(a) shows the median relative error with varying percentages of attackers. (We note that 20% of attacker nodes may seem high, but many of the applications that implement network coordinate systems are vulnerable to Sybil attacks that make it trivial to control a large fraction of the nodes) The different lines show the
error at different times in minutes — 250 minutes, 500 minutes, and 1000 minutes. Adding more adversaries significantly increases the median relative error (by more than 100% with only 11% of attackers). The relative error is increased from 0.12 with no attackers to 0.25 with 11% of attackers, an increase of 108%. The rrl and the ralp are shown in Figures 7(b) and 7(c) respectively. Again, it can be seen that the frog-boiling attack works as nodes are not able to compute a correct coordinate ranking based on RTT (rrl value is high) and they are also experiencing a high percentage of lost latency (high ralp value). With only 5% of attackers, after only 250 minutes (130 minutes after the attackers join the network), the latency loss due to using a network coordinate system is higher than 35% (compared to only 19% with no attackers). Moreover, as time goes, the error, rrl, and ralp increase. After 1000 minutes (a little over 16 hours), it can be seen from Figure 7 that the network coordinate is unusable even with only 5% of the network being malicious — the relative error is greater than 0.5, the rrl value is greater than 40%, and the ralp is greater than 0.45.
The frog-boiling attack on the Mahalanobis distance-based network coordinate system is as effective as a random attack on the original network coordinate system. At time 500 minutes, the relative error for the random attack is 0.23 while the relative error for the frog-boiling attack is 0.25 with 11% attackers. This means that the Mahalanobis distance is not providing any extra countermeasure to a network coordinate system. This supports our hypothesis that an outlier detection system is not suitable to secure a network coordinate system.
4.2.3 Aggressive Frog-Boiling. Our attack works by moving the victims in small steps to some location. In the previous section, the step size δ was 2ms. In this section, we varied the value ofδto test the effect of a more aggressive attack, which will produce an impact on the network earlier — in other terms, we show how fast our attack can have an impact on the network. Figure 8 shows the median relative error, rrl value, and ralp value with 11% of attackers in the network. The different lines show the different δ values used — 2, 5, 10, 50, 100, and 250. The network starts to stabilize at time 2 hours, which is when the attackers join the network. Withδequal to 2, the relative error stays the same until time 6 hours, so it take 4 hours for the attack to start having an effect. On the other hand, withδ equal to 5 or 10, the relative error starts to increase at time 4 hours — after only 2 hours, the victim’s network coordinates start to be disrupted. Two hours translate to 720 update intervals, which means that the malicious nodes were contacted only 36 times by the victims nodes. Thus, our attack is very effective and fast. For higher values ofδ, such as 50 or 100, the median relative error still increases; however, the attack is less effective: after 16 hours the median relative error is 0.4, compared to a median relative error of 0.6 when δ = 10. When δ is increased to 250, the frog-boiling attack is not successful. Moreover, the rrl and ralp values start to show an upward trend as soon as the attackers join the network. This is because the victim’s coordinates are being changed progressively and even at the beginning, the ordering of nodes (rrl) is different since the victim is in a different coordinate than it should be — the ralp value also increases due to this. We conclude that our attack is fast and efficient.
0 0.1 0.2 0.3 0.4 0.5 0.6 0.7 0.8 0.9 0 2 4 6 8 10 12 14 16
Median Relative Error
Time (hours) δ 2 5 10 50 100 250 0 0.1 0.2 0.3 0.4 0.5 0.6 0.7 0 2 4 6 8 10 12 14 16 RRL Time (hours) δ 2 5 10 50 100 250 0 0.1 0.2 0.3 0.4 0.5 0.6 0.7 0.8 0.9 0 2 4 6 8 10 12 14 16 RALP Time (hours) δ 2 5 10 50 100 250 (a) (b) (c)
Fig. 8. (a) Median relative error, (b) rrl, and (c) ralp for the targeted nodes with 11% of attackers over time and with different values of δ for the Mahalanobis distance-based secure scheme 100 200 300 400 500 600 700 800 0 500 1000 1500 2000 2500 3000 3500 4000
Distance to centroid dc (msec)
Time (minutes) Network2 Network1 1 1.5 2 2.5 3 3.5 4 4.5 5 5.5 6 0 5 10 15 20 25
Intercluster / Intracluster distance
Time (hours) 6%
13% 23%
(a) (b)
Fig. 9. (a) The coordinate distance to the centroid and (b) the intercluster/intracluster ratio for the Network-Partition attack in the Mahalanobis-secured network
4.2.4 Network-Partition Attack. The Network-Partition attack is similar to the Basic-Targeted attack. Instead of just moving the victim nodes (Network1) to some far-away coordinate, the rest of the network (Network2) is also moved to some other location. This effectively partitions the network into two subnetworks. The targeted coordinate for Network1 was set toLocN1= (1000,1000,1000,1000)
with height 1000 and the targeted coordinate for Network2 was set to LocN2 =
(−1000,−1000,−1000,−1000) with height−1000.
In our experiment, 6% of the nodes were adversaries, 37% of the network was as-signed to Network1 and 57% of the network was asas-signed to Network2. Figure 9(a) shows the average distance to the origin of the nodes in Network1 and Network2. At the beginning, the two clusters are close together. At time 500 minutes, which is how long it takes for the attack to have an effect, the two networks start to diverge. Network1 is pushed to 1000 while Network2 is pushed to −1000. Since the two clusters continue to exert some pull on each other, the intended coordinates are not reached, but the network is still effectively partitioned.
Figure 9(b) shows the ratio of the intercluster distance to the intracluster dis-tance. The intercluster distance is the average over all the nodes, of the distance
to the centroid of the opposite cluster. The intracluster distance is the average of all the nodes in a cluster to the centroid of that same cluster. The ratio shows how far apart the two clusters are moving from each other. The figure shows that over time, the two networks are getting pulled further apart from each other. The different lines show different percentages of attackers. This shows that our attack effectively partitions the whole network into two smaller networks far apart from each other. We note that our attack could easily be further extended to partition a network into more than two clusters.
0 5 10 15 20 25 30 35 40 45 0 2 4 6 8 10 12
% of nn-name that are Attackers
% of Attackers 0 10 20 30 40 50 60 0 200 400 600 800 1000 1200 1400 1600
% of nn-name that are Attackers
Time (minutes)
(a) (b)
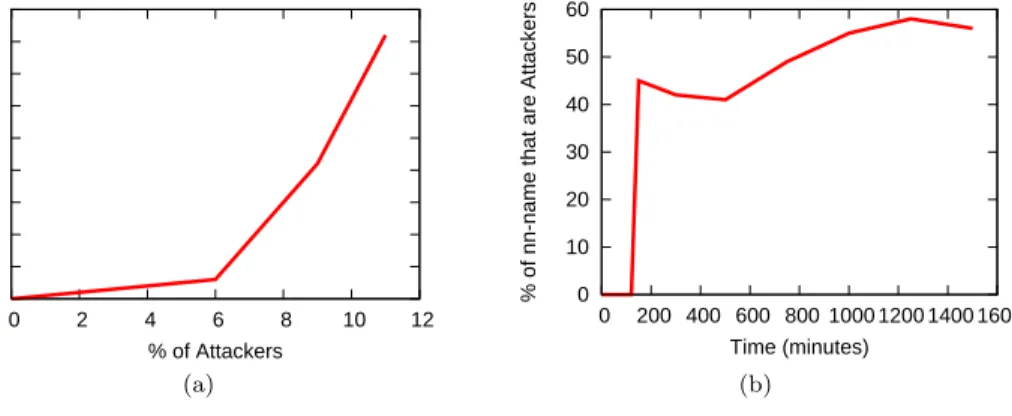
Fig. 10. % of closest neighbors reported by the victim nodes in the network using the Mahalanobis distance that are attacker nodes (a) with varying % of attackers and (b) over time with 11% of attackers
4.2.5 Closest-Node Attack. An adversary tries to become the closest node (in terms of coordinate distance) to a victim in the Closest-Node attack. In Vuze, that would mean the attacker is the node that a file transfer would be initiated to and the attacker can control which file to transmit. The attacker node queries the victim nodes constantly to obtain their coordinates. When a victim nodeV with coordinates CV queries the attacker node A, A will reply back with coordinates
CV +δ. The attacker node does not reply to other nodes in the network. The more attacker nodes in the network, the more likely for an attacker node to become the closest node. Moreover, since the attacker nodes constantly query the victim nodes for their coordinates, the attacker nodes will know when the victim nodes’ coordinates change and update their replies accordingly.
We examined the reported closest neighbor of every victim node at 10 minute intervals. We took a snapshot at 500 minutes and determined how many times one of the attacker nodes was reported as being the closest neighbor of a victim node (this reporting is done every 10 minutes). Since the attackers are introduced at time 120 minutes, we do not consider the first 120 minutes of the experiments. Figure 10(a) shows the fraction of nodes for which the attacker was the closest as the percentage of attackers varies. As expected, with more attackers, it is more likely for an attacker to become the closest node. The attacker is not able to become the closest node 100% of the time because the victim nodes have to query the attacker
nodes first before they are added to the neighbor list. The closest neighbor is only reported every 10 minutes, so the attacker could have been the closest neighbor for 9 minutes before it was discarded from the neighbor list.
With only 11% of attackers, we find that an attacker is able to become the closest neighbor to a victim node 41% of the time. We next hypothesize that the longer the experiment is run, the higher the probability that the closest neighbor of a victim will be one of the attacker nodes. Figure 10(b) shows a long-running experiment with 11% of attackers. Notice that the time axis is in 10-minute intervals. This confirms our hypothesis that over time, the attacker nodes have a higher chance of being the closest neighbor to a victim node. After one day, 11% of attackers have almost a 60% chance of becoming the closest neighbor to a victim node.
5. KALMAN FILTER
Kaafar et al. [2007] propose to implement a Kalman filter [Kalman 1960] to detect outlier hosts in the network, that is, hosts that are lying or behaving strangely. The Kalman filter works by comparing the measured relative error and the predicted relative error for each node that replies to a coordinate update. If the difference is bigger than a threshold, the update is rejected.
The authors of the paper focus their work on NPS [Ng and Zhang 2001; 2004]. They introduce the notion of a trusted surveyor node. A surveyor node is very similar to a landmark in NPS, which is a central trusted node in the network. The authors estimate that about 10% of the network have to be surveyor nodes. In the context of NPS, this will work since there are hosts which are deployed as landmarks and those hosts can also be used as surveyor nodes. The paper also implemented the anomaly detection on Vivaldi, but again, some hosts in Vivaldi act as trusted surveyor nodes.
As mentioned before, this defense scheme makes use of trusted peers. Those peers only contact each other to obtain the RTT and coordinates of the other trusted nodes. The trusted nodes then run an Expectation-Maximization step to determine the optimal parameters to be used for the Kalman filter. These parameters are then used by the non-trusted nodes to calculate the predicted error and predicted error variance, which in turn, are used to accept or reject updates from other nodes. The non-trusted peers contact the closest trusted node to obtain the parameters. The non-trusted peers contact both the trusted peers and the other non-trusted peers to initiate a coordinate update. If a normal peerA contacts another normal peer
B,Breplies with its coordinates and RTT.Afirst calculates the predicted relative error based on its past relative errors and the parameters obtained from the trusted node. Athen calculates the difference between the predicted relative error and the measured relative error. If the difference is bigger than the threshold (based on the error variance), then the update is rejected.
5.1 Implementation
We implemented the Kalman filter described in [Kaafar et al. 2007] on top of Vi-valdi. We set 8% of the network to be trusted. These trusted nodes contact each other until they stabilize, that is, their coordinates stop fluctuating and their re-ported relative error is constant. Then they each run the expectation-maximization step. After each trusted node obtains its parameters, the non-trusted normal nodes
join the network. Each normal node contacts the closest trusted node in terms of network latency to obtain the parameters. The system then continues with each normal node randomly contacting another normal node or a trusted node to ini-tiate a coordinate update. To confirm correctness of our implementation of the Kalman filter, we ran a simulation on the King [Gummadi et al. 2002] dataset, the same that the authors used, using the same initial parameters from the paper, and obtained a similar result both for the experiment without any attackers and for the experiment with varying percentages of the “random” attacker.
5.2 Attack Evaluations
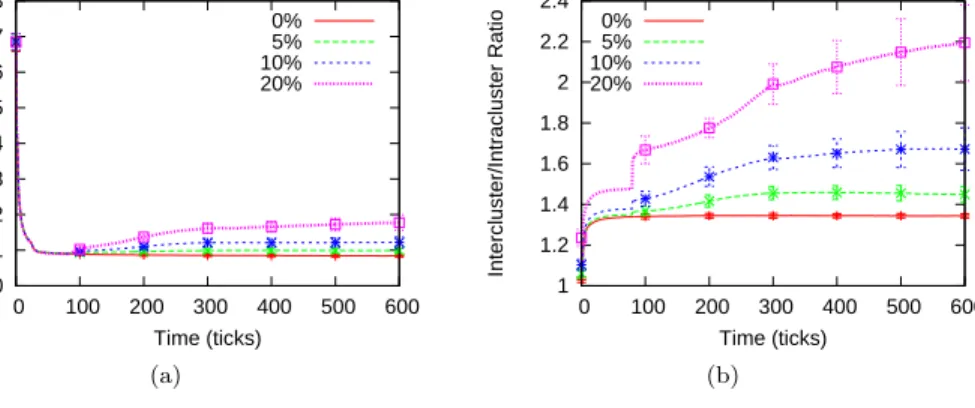
Here, we will show that the frog-boiling attack is effective against the Kalman filter defense mechanism. Although we could have implemented all three variants of the frog-boiling attack, we only performed experiments with the network-partition variant. The basic-targeted variant is a weaker version of the network-partition variant as the attacker only lies to a small subset of the network. Thus, the basic-targeted attack should be at least as effective as the network-partition attack. We did not implement the closest-node attack as there was no notion of “closest node” in our implementation of the Kalman filter whereas a Pyxida node explicitly records its closest node.
0 0.1 0.2 0.3 0.4 0.5 0.6 0.7 0.8 0 100 200 300 400 500 600
Median Relative Error
Time (ticks) 0% 5% 10% 20% 1 1.2 1.4 1.6 1.8 2 2.2 2.4 0 100 200 300 400 500 600 Intercluster/Intracluster Ratio Time (ticks) 0% 5% 10% 20% (a) (b)
Fig. 11. The (a) median relative error, and (b) intercluster/intracluster ratio for the frog-boiling Network-Partition attack on the Kalman filter-based secure scheme
Figure 11 shows the frog-boiling attack simulation results on partitioning the network. We found thatδ= 10 seems to provide a good lie step for the malicious nodes. Figure 11(a) shows that the median relative error remains unchanged even with 20% of attackers. Moreover, the number of malicious updates which were flagged as “malicious” is also very small. This leads us to conclude that the frog-boiling attack is not detected by the Kalman filter. However, Figure 11(b) shows that the intercluster/intracluster ratio increases. It is clear from this graph that our attack is successful. Moreover, contrary to our experiment with the Mahalanobis distance, our attack starts having an immediate effect on the network. By the end of the experiment, with 20% of malicious nodes, the intercluster/intracluster ratio increases to 2.2. We also plotted the “distance to origin” graphs, shown in
0 5 10 15 20 25 30 35 0 100 200 300 400 500 600
Distance to the Origin (ms)
Time (ticks) Network1 Network2 0 10 20 30 40 50 60 70 0 100 200 300 400 500 600
Distance to the Origin (ms)
Time (ticks) Network1 Network2
(a) (b)
Fig. 12. The distance to the origin for the frog-boiling Network-Partition attack on the Kalman filter-based secure scheme with (a) no attackers, and (b) 10% attackers
Figure 12. Even with 10% of attackers, the two networks are being pushed further apart from each other. All the graphs show the average over 100 simulation runs. The standard deviation is also shown for every 100 ticks to ensure that the graphs are readable.
6. VERACITY
Veracity [Sherr et al. 2009] is a distributed reputation system, which can be used on top of a decentralized network coordinate system such as Vivaldi. Similar to the scheme by [Wang and Ng 2008], Veracity uses a two-step method to mitigate attacks on network coordinate systems. The first step is to verify that the self-reported network coordinate of every peer is correct. Veracity uses a distributed hash table (DHT) and every peer is assigned a unique global identifier. Each node also has a verification set VSET, which consists of Γ = 7 members. The members of each node’s VSET can be deterministically calculated and found using the DHT’s global identifier. At every update step, every peer will report to its VSET its new coordinate. Each member of the VSET will measure its network latency to the peer, and calculate the error. A verifier nodeV will accept the peer’s coordinate as valid if the majorityR ≥4 of that peer’s VSET members computed an error less than ˆδ= 0.4.
After a peer P passes the coordinate verification test, a random set of Λ = 7 peers in the DHT are contacted by the verifierV. This test prevents a peer from delaying its reply so as to inflate the network latency between P and V. This random set of nodes is called the RSET and changes at every coordinate update.
V first calculates the average error ratio of its current coordinate with respect to the RSET. Then V calculates the new average error ratio of its new coordinate, ifV were to acceptP’s update, with respect to the same RSET. If the two error ratios differ by more than ∆ = 20%, then the update is rejected. Else, the update is accepted andV updates its network coordinate.
6.1 Implementation
Our experiments on Veracity [Sherr et al. 2009] were fairly straightforward as we were able to obtain the source code used by the authors. Moreover, the authors performed their evaluations both on the simulator portion of their code and on PlanetLab. It was thus fairly simple for us to modify the code to add our frog-boiling attack. We performed both simulations and PlanetLab experiments but as they were similar, we only show the PlanetLab experimental results. Finally, we used the exact same parameters reported in [Sherr et al. 2009].
6.2 Attack Evaluation
We chose to perform the Network-Partition attack when evaluating Veracity’s de-fence mechanisms. As with our evaluation of the Kalman filter-based defense mech-anism, we did not perform the basic-targeted attack or the closest-node attack on Veracity. As a base for our experiments we used the implementation described by the authors of [Sherr et al. 2009], which uses the Bamboo DHT [Bamboo DHT 2009; Rhea et al. 2005] as an underlying layer of communication. We have per-formed both simulations of the attacks as well as PlanetLab experiments; however we will present only PlanetLab results, since they provide a more accurate estima-tion of practical deployment and both the simulaestima-tion and experimental results were similar.
Through simulation we found the step sizeδ= 15 to provide noticeable effect, and yet maintain a relatively low error. Figure 13 shows the results from our PlanetLab experiments, where the number of nodes varied slightly between 460 and 480 over the course of the experiment, while the rest of the network-wide parameters were fixed to default values, as described in the original paper: ˆδ= 0.4, ∆ = 20%, Γ = 7 and Λ = 7. 0 0.1 0.2 0.3 0.4 0.5 0.6 0 50 100 150 200
Median Relative Error
Time (minutes) No attack 5% attackers 10% attackers 15% attackers 1 1.5 2 2.5 3 3.5 0 50 100 150 200 Intercluster/Intracluster Ratio Time (minutes) No attack 5% attackers 10% attackers 15% attackers (a) (b)
Fig. 13. The (a) median relative error, and (b) intercluster/intracluster ratio for Veracity deployed on PlanetLab. Attack starts at time = 33 minutes
The details of the attack are as follows. Each attacker chooses whether to shift its reported coordinate by +δor −δbased on the victim’s unique global identifier, GUID. If the most significant bit of the GUID is 1, the attacker chooses the positive
shift; otherwise, the attacker shifts its reported coordinate by −δ. This allows us to split the network into two roughly equal parts, because the GUID is the hash of the IP address and is evenly distributed. Whenever a node queries the attacker for his coordinate, before replying with the forged coordinate, the attacker sends out messages to the VSET members claiming that his coordinate has changed and provides the shifted coordinate. In our experiment we have found it necessary to compromise only the first step of coordinate verification. Thus we avoid delaying RTT probes and do not interfere with the RSET step of coordinate verification. As seen in Figure 13, the attack starts after the network has stabilized, at time = 33 minutes (2000 seconds). The effect is seen almost immediately, as the two networks begin to drift apart. With 15% of malicious nodes the intercluster/intracluster ratio increases to 3 by the end of the experiment. We note that the ratio keeps showing an upward trend. Since the lie δ was small, it never caused any VSET or RSET verification to fail. Thus, our attack on Veracity remained completely undetected. 7. CONCLUSION
A stable, decentralized network coordinate system could potentially provide a ben-eficial service for many Internet applications. However, early systems provide no protection against malicious participants: even a single adversary can cause the entire coordinate system to fail. One apparent solution to such a dilemma is to add an anomaly detection mechanism to the coordinate system. Previous studies have shown that such a mechanism can prevent adversaries from disrupting the network. However, protection against more complicated adversaries is fraught with difficulty. Consider a node in a network coordinate system that has some outlier detection mechanism. In order for the node to determine its coordinates, it must learn about the coordinates of its peers; that is, it must accept some updates. The range of up-dates it accepts must be based on recent history, since network conditions can vary widely. However, under these two assumptions an adversary can slowly expand the range of data accepted by the node by influencing the node’s recent history. We call this attack thefrog-boilingattack. In this paper we have introduced three variants of the frog-boiling attack and empirically demonstrated that the attack effectively disrupts the Vivaldi network coordinate system to a greater extent than previous attacks, and that the attack is completely unmitigated by Mahalanobis distance-based outlier detection, Kalman filter-distance-based anomaly detection, or Veracity, the distributed reputation system. Thus, our attack is effective against three of the recently proposed “secure” mechanisms for network coordinate systems. Moreover, due to the way the other two schemes [Wang and Ng 2008; Saucez et al. 2007] work, which is similar to the three schemes we implemented, we believe that they are also vulnerable to the frog-boiling attack.
The task of securing a distributed network coordinate system against adversaries seems very challenging. One of the problems is that the current distributed network coordinate system mechanisms (secure or not) rely only on a node’s local view of the network. Errors are also inherent in network coordinate systems as there is no perfect embedding of the matrix of round-trip times into Euclidean coordinates. Moreover, network conditions on the Internet are dynamic and network coordinates and errors change over time. Because of this, it is a challenge for a node to know
whether a reported coordinate and RTT is correct or faked. Thus, a secure network coordinate system will need to provide some mechanism to verify a node’s reported coordinates and/or RTTs. The success of the frog-boiling attack demonstrates that outlier or anomaly detection is not a secure mechanism to provide this service. Moreover, the attack is also successful against a distributed reputation system. This leads us to conclude that many of the proposed secure network coordinate schemes are vulnerable to more clever attacks, and the construction of a secure system will require careful evaluation.
ACKNOWLEDGMENTS
We thank Jonathan Ledlie and Peter Pietzuch for their help on using Pyxida, as well as, Eugene Vasserman for suggesting the name of the attack. We also thank Daniel Feldman for his help on the original portion of this work. This work was funded by the NSF under grant CNS-0716025.
REFERENCES
Abraham, I. and Malkhi, D. 2004. Compact routing on euclidian metrics. In PODC ’04: Proceedings of the twenty-third annual ACM symposium on Principles of distributed computing. ACM, New York, NY, USA, 141–149.
Agarwal, S. and Lorch, J. R.2009. Matchmaking for online games and other latency-sensitive P2P systems. InSIGCOMM ’09: Proceedings of the ACM SIGCOMM 2009 conference on Data communication. ACM, New York, NY, USA, 315–326.
Bamboo DHT. Accessed 2009. http://bamboo-dht.org.
Barreno, M.,Nelson, B.,Sears, R.,Joseph, A. D.,and Tygar, J. D.2006. Can machine learning be secure? InASIACCS ’06: Proceedings of the 2006 ACM Symposium on Information, computer and communications security. ACM, New York, NY, USA, 16–25.
Bavier, A.,Bowman, M.,Chun, B.,Culler, D.,Karlin, S.,Muir, S.,Peterson, L.,Roscoe, T.,Spalink, T.,and Wawrzoniak, M.2004. Operating system support for planetary-scale network services. InNSDI’04: Proceedings of the 1st conference on Symposium on Networked Systems Design and Implementation. USENIX Association, Berkeley, CA, USA, 19–19.
Bazzi, R. A. and Konjevod, G.2005. On the establishment of distinct identities in overlay net-works. InPODC ’05: Proceedings of the twenty-fourth annual ACM symposium on Principles of distributed computing. ACM, New York, NY, USA, 312–320.
Chan-Tin, E.,Feldman, D.,Kim, Y.,and Hopper, N.2009. The Frog-Boiling Attack: Limita-tions of Anomaly Detection for Secure Network Coordinates. SecureComm.
Choffnes, D. R. and Bustamante, F. E.2008. Taming the torrent: a practical approach to reducing cross-isp traffic in peer-to-peer systems. SIGCOMM Comput. Commun. Rev. 38,4, 363–374.
CommonSense. Accessed 2008. http://www.kimvdlinde.com/professional/programming/ statistics/commonSense/body.html.
Costa, M.,Castro, M.,Rowstron, A.,and Key, P.2004. PIC: Practical Internet Coordinates for Distance Estimation. InIEEE International Conference on Distributed Computing Systems (ICDCS). 178–187.
Cowling, J.,Ports, D.,Liskov, B.,Popa, R. A.,and Gaikwad, A.2009. Census: Location-Aware Membership Management for Large-Scale Distributed Systems. In the proceedings of USENIX Annual Technical Conference.
Dabek, F.,Cox, R.,Kaashoek, F.,and Morris, R. 2004. Vivaldi: a decentralized network coordinate system. In SIGCOMM ’04: Proceedings of the 2004 conference on Applications, technologies, architectures, and protocols for computer communications. ACM, New York, NY, USA, 15–26.