413
The Impact of Cosumers’ Attitude on Online Video Advertising towards Product
Branding
Lunardi Gunawan
International Business Management Program, Petra Christian University Jl. Siwalankerto 121-131, Surabaya
E-mail: lunardi_gunawan@yahoo.com
ABSTRACT
Online video advertising is becoming much more common and data shows that companies’ demand for online video advertising is increasing rapidly. However, there is a scarcity of research
done about the consumers’ perspective on online video advertising and there is still little evidence that online video advertising is beneficial for companies and the products being advertised. This
research would like to find out the impact of consumers’ attitude on online video advertising
towards product branding. Consumer attitude itself is divided into cognitive, affective and behavioral components.
The research was done using Android One as the case study. 100 respondents from Surabaya were taken and personally asked to watch the online video advertising and fill in questionnaires. Data from the questionnaires were analyzed using multiple linear regression. Results show that
consumers’ attitude on online video advertising has significant positive effect towards product
branding and all three component of consumer attitude have significant positive effect towards product branding individually with affective component having the most impact. Therefore it is recommended to promote using online video advertising and create online video advertising that focus more on giving affective impact to consumers.
Keywords: Consumer Attitude, Online Video Advertising, Product Branding
ABSTRAK
Iklan video online sedang menjadi jauh lebih umum dan data menunjukkan bahwa permintaan perusahaan-perusahaan untuk iklan video online meningkat dengan cepat. Namun, terdapat kelangkaan riset yang dilakukan mengenai sudut pandang konsumen pada iklan video online dan masih sedikit bukti yang menunjukkan bahwa iklan video online menguntungkan untuk perusahaan dan produk yang diiklankan. Riset ini bertujuan untuk mencari tahu dampak sikap konsumen pada iklan video online terhadap pemerekan produk. Sikap konsumen sendiri akan dibagi menjadi komponen kognitif, afektif, dan perilaku.
Riset ini dilakukan dengan mengambil studi kasus Android One. 100 responden dari Surabaya telah diambil dan dimintai secara pribadi untuk menonton iklan video online tersebut dan mengisi kuesioner. Data dari kuesioner dianalisa menggunakan regresi linear berganda. Hasil menunjukkan bahwa sikap konsumen pada iklan video online memiliki dampak positif yang signifikan terhadap pemerekan produk dan ketiga komponen dari sikap konsumen secara individu memiliki dampak positif yang signifikan terhadap pemerekan produk terutama komponen afektif yang memiliki dampak paling besar. Oleh karena itu, dianjurkan untuk berpromosi menggunakan iklan video online dan membuat iklan video online yang lebih fokus dalam memberikan dampak afektif ke konsumen.
Kata Kunci: Sikap Konsumen, Iklan Video Online, Pemerekan Produk
INTRODUCTION
Kotler and Keller (2012) defines advertising as “any paid form of nonpersonal presentation and promotion of
ideas, goods or services by an identified sponsor” (p. 500).
Advertising is usually done using print media (like newspaper and magazines), broadcast media (like television and radio), network media (like telephone and internet), electronic media (like audiotape and DVD), and display media (like billboards and posters) (Kotler & Keller, 2012,
414
p. 500). Companies use advertising to attract potential customers and influence them to have positive impression towards the company or the brand of the product or service. There are many ways to do advertising and different companies may have different strategies in marketing, resulting in different actions in their advertising. It is very important to make sure that advertising is done the right way because impressions towards a brand can be kept for a long time by the consumers. A successful advertising will result in more consumers showing their interest in the brand (Bhattacharya, n.d.).Recently, there is a huge increase in demand for digital, or electronic, brand advertising. Based on Nielsen (2014), a global information and measurement company, most marketers had planned to spend more on online, including mobile, advertising and spend the same or less for offline advertising. For online video advertising itself, 65% of the marketers in the United States planned to spend more on online video advertising. 49% of them decreased their budget from offline advertising so that they could spend more on online video advertising.
Advertising agency executives in US have similar opinions regarding the effectiveness of online video advertising. Research done on March 2013 showed that 75% believed online video advertising is either as effective or more powerful than television advertising while if compared to display advertising, the same answer is given by 91% of the respondents (eMarketer, 2013).
Video advertising, based on VideoBloom (n.d.), a
video technology and production solutions provider, is “an
ad (short for advertisement) in which the advertising
message is delivered through video”. Based on an article by Chowdhry (2014), it is estimated that in 2013, the total digital advertising revenue worldwide was $42.6 billion and around $4.15 billion from that amount was from online video advertising. It is also estimated that from that $4.15 billion, around $850 million was earned by Youtube. Chowdhry (2014) also revealed several acquisitions of online video advertising companies done by huge companies in 2014. Yahoo! acquired BrightRoll for $640 million, AOL acquired Adap.tv for $405 million, Facebook acquired LiveRail for around $400-$500 million, Google acquired mDialog for an undisclosed price and Comcast acquired FreeWheel for $375 million.
To gain access to online videos, consumers usually need to either pay for their videos or gain access for free, but receive the advertising that comes with the videos, including online video advertising (Jaffe, 2014). Southeast Asia is not an exception in being a big consumer of online video, which automatically makes them a big consumer of online video advertising as well (Jaffe, 2014). From the consumers of online video advertising, 80% have searched for a product or service advertised in an online video advertising and 62% have bought a product or service due to that kind of advertising (Jaffe, 2014).
Online video advertising is extremely popular in Indonesia. The availability of online video advertising through real time buying increased by 607% in 2014, which
is the biggest increase in Southeast Asia (“Indonesia posts
607% increase in video ads: TubeMogul”, 2015). Based on
Ambient Digital Indonesia (n.d.), one of the companies that makes online video advertisements in Indonesia, many big
brands in Indonesia, including skincare company Pond’s,
mobile telecommunications service operator XL Axiata and restaurant chain Pizza Hut, are using online video advertising to promote, not only in Youtube, but also in other sites.
Kurgman and Johnson (1991) indicates that even in television advertising, which is a very similar form of advertising with online video advertising, consumers would avoid commercials by doing something else so they do not pay attention to the commercials (Kusse, 2013). However, as mentioned by Morimoto and Chang (2006), consumers are more goal-oriented when online. Consumers feel that online video advertising is intrusive and there is a feeling of loss of freedom when they are being exposed to online video advertising (Kusse, 2013).
The researcher will do research about the impact of
consumers’ attitude on Android One online video advertising towards Android One product branding as the case study. Android One is the name for smartphones that use Android Lollipop operating system, and is owned by the company Google. Android One is one of the products that use online video advertising in Indonesia (“Android
One : Selalu Terbaru dari Google”, 2015). Their advertising
can be seen since February 22nd 2015 on Youtube, a site that offers free consumption of online videos with online video advertising. This advertising is one-minute long, but the consumers have the option to skip the advertising after five seconds. CreativeVisions Indonesia (n.d.), a digital marketing service company and a Google Partner, stated that Youtube is the most popular online video site in Indonesia and is being used as the primary source of online videos by 86% of the internet users in Indonesia.
LITERATURE REVIEW
Consumer behavior is “the study of individuals,
groups, or organizations and the processes they use to select, secure, use, and dispose of products, services, experiences, or ideas to satisfy needs and the impacts that these processes
have on the consumer and society”. Studying consumer
behavior includes studying all the factors that make individuals decide on something, no matter it is a purchase or just a simple action, no matter the consumers themselves realize those factors or not. Hence, consumer behavior is a complicated subject, but is very important because marketing strategy based on consumer behavior study is more effective than marketing strategy based on intuition (Hawkins & Mothersbaugh, 2013, p. 8-10). Consumer attitude is a part of consumer behavior.
Attitude is “the way one thinks, feels, and acts toward some aspect of his or her environment” (Hawkins &
Mothersbaugh, 2013, p. 384). Based on Batra and Ahtola (1990), there are two main factors of consumer attitude,
“consummatory affective (hedonic) gratification (from sensory attributes) and instrumental, utilitarian reasons”
415
Hawkins and Mothersbaugh (2013) discuss about consumer attitude further by dividing it into three main components (p. 384-390). They are cognitive, affective and behavioral component.Cognitive component discuss “consumer’s belief about an object”. The belief meant is what consumers feel will be the benefit of having a product and being able to use it. There is difference between feature and benefit. When being told about features of a product, the consumers may not understand whether they want it or not, especially if the product is difficult to understand. Benefit shold be the focus of the product promotion because benefit is the one that will help consumers decide if the product is good for them or not (Hawkins & Mothersbaugh, 2013, p. 384-390).
The online video advertising “Android One : Selalu
Terbaru dari Google” (2015) have key points that is related to “belief about an object” (Hawkins & Mothersbaugh,
2013, p. 384-390). The content of the online video advertising suggests that Android One is different and is ahead. Furthermore, it is written in the explanation of the Android One online video advertising that Android One is created to always have quick performance and more
responsive (“Android One : Selalu Terbaru dari Google”,
2015).
Affective component discuss “feelings or emotional
reactions to an object”. Although this component is less
logical, this is also a very strong component. A study about consumer acceptance towards handheld internet devices show that consumer attitude is influenced by both the utilitarian or functional benefit such as the usefulness and hedonic or emotional benefit such as the fun factor, while another study even indicates that hedonic benefit has the stronger effect towards overall attitude compared to utilitarian benefit in blood donation (Hawkins & Mothersbaugh, 2013, p. 384-390).
Research done by Beauvillain and Tiger (2013)
shows that “video advertising with “a story behind it”
caused curiosity and interest since it is something more than
just traditional marketing”. That research also suggests that the quality of the advertising will affect the trust given to the advertising. Consumers will trust more if an online video advertising is well made. Research about consumer behavior done by Rodica (2009) suggests that one of the
indicator of consumer behavior is “the buyer’s perceived risk”, which is the amount of risk the customers feel when
they want to buy a product. Although Rodica (2009) categorizes it as an indicator of consumer behavior, the researcher of this research will use it as an indicator of the affective component of consumer attitude because this indicator is acceptable based on the explanation of the affective component done by Hawkins and Mothersbaugh (2013, p. 384-390).
Behavioral component discuss “one’s tendency to
respond in a certain manner toward an object or activity”.
People have a habit to act in a certain way if they like or dislike something, for example purchasing and recommending brands they like. Therefore this component is referring to actual actions done by a person (Hawkins & Mothersbaugh, 2013, p. 384-390).
In the explanation of the Android One online video
advertising in Youtube (“Android One : Selalu Terbaru dari Google”, 2015), there is an offer to find out more about
Android One by visiting their website. The researcher will use it as one of the indicators of behavioral component because finding out more about Android One is an activity that can only be done outside of watching the Android One online video advertising. Liu, Marchewka, Lu and Yu (2004) suggest that there are four dimensions of behavioral intention. They are repeat purchase, visit again, recommend to others and positive remarks. However, the researcher will not use repeat purchase in this research because a mobile phone is not something a person will buy often. Instead, the researcher will just use purchase for the research. Visit again will also not be used because the research will focus on a product, which is not something to be visited.
Kotler and Keller (2012) identifies branding as “a product or service whose dimensions differentiate it in some way from other products or services designed to satisfy the
same need” (p. 263). Brand image can be built and will stay in consumer’s mind for a long time (Latif, Islam, Noor, Saaban, & Azad, 2014). Katke (2007) mentions that there are a variety of ways that consumers can form brand association, including from direct experience, neutral sources and commercials (Latif, Islam, Noor, Saaban, & Azad, 2014).
Alizadeh, Moshabaki, Hoseini and Naiej (2014) argued that because products change very quickly, product branding is economically less preferred compared to company branding. However, they also added that product branding is more segmented towards the customers and is
usually more focused on consumers’ attitude while
company branding is more segmented towards all the stakeholders and is usually more general. Because the researcher will only do research to the consumers, the research will focus on product branding.
Based on Kotler and Keller (2012), there is a model of brand strength developed by Brandz Marketing research consultants Millward Brown and WPP (p. 268). According to the model, there are five steps of brand building, which from the weakest to the strongest are: presence, “active familiarity based on past trial, saliency, or knowledge of
brand promise”; relevance, “relevance to consumer’s needs, in the right price range or in the consideration set”; performance, “belief that it delivers acceptable product performance and is on the consumer’s short-list”; advantage, “belief that the brand has an emotional or rational advantage over other brands in the category”; bonding, “rational and emotional attachments to the brand to the exclusion of most other brands”.
The researcher believes that there is a relationship between consumer attitude on online video advertising and product branding. It is supported by research done by Homer (1990), which shows that attitude towards advertisement can affect thoughts about brand. Hawkins and Mothersbaugh (2013) suggest that consumer attitude can be divided into three components, cognitive, affective and behavioral.
416
Therefore, cognitive, affective and behavioral components should each contribute to the overallconsumer’s attitude towards product branding. Results from Kwon’s (2008) research show that all those three
components affect marketing positively and significantly. Hence, an online video advertising that creates positive consumer attitude should significantly create positive product branding while an online video advertising that creates negative consumer attitude should significantly create negative product branding.
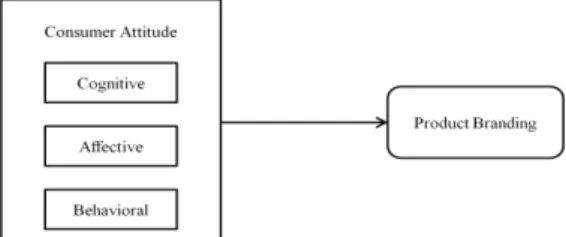
Positive cognitive component or positive belief in the online video advertising should affect the product branding positively and significantly. Positive affective component or positive feelings toward the online video advertising should affect the product branding positively and significantly. Positive behavioral component or positive physical response toward the online video advertising should affect the product branding positively and significantly. The relationship between concepts is summarized into the figure below.
Figure 1. Relationship Between Concepts The hypotheses are:
Consumers’ attitude on Android One online video
advertising has significant effect towards Android One product branding simultaneously.
Cognitive, affective and behavioral component of the
consumers’ attitude on Android One online video
advertising each have significant effect towards Android One product branding individually.
RESEARCH METHOD
Cooper and Schindler (2014, p. 21-22) explain that there are four types of research method, which are reporting study, descriptive study, explanatory study and predictive study. This research will observe consumer’s attitude on online advertising and product branding and see if
consumer’s attitude on online video advertising represented
by cognitive, affective and behavioral aspect can explain the results from product branding observation. The research will use hypothesis testing. Therefore, the research can be categorized as an explanatory study.
In the research, the dependent variable, product branding, will be based on the model of brand strength developed by Brandz Marketing research consultants Millward Brown and WPP (Kotler & Keller, 2012, p. 268). Here are the indicators of product branding used in the research: I am familiar with the presence of Android One, I have positive perception of the relevance of Android One brand to my needs, I believe in the acceptable performance
of Android One brand, I believe in the advantage of Android One brand compared to other brands in the same category and My bond to Android One brand is stronger compared to other brands.
Independent variable, which consist of of cognitive, affective and behavioral aspect of consumer attitude on online video advertising will use the combination of statements and theories that were previously mentioned. Here are the indicators of cognitive aspect used in the research: I believe that Android One has quick performance, I believe that Android One is more responsive, I believe that Android One is different and I believe that Android One is ahead of its competitors.
Here are the indicators of affective aspect used in the research: I trust Android One, I feel that there is low risk in buying Android One, I have curiosity towards Android One and I have interest towards Android One.
Here are the indicators of behavioral aspect used in the research: I recommend Android One to others, I give positive remarks about Android One, I will find out more about Android One and I will purchase an Android One smartphone.
In this research, nominal, ordinal and interval scale will be used. Nominal and ordinal scale will be used to gain information to be able to classify the respondents. Nominal scale will be used for gender and occupation. Ordinal scale will be used for age and monthly expense. Interval scale
will be used to measure the respondents’ answers for the independent and dependent variable. The interval scale will be using LIKERT scale, which is a scale with five preference answers commonly used in questionnaires (Ghozali I. , 2011). The answers are 1 = strongly disagree, 2 = disagree, 3 = neutral, 4 = agree and 5 = strongly agree.
The researcher will use both primary and secondary source. The primary source will be from the questionnaires being spread while the secondary source will be from theories and findings from other research and textbooks, as well as analysis and news about Android One and online video advertising industry.
Anyone who have experience in encountering the Android One online video advertising in Youtube will be eligible to be a respondent for the research. The respondents should be at least eighteen years old because the researcher believes that at that age the respondents will be able to understand the questions being asked in the questionnaire. The researcher will use probability sampling and the method will be simple random sampling to improve the objectivity of the research.
Tabachnick and Fidell (2007) mention that the formula for calculating sample size is N > 50 + 8m where N is the number of participants and m is the number of independent variables (Boduszek, n.d.). Therefore in this research, because there are three independent variables, the sample size must be bigger than 74. The sample will be taken from Surabaya, which is chosen because Surabaya is
“the biggest metropolitan city in Indonesia” (“Surabaya
City Online”, n.d.). The exact place for spreading the
questionnaire will be in Supermal Pakuwon Indah, which is a mall. The researcher choose to spread the questionnaire in
417
a mall because people who come to malls are not limited tothe researcher’s acquaintances. The researcher will also spread the questionnaire online using Line and Steam for additional respondents. The online distribution will be done personally from the researcher to each respondent to make sure that each respondent watch the online video advertising.
Cooper and Schindler (2014, p. 257-261) explain that a research can be categorized as a good research after their validity and reliability are tested. Validity “is the extent to
which a test measures what we actually wish to measure”. Reliability “has to do with the accuracy and precision of a measurement procedure”.
According to Ghozali (2011), validity can be measured from the Pearson correlation of each independent variable and dependent variable. If the significance level of the Pearson correlation is zero, then the data is valid.
This research will use one shot to measure reliability. This means the researcher will only use one question for each indicator of each variable. The test will be processed
using Cronbach’s Alpha. If the Cronbach’s Alpha is above
0.6, then the data is reliable.
As mentioned previously, there will be classic assumption test to examine the normality, autocorrelation, multicollinearity and heteroscedasticity. The whole statistical methods will be based on Ghozali (2011).
Normality test is used to make sure that the residual is distributed normally and independently. Although the normality of a variable is not always necessary, a test is always better if the variables are distributed normally. The normality test can be done using a Kolmogorov-Smirnov test. In Kolmogorov-Smirnov test, the significance probability of the Z value should be above alpha 0.05. Hence, if the significance probability is below alpha 0.05, then the residuals are not normally distributed. (Ghozali, 2011).
Autocorrelation test is used to see whether there is correlation between the residual of a certain period and the residual of the previous period. The existence of that correlation means that there is autocorrelation problem. A good regression model is a model that does not have an autocorrelation problem. Durbin – Watson test can be used to find autocorrelation problem. The table below describes the Durbin – Watson test where dU is the upper value while dL is the lower value (Ghozali, 2011).
Table 1. Durbin – Watson Test
Null Hypothesis Decision Condition
There is no positive autocorrelation Reject 0 < d <dL There is no positive autocorrelation No decision dL ≤ d ≤ dU There is no negative autocorrelation Reject 4 – dL< d < 4 There is no negative autocorrelation No decision 4 –dU ≤ d ≤ 4 – dl There is no autocorrelation, positively or negatively Does not reject dU < d < 4 – dU (Source: Ghozali, 2011)
Multicollinearity test is used to see whether there is correlation between independent variables. A good regression model should not have correlation between independent variables. A multicollinearity problem can be found by using the tolerance value and variance inflation factor or VIF. Tolerance value is to measure the variability of the independent variable. If the tolerance value is below or equal to 0.10, then there is a multicollinearity problem. VIF itself is one divided by the tolerance value. If VIF is above or equal to 10, then there is a multicollinearity problem (Ghozali, 2011).
Heteroscedasticity test is used to find out whether there is difference in variance from the residual of one observation to another observation. If the variance is different, then there is a heteroscedasticity problem. Park test can be used to find out about heteroscedasticity. In park test, if the P-value is below 0.05, then there is a heteroscedasticity problem(Ghozali, 2011).
Below is the formula for the multiple linear regression used in the research.
Y = β0 + β1 X1 + β2 X2 + ... + βn Xn + ε (1.)
Y = value of dependent variable, β0 = intercept of
dependent variable, βn = slope of dependent variable with independent variable n, Xn = value of independent variable
n and ε = random error in dependent variable (Ghozali,
2011).
The researcher will also use F-test, T-test and Adjusted R2 (Coefficient of Determination). F-test is used to measure the influence of all the independent variables as a whole towards the dependent variable. To do F-test, compare the P-value with the significance level. Significance level is 0.05. If P-value is below significance level, then there is significant influence from all the independent variables as a whole to the dependent variable (Ghozali, 2011).
T-test is used to measure the influence of each independent variable towards the dependent variable. To do T-test, compare the P-value with the significance level. Significance level is 0.05. If P-value is below significance level, then there is significant influence from the independent variable to the dependent variable (Ghozali, 2011).
Adjusted R2 is used to measure how much the variation in independent variable can explain the variation in dependent variable. The closer the value of adjusted R2 is to one, the more the variation in independent variable can explain the variation in dependent variable (Ghozali, 2011).
RESULTS AND DISCUSSION
The researcher took the data from 100 respondents and used all of the data. The researcher found the respondents from a Surabaya mall named Supermal Pakuwon Indah, also from friends in Line and from Surabaya people that the researcher met online in Steam. The respondents were given the opportunity to watch the online video advertising before filling the questionnaires if
418
they had not watched it or if they had watched, but wanted to watch again. Because the researcher asked each respondents personally, the researcher was able to confirm that they had watched the online video advertising before filling the questionnaire.For the gender, 61% or 61 out of 100 respondents are male while 39% of the respondents are female. For the occupation, 57%, which means the majority, of the respondents are students. The second largest occupation group is employee with 27%. Followed by entrepreneur with 13% and the rest are not employed with 3%. For the age, 65% of the respondents are between the age of 18 and 24, which is expected because most of the respondents are students. The runner-up for age is between 25 and 34 with 25 respondents. The last place goes to both the age between 35 and 44 and the age above 44 with five respondents for each age group. For the monthly expense, 51 or around half of the respondents spend between Rp. 1,000,000 and Rp. 2,999,999 per month. 24 respondents spend between Rp. 3,000,000 and Rp. 4,999,999 per month. There are 11 respondents who spend less than Rp. 1,000,000 per month and eight respondents who spend more than Rp. 6,999,999 per month. Finally, only six respondents spend between Rp. 5,000,000 and Rp. 6,999,999 per month.
Before proceeding further with the analysis of the data, the validity and reliability of the data need to be tested first to make sure that the data actually measure what the researcher wish to measure and that the measurement procedure is accurate and precise. The significance level of the Pearson correlation for each variable in the research is
zero, so the data is valid. The Cronbach’s Alpha for each
variable in the research is above 0.6, so the data is reliable. Next is the classic assumption tests.
Table 2. Kolmogorov-Smirnov Test
Unstandardized Residual
N 100
Normal Parametersa,b Mean .0000000
Std. Deviation .42036268 Most Extreme Differences Absolute .092 Positive .062 Negative -.092 Kolmogorov-Smirnov Z .924
Asymp. Sig. (2-tailed) .361
a. Test distribution is Normal. b. Calculated from data.
The table above show that the significance probability, which is Asymp. Sig. (2-tailed) in the table above, is higher than 0.05 for the residuals. Therefore, the researcher will accept the null hypothesis which is the residuals are normally distributed.
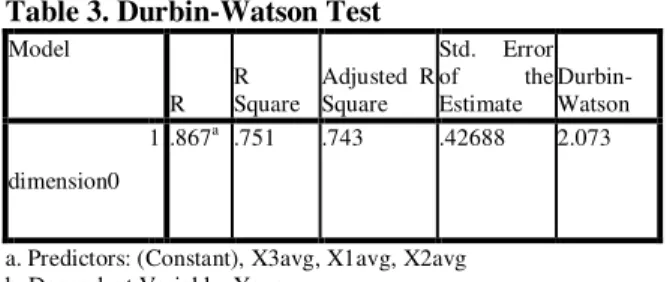
Table 3. Durbin-Watson Test
Model R R Square Adjusted R Square Std. Error of the Estimate Durbin-Watson dimension0 1 .867a .751 .743 .42688 2.073
a. Predictors: (Constant), X3avg, X1avg, X2avg
Table 3. Durbin-Watson Test
Model R R Square Adjusted R Square Std. Error of the Estimate Durbin-Watson dimension0 1 .867a .751 .743 .42688 2.073
a. Predictors: (Constant), X3avg, X1avg, X2avg b. Dependent Variable: Yavg
The value from the Durbin-Watson test, or d, is 2.073 while the value from the Durbin-Watson table, or dU, with 5% significance points is 1.736. The condition for the research to have no autocorrelation problem is dU < d < 4 – dU. If the values from the test and table are put into the condition, then the result will be 1.736 < 2.073 < 2.264. Therefore, the researcher will accept the null hypothesis which is the residuals have no autocorrelation between them.
Table 4. Coefficients Collinearity Table
Model Unstandardize d Coefficients Standardize d Coefficients t Sig. Collinearity Statistics B Std. Error Beta Toleranc e VIF 1 (Constant ) -.079 .229 -.345 .73 1 X1avg .224 .091 .189 2.48 0 .01 5 .446 2.24 4 X2avg .430 .097 .396 4.42 0 .00 0 .322 3.10 3 X3avg .376 .083 .367 4.53 0 .00 0 .395 2.53 3 a. Dependent Variable: Yavg
In this table, we can see that in the collinearity statistics, none of the independent variables have tolerance below or equal to 0.10 and also none have VIF above or equal to 10. Therefore, the independent variables have no multicollinearity between them.
Table 5. Park Test
Model Unstandardized Coefficients Standardized Coefficients t Sig. B Std. Error Beta 1 (Constant) -.098 1.232 -.079 .937 X1avg .519 .487 .152 1.067 .289 X2avg -.724 .524 -.232 -1.382 .170 X3avg -.751 .447 -.255 -1.680 .096
a. Dependent Variable: lnressquare
It is shown in table 5. that the park value, or Sig in the table, is above 0.05 in all of the independent variables. Therefore, the researcher will accept the null hypothesis which is the residuals have no heteroscedasticity.
Table 6. ANOVA Table
Model Sum of Squares df Mean Square F Sig.
1 Regression 52.770 3 17.590 96.528 .000a
Residual 17.494 96 .182
419
a. Predictors: (Constant), X3avg, X1avg, X2avg b. Dependent Variable: Yavg
Table 6. indicates that the significance level of all the independent variables as a whole is not above 0.05. Therefore, the researcher will accept the null hypothesis which is all the independent variables as a whole have significant influence to the dependent variable.
Table 7. Regression Coefficient Table
Model Unstandardized Coefficients Standardized Coefficients t Sig. B Std. Error Beta 1 (Constant) -.079 .229 -.345 .731 X1avg .224 .091 .189 2.480 .015 X2avg .430 .097 .396 4.420 .000 X3avg .376 .083 .367 4.530 .000
a. Dependent Variable: Yavg
Based on table 7., each of the independent variables do not have significance level above 0.05. Therefore, the researcher will accept the null hypothesis which is the independent variable have significant influence to the dependent variable for all three independent variables used in the research.
The result of the multiple linear regression of the research is: Product branding = -0.079 + 0.224 * cognitive component + 0.430 * affective component + 0.376 * behavioral component + random error in product branding. This shows that all three components have significant positive effect towards product branding with affective component having the biggest influence towards product branding. For every one unit increase in the cognitive component, the product branding should increase by 0.224. For every one unit increase in the affective component, the product branding should increase by 0.430. For every one unit increase in the behavioral component, the product branding should increase by 0.376.
Table 8. Adjusted R2 Model R R Square Adjusted R Square Std. Error of the Estimate Durbin-Watson dimension0 1 .867a .751 .743 .42688 2.073
a. Predictors: (Constant), X3avg, X1avg, X2avg b. Dependent Variable: Yavg
From table 8., it can be concluded that the variation of the combined result of cognitive, affective and behavioral component can explain 74.3% of the variation of product branding. It means that 25.7% can be explained by other variables outside of the research.
Results from the research show that for the f-test, the significance level of all the independent variables as a whole is not above 0.05, so there is significant effect towards product branding. For the t-test, each of the independent variables do not have significance level above 0.05, so there is significant effect from each of the three components individually towards Android One product branding. Finally, from the formula for the multiple linear regression, it can be seen that there is positive effect from consumer
attitude towards product branding there is also positive effect from each of cognitive, affective and behavioral component individually towards product branding. Therefore, the researcher will accept both of the null
hypothesis, the first one is consumers’ attitude on Android
One online video advertising has significant positive effect towards Android One product branding simultaneously, and the second one is cognitive, affective and behavioral component each have significant positive effect towards Android One product branding in Android One online video advertising individually.
Previous relevant research done by Kusse (2013) had showed that, for the majority of people, there is positive effect on online video advertising about branding. Findings from this research confirms what Kusse (2013) had showed. The second relevant research, which is from Saeed et al. (2013), suggest that online advertising itself generally gives positive effect on how much benefit consumers think they will get from the product being advertised and positive effect on their trust to the information they receive from the advertising. Findings from this research also confirms that. Based on the third relevant research, which is from Kwon (2008), suggests that cognitive component is more influencial than affective and behavioral component in place marketing. This research is analyzing online video advertising and the application of the T-test results in the multiple linear regression formula. Results show that affective component is the one that is the most influencial between the three of them with an increase of 0.430 to the product branding for every one unit increase in the affective component. That 0.430 is taken from the B coefficient from the unstandardized coefficient row and the equation is taken from the multiple regression formula. Homer (1990) from the last relevant research shows that attitude toward the advertising affects thoughts about the brand. Findings from this research show that consumer attitude on Android One online video advertising affects Android One product branding, therefore confirms the last relevant research.
CONCLUSION
Results show that the consumers’ attitude on online
video advertising towards product branding is significantly positive and the affective component contributes positively the most towards product branding in online video advertising. Analysis of the data also shows that 74.3% of the variation of Android One product branding can be explained by the variation of consumer attitude on Android One online video advertising and only 25.7% is explained by other variations.
Because the research show that consumer attitude on Android One online video advertising has significant positive effect towards Android One product branding and the samples show positive consumer attitude, it means that the Android One online video advertising is an effective way to promote Android One. Therefore, the researcher recommend Google to keep on using online video advertising to promote Android One. Also, as the most
significant component of consumers’ attitude in the results
420
advertising that focus on making impact to the affective component, or in other words emotional impact, to the consumers.Due to limitations related with time and cost, the research was not done optimally. Here are the limitations of the research. The first one is the source of sample. Android One online video advertising is available all over Indonesia, but the researcher only find samples from Surabaya.
Surabaya itself is “the biggest metropolitan city in
Indonesia” (“Surabaya City Online”, n.d.), so it is easier to find people who know Android instead of in more rural cities, but it is actually still important to get samples from those cities because the results of the research may differ if the sample can be taken from more cities. Relevant research done by Kwon (2008) also shows different results in different counties. This limitation has an impact on the reliability of the research.
The second one is the case study variety. The research only use one case study, which is Android One, which is a 60 second online video advertising that can be skipped. Based on Kusse (2013), the duration of the online video advertising and the ability to skip the online video advertising does affect attitude toward the online video advertising. A similar study with a different case study may have different results if the duration is different or if there is no ability to skip the online video advertising. This limitation may have affect the validity and reliability of the research.
To help prevent further research from being not optimal due to the similar limitations with the research, the researcher would like to give a suggestion for further research for each limitation. Firstly, the samples should be from more than one city. That way, the data will be more representative for the population because Android One online video advertising is available for the whole country. To not waste too much time and cost for gathering the data, online questionnaire distribution can be more ideal.
Secondly, there should be more variety of case study with difference in the duration and ability to skip the online video advertising. Therefore, the possibility of the data being invalid and unreliable due to the duration and the ability to skip the online video advertising will be decreased and the results will be more general in explaining the effects of online video advertising.
REFERENCES
Alizadeh, A., Moshabaki, A., Hoseini, S. H., & Naiej, A. K. (2014). The Comparison of Product and Corporate Branding Strategy: a conceptual framework.
Ambient Digital Indonesia. (n.d.). Ambient Digital Indonesia. Retrieved March 6, 2015, from
Ambient Digital Indonesia:
http://www.ambientdigitalgroup.com/indone sia/
Android One: Selalu Terbaru dari Google. (2015, February 22). Retrieved March 1, 2015, from Youtube:
https://www.youtube.com/watch?v=fmj-C5JpiyU
Beauvillain, A., & Tiger, O. (2013). Perceived intrusiveness and trust in relation to online advertising. Umeå: Umeå University. Bhattacharya, T. (n.d.). Advertising - Its Importance
in Marketing. Retrieved March 1, 2015, from
The CEO Insights:
http://www.theceoinsights.com/joomla/index .php?option=com_content&view=article&id
=153:advertising-its-importance-in-marketing&catid=54:articles&Itemid=58 Boduszek, D. (n.d.). Multiple Regression. Retrieved 4
25, 2015, from www.danielboduszek.com: http://www.danielboduszek.com/documents/
Multiple%20Regression%20-%20D.%20Boduszek.pdf
Choi, S. M., Kim, E., Kim, S., & Yeh, Y.-H. (2013).
Factors Affecting Advertising Avoidance on Online Video Sites.
Chowdhry, A. (2014, November 12). Video Advertising Industry Heats Up This Year. Retrieved March 1, 2015, from Forbes: http://www.forbes.com/sites/amitchowdhry/2 014/11/12/yahoo-acquires-brightroll/
Cooper, D. R., & Schindler, P. S. (2014). Business Research Methods. In D. R. Cooper, & P. S. Schindler, Business Research Methods (pp. 21-22, 55, 96-97, 249-254, 257-261, 348-361). New York: McGraw-Hill/Irwin. CreativeVisions Indonesia. (n.d.). Youtube Ad.
Retrieved March 1, 2015, from CreativeVisions Indonesia: http://www.cv-indonesia.com/services/branding_youtube.ht ml
Edwards, S. M., Li, H., & Lee, J.-H. (2002). Forced Exposure and Psychological Reactance: Antecedents and Consequences of the Perceived Intrusiveness of Pop-Up Ads. eMarketer. (2013, May 22). Ad Agencies See
Effectiveness in Online Video. Retrieved March 1, 2015, from eMarketer: http://www.emarketer.com/Article/Ad- Agencies-See-Effectiveness-Online-Video/100991
Entner, R. (2015, February 10). 2014 US Mobile Phone sales fall by 15% and handset replacement cycle lengthens to historic high. Retrieved April 25, 2015, from Recon Analytics:
http://reconanalytics.com/2015/02/2014-us- mobile-phone-sales-fall-by-15-and-handset- replacement-cycle-lengthens-to-historic-high/
Ghozali, I. (2011). Aplikasi analisis multivariate dengan program SPSS (5th ed). Semarang: Badan Penerbit Universitas Diponegoro Semarang.
Green, S. (1991). How Many Subject Does It Take To Do Regression Analysis. Multi Behavioral Research , 499-510.
421
Hahn, J. (2015, February 28). Android claims 81.5%of the global smartphone OS market in 2014, iOS dips to 14.8%. Retrieved March 1, 2015,
from DIGITAL TRENDS:
http://www.digitaltrends.com/mobile/worldw ide-domination-android-and-ios-claim-96-of-the-smartphone-os-market-in-2014/
Hawkins, D. I., & Mothersbaugh, D. L. (2013). Consumer Behavior. In D. I. Hawkins, & D. L. Mothersbaugh, Consumer Behavior (pp. 384-390, 6-8). New York: McGraw-Hill/Irwin.
Homer, P. M. (1990). The Mediating Role of Attitude Toward the Ad: Some Additional Evidence.
Texas: Journal of Marketing Research. Husein, U. (2005). Metode Penelitian untuk Skripsi
dan Tesis Bisnis. Bandung: PT. Raja Grafindo Persada.
Indonesia posts 607% increase in video ads: TubeMogul. (2015, February 19). Retrieved March 5, 2015, from Digital News Asia: https://www.digitalnewsasia.com/media/indo nesia-posts-607-per-cent-increase-in-video-ads-tubemogul
Jaffe, N. (2014, September 23). Online Video is Reshaping Southeast Asia's Media Landscape. Retrieved March 1, 2015, from Nielsen:
http://www.nielsen.com/apac/en/insights/ne ws/2014/online-video-reshaping-southeast-asian-media-landscape.html
Kothari, C. (2004). Research Methodology : Methods and Techniques. New Delhi: New Age International (P) Limited.
Kotler, P., & Keller, K. L. (2012). Marketing Management. In P. Kotler, & K. L. Keller,
Marketing Management (pp. 263, 268, 500). Essex: Pearson Education.
Kusse, D. C. (2013). Forced pre-roll video-advertising.
Kwon, J. (2008). Identifying the Effects of Cognitive, Affective, and Behavioral Components on
Residents’ Attitudes Toward Place
Marketing. Michigan: Michigan State University.
Latif, W. B., Islam, M. A., Noor, I. B., Saaban, S. B., & Azad, M. R. (2014). Conceptual Framework of Brand Image: A Case Study of a Developing Country. Perlis: Medwell Journals.
Liu, C., Marchewka, J. T., Lu, J., & Yu, C.-S. (2004). Beyond concern—a privacy-trust-behavioral intention. Information & Management 42 , 289-304.
Manuturi, V. (2015, February 5). Android One Hits Up Indonesia. Retrieved March 1, 2015,
from JakartaGlobe:
http://thejakartaglobe.beritasatu.com/busines s/android-one-hits-indonesia/
Nielsen. (2014, December 19). The Pace is
Quickening: Marketers’ Use of Digital
Brand Advertising Grows. Retrieved March
1, 2014, from Nielsen:
http://www.nielsen.com/us/en/insights/news/ 2014/the-pace-is-quickening-marketers-use-of-digital-brand-advertising-grows.html Perner, L. (n.d.). Attitudes. Retrieved 4 12, 2015, from
USC Marshall University of Southern California:
http://www.consumerpsychologist.com/cb_A ttitudes.html
PricewaterhouseCoopers. (2011). Measuring the effectiveness of online advertising.
Rodica, B. (2009). Consumer Behavior and Enterprise Agility – A Model of the Surveyed Indicators.Iași: Gheorghe Asachi Technical
University.
Saeed, R., Lodhi, R. N., Naeem, A., Akbar, A., Sami, A., & Dustgeer, F. (2013). Consumer’s
Attitude Towards Internet Advertising in Pakistan. IDOSI Publications.
Spector, P. (1997). Job Satisfaction : Application, Assesment, Cause, and Consequences.
Thousand Oaks, CA: SAGE Publications. Statista. (2015). Market share held by mobile
operating systems in Indonesia from January 2012 to December 2014. Retrieved 3 13, 2015, from Statista The Statistics Portal: http://www.statista.com/statistics/262205/ma rket-share-held-by-mobile-operating-systems-in-indonesia/
Surabaya City Online. (n.d.). Retrieved May 10, 2015, from Surabaya City Online: http://www.surabaya.go.id/eng/
VideoBloom. (n.d.). Glossary. Retrieved 3 22, 2015,
from VideoBloom:
http://www.videobloom.com/why-videobloom/
Vinson, C. (n.d.). Learning Domains and Delivery of Instruction. Retrieved 4 21, 2015, from FOOTHILL-DE ANZA Community College District:
http://pixel.fhda.edu/id/learning_domain.htm l
Voss, K. E., Spangenberg, E. R., & Grohmann, B. (2003). Measuring the Hedonic and Utilitarian Dimensions of Consumer Attitude. American Marketing Association. Wilson, L. O. (n.d.). Three Domains of Learning –
Cognitive, Affective, Psychomotor. Retrieved 4 11, 2015, from The Second Principle: http://thesecondprinciple.com/instructional-design/threedomainsoflearning/
Yuni A, T. (2015, February 4). Google Resmi Umumkan Peluncuran Android One di Indonesia. Retrieved March 1, 2015, from Pricebook:
422
5/02/04/674/google-resmi-umumkan- peluncuran-android-one-di-indonesia#.VPXjJXyUet0
Zhang, P., & Wang, C. (2005). An Empirical Study on
Consumer’s Perceived Value and Attitude
Toward Advertising. Alaska: Proceedings of the 6th Global Information Technology and Management (GITM) World Conference.