Original Citation:
The effects of hemodynamic lag on functional connectivity and behavior after stroke
Publisher:
Published version: DOI:
Terms of use: Open Access
(Article begins on next page)
This article is made available under terms and conditions applicable to Open Access Guidelines, as described at http://www.unipd.it/download/file/fid/55401 (Italian only)
Availability:
This version is available at: 11577/3191542 since: 2018-02-09T17:05:21Z
10.1177/0271678X15614846
The effects of hemodynamic lag
on functional connectivity and behavior
after stroke
Joshua S Siegel
1, Abraham Z Snyder
1,2, Lenny Ramsey
1,
Gordon L Shulman
1and Maurizio Corbetta
1,2,3Abstract
Stroke disrupts the brain’s vascular supply, not only within but also outside areas of infarction. We investigated temporal delays (lag) in resting state functional magnetic resonance imaging signals in 130 stroke patients scanned two weeks, three months and 12 months post stroke onset. Thirty controls were scanned twice at an interval of three months. Hemodynamic lag was determined using cross-correlation with the global gray matter signal. Behavioral performance in multiple domains was assessed in all patients. Regional cerebral blood flow and carotid patency were assessed in subsets of the cohort using arterial spin labeling and carotid Doppler ultrasonography. Significant hemodynamic lag was observed in 30% of stroke patients sub-acutely. Approximately 10% of patients showed lag at one-year post-stroke. Hemodynamic lag corresponded to gross aberrancy in functional connectivity measures, performance deficits in multiple domains and local and global perfusion deficits. Correcting for lag partially normalized abnormalities in measured func-tional connectivity. Yet post-stroke FC–behavior relationships in the motor and attention systems persisted even after hemodynamic delays were corrected. Resting state fMRI can reliably identify areas of hemodynamic delay following stroke. Our data reveal that hemodynamic delay is common sub-acutely, alters functional connectivity, and may be of clinical importance.
Keywords
Acute stroke, brain ischemia, cerebral blood flow, cerebral hemodynamics, cognitive impairment, functional MRI
Received 23 June 2015; Revised 2 September 2015; Accepted 6 October 2015
Introduction
Stroke causes a disruption to the brain’s vascular supply that leads to infarction and structural damage of gray/white matter, but also remote physiological and metabolic effects in structurally normal regions of the brain. It is becoming increasingly apparent that an understanding of behavioral deficits post-stroke will require a complete description not only of lesion topography, but also of the complement of metabolic, structural, and functional connectivity abnormalities. These changes, in turn may relate to abnormal neuronal dynamics at the level of whole brain networks.1,2 Functional MRI is the primary tool to examine network level abnormalities caused by brain diseases based on the premise of a nor-mal coupling between neuronal activity and related blood flow/volume changes (hemodynamic response, HDR).
However, when studying disease states, a normal hemodynamic response cannot be assumed.3 For instance, prior work has established that the hemo-dynamic response can be altered following stroke.4,5 In patients with cerebrovascular disease, peak BOLD response delays of up to 20 s have been reported in the
1
Departments of Neurology, Washington University School of Medicine, Washington University, St. Louis, MO, USA
2Mallinckrodt Institute of Radiology, Washington University School of
Medicine, Washington University, St. Louis, MO, USA
3Anatomy & Neurobiology at Washington University School of Medicine,
Washington University, St. Louis, MO, USA
Corresponding author:
Joshua S Siegel, Department of Neurology, Washington University School of Medicine, 4525 Scott Ave, Box 8111 St. Louis 63110, MO, USA. Email: [email protected]
Journal of Cerebral Blood Flow & Metabolism
0(00) 1–15 !Author(s) 2015 Reprints and permissions:
sagepub.co.uk/journalsPermissions.nav DOI: 10.1177/0271678X15614846 jcbfm.sagepub.com
affected hemisphere.6–8Such responses are said to exhi-bit hemodynamic lags.
In resting state functional MRI (R-fMRI), functional connectivity between regions of the brain is estimated by the temporal correlation of the spontaneous BOLD signal. Two recent studies observed BOLD signal delays in R-fMRI in small cohorts.9,10These studies raise con-cerns about how hemodynamic lags might be affecting measurement of functional connectivity after stroke.
In this study, we address fundamental questions con-cerning cerebrovascular physiology in stroke, specific-ally concerning the importance of hemodynamic lags in relation to changes of functional connectivity (FC), regional cerebral blood flow (rCBF) or diaschisis, as well as behavior and recovery. We report on a longitu-dinal study of hemodynamic lag in a cohort of 130 first time ischemic and hemorrhagic stroke patients. We consider the longitudinal trends, physiological cor-relates, and clinical implications of hemodynamic lag. We demonstrate a relationship between lag, and decrements of blood flow, and severity of clinical def-icits after stroke. We also demonstrate that lag pro-foundly affects measures of FC and we investigate the effects of hemodynamic lag on previously reported FC–behavior relationships. Finally, we test a method for correcting for hemodynamic lag in measures of functional connectivity.
Materials and methods
Patient enrollment
All aspects of this study were approved by the Washington University School of Medicine (WUSM) Internal Review Board. Written informed consent was obtained from all participants in accordance with the Helsinki Declaration and procedures established by the Washington University in Saint Louis Institutional Review Board and all partici-pants were compensated for their time. First time stroke patients were recruited by a research coordinator through the in-patient service at Barnes-Jewish Hospital (BJH) and the Rehabilitation Institute of St. Louis (TRISL). Inclusion criteria for stroke patients were: (1) age 18 or greater, (2) first symptomatic stroke, ischemic or intrapar-enchymal hemorrhagic etiology, (3) clinical evidence of motor, language, attention, visual, or memory deficits based on neurological examination, and (4) time of enroll-ment<2 weeks post-stroke onset. Exclusion criteria were: (1) the inability to maintain wakefulness during testing, (2) the presence of other neurological, psychiatric, or medical conditions that preclude active participation in research and/or may alter the interpretation of the behavioral/ima-ging studies (e.g. dementia, schizophrenia), or limit life expectancy to less than 1 year (e.g. cancer or congestive heart failure class IV), (3) evidence of clinically significant
periventricular white matter disease (equal or above grade 5 of Longstreth and colleagues11), and (4) contraindica-tions for MRI including claustrophobia or scanner incom-patible implants. In total, 6260 charts were screened; 130 patients met all inclusion criteria and completed the entire sub-acute protocol (mean age 52.8 with range 22–77, 119 right handed, 61 female, 64 right hemisphere). Of those, 101 had ischemic strokes, 21 hemorrhagic, 5 ischemic with later hemorrhagic conversion, and 3 carotid or vertebral dissection. Other features of the patient cohort and lesion distribution were described previously.12
Stroke source population
We conducted a control analysis to determine whether our stroke sample was representative of the general stroke population. The demographic and medical char-acteristics of the patients in our sample were compared to those of a large control group (n¼1209) that was selected from the Cognitive Rehabilitation Research Group database13 of all patients seen at Barnes Jewish Hospital between 2008 and 2013 (n¼6260) using the same inclusion/exclusion criteria. All included stroke and control subjects provided informed consent according to procedures approved by the Institutional Review Board at Washington University.
Healthy control enrollment
Thirty healthy, demographically matched control sub-jects were recruited and underwent the same behavioral and imaging exams. Inclusion criteria for control sub-jects were: healthy adult matched to stroke study popu-lation by age, gender, handedness, and level of education. Exclusion criteria were: (1) a positive history of neurological, psychiatric, or medical abnormalities preventing participation in research activities, (2) a his-tory of atherosclerotic (coronary, cerebral, peripheral) artery disease, and (3) an abnormal neurological exam-ination with signs of CNS dysfunction. The average age at the time of enrollment was 55.7 years (SD¼11.5) with a range from 21 to 83 years.
R-fMRI acquisition and analysis
Patients were studied 2 weeks (mean¼13.4 days, SD¼
4.8 days), 3 months (mean¼112.5 days, SD¼18.4 days), and 1 year (mean¼393.5 days, SD¼55.1 days) post stroke onset. Controls were studied twice at an interval of three months. All imaging were per-formed using a Siemens 3 T Tim-Trio scanner at the Washington University School of Medicine (WUSM) and the standard 12-channel head coil. The MRI protocol included structural, functional, pulsed arterial spin labeling (PASL), and diffusion tensor scans.
Structural scans included: (1) a sagittal T1-weighted MP-RAGE (TR¼1950 ms, TE¼2.26 ms, flip angle¼
90, voxel size¼1.01.01.0 mm); (2) a transverse
T2-weighted turbo spin-echo (TR¼2500 ms, TE¼
435 ms, voxel-size¼1.01.01.0 mm); and (3) sagit-tal FLAIR (fluid attenuated inversion recovery) (TR¼7500 ms, TE¼326 ms, voxel-size¼1.51.5
1.5 mm). PASL acquisition parameters were: TR¼
2600 ms, TE¼13 ms, flip angle¼90, bandwidth
2.232 kHz/Px, and FoV 220 mm. A total of 120 volumes were acquired (322 s total), each containing 15 slices with slice thickness 6 mm and 23.7 mm gap. Resting state functional scans were acquired with a gradient echo EPI sequence (TR¼2000 ms, TE¼27 ms, 32 con-tiguous 4 mm slices, 44 mm in-plane resolution) during which participants were instructed to fixate on a small cross in a low luminance environment. Central fixation and wakefulness were monitored with an eye tracker and recorded. Six to eight R-fMRI runs, each including 128 volumes (30 min total), were acquired.
Participants with less than 5 minutes of retained R-fMRI data after strict motion scrubbing were excluded from further analysis. The fraction of partici-pants providing useful fMRI data was 107/130 patients at two weeks, 86/94 patients at three months, 74/82 patients at one year, 24/30 controls at scan 1, and and 24/29 controls at scan 2 (Table S1).
R-fMRI data preprocessing
R-fMRI data underwent preprocessing as previously described by Baldassarre and colleagues.14 Briefly, this included: (1) compensation for asynchronous slice acquisition using sinc interpolation; (2) elimination of odd/even slice intensity differences resulting from inter-leaved acquisition; (3) whole brain intensity normalization to achieve a mode value of 1000; (4) spatial realignment within and across R-fMRI runs; and (5) resampling to 3 mm cubic voxels in atlas space including realignment and atlas transformation in one resampling step. Cross-modal (e.g. T2-weighted to T1-weighted) image registra-tion was accomplished by aligning image gradients.15 Cross-model image registration in patients was checked by comparing the optimized voxel similarity measure to the 97.5 percentile obtained in the control group. In some cases, structural images were substituted across sessions to improve the quality of registration.
Lesion segmentation
Lesions were manually segmented using Analyze (www.mayo.edu) by inspection of the structural images (T1-weighted, T2- weighted, FLAIR), simultan-eously displayed in atlas space. All segmentations were reviewed by two neurologists (Maurizio Corbetta and
Alexandre Carter) with special attention to distinguish-ing lesion from CSF and hemorrhage from surrounddistinguish-ing vasogenic edema. The lesions ranged from 0.02 cm3to 82.97 cm3with a mean of 10.15 cm3(SD¼13.94 cm3).
Pulsed ASL and carotid Doppler
Pulsed arterial spin labeling (PASL) measures of regional cerebral blood flow (rCBF) were acquired in a subset of patients (27 sub-acute patients and 20 controls). Two proximal inversions with control for off-resonance effects (PICORE Q2) PASL-MRI perfusion scans were col-lected. PASL data were processed as described previ-ously.16 Normalized perfusion (percent of control average) was determined for a set of 169 regions of inter-est (ROIs) described below. Bilateral carotid Doppler was also acquired at initial post-stroke hospital admission for 66 of the included patients. Carotid Doppler velocity values were converted to categories of (1)50% occlu-sion, (2) 51–79% occluocclu-sion, or (3)80% occlusion, based on guidelines from the Society of Radiologists in Ultrasound Consensus Conference.17PASL and carotid Doppler were compared with R-fMRI measures of local (region of interest) and global (affected hemispheric) lag to determine how perfusion measures associate with lag.
Behavioral testing
All subjects and controls underwent a behavioral bat-tery that included assessment of motor, language, attention, memory, and visual function following each scanning session. Overall clinical deficit was also assessed in each patient using the NIH stroke scale (NIHSS).18Imaging and behavioral testing session usu-ally were performed on the same day. Dimensionality reduction was performed on the behavioral perform-ance data as described previously.12 Principal compo-nents analysis was performed on all tests within a behavioral domain to produce a single score that pre-dicted the majority of variance across tasks. The ‘Motor’ score describes contralesional deficits that cor-related across shoulder flexion, wrist extension/flexion, ankle flexion, hand dynamometer, nine hole peg, action research arm test, timed walk, functional independence measure, and the lower extremity motricity index. The ‘Attention (visual field)’ score describes contra-lesional visual field effects in Posner, Mesulam, and BIT center of cancellation tasks. A separate ‘Attention (sustained)’ score loaded on non-spatial measures of overall per-formance, reaction time, and accuracy on the same tests. The ‘Spatial Memory’ score loaded on the Brief Visuospatial Memory Test and spatial span. The ‘Verbal Memory’ score loaded on the Hopkins Verbal Learning Test. The ‘Language’ score loaded on both comprehension (complex ideational material,
commands, reading comprehension) and production (Boston naming, oral reading).
ROIs
A set of 169 regions of interest (ROIs), defined based on Hacker and colleagues,19 were used in post hoc ana-lyses. Briefly, the ROIs were selected based on a meta-analysis of task fMRI studies and refined to opti-mally represent seven resting state networks. ROI-based analysis was used for (1) lag laterality measure-ment, (2) resting BOLD power analysis, and (3) FC analyses. ROIs partially or entirely overlapping with the infarct were excluded from all analyses (excepting the within-lesion BOLD power analysis).
Gray matter, white matter, and CSF compartments were defined in individual subjects using automated seg-mentation by FreeSurfer20. Any voxels that overlapped with the manual segmented lesion masks were excluded.
Lag measure
The R-fMRI data were first temporal bandpass filtered, retaining frequencies between 0.009 and 0.09 Hz. Next, frame censoring identified volumes with a
DVARS measure >0.6% or a framewise displacement
>0.5 mm to be excluded from the R-fMRI computa-tions.21A shift mask was then generated by removing every frame within 4TR of masked frames. A minimum of 150 usable frames was required for subject inclusion in the present results. Thus, 23/130 sub-acute patients and 6/30 controls were excluded. In the retained data, on average, 570 out of 870 frames remained in sub-acute patients, and 495 of 851 frames remained in con-trols (Table S1). Next, a reference signal was generated from the average timecourse in each subject’s [non-lesion] gray matter compartment.
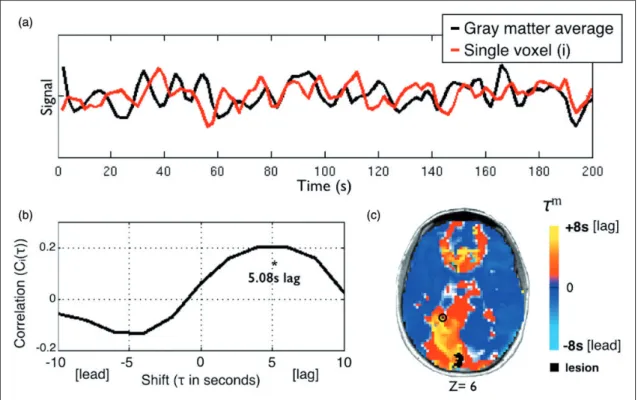
Lagged cross-correlation analysis with reference to the global gray matter reference signal was performed for each voxel over the range4 TRs (8 s) (Figure 1) as follows: CiðÞ ¼ ð1=nÞ X t gðtÞ siðtþÞ sig ð1Þ
where g is the gray matter signal,siis the signal in voxel
i, andsi andgare the standard deviations of the two signals. The summation runs over frames indexed byt, andn is the number of frames included after a shift of
Figure 1. Using temporal cross-correlation to measure lag in resting state fMRI. (a) The global reference signal (black line, top panel) is measured by averaging all non-lesioned gray matter voxels. Each voxel timecourse (red line, top panel) is then compared to the reference signal. The exemplar voxel is circled in (c). (b) The voxel timecourse is shifted forward and backward 8 s (4 TR) and shift correlation is computed (equation 1). 5.08 s is the optimal shift determined by parabolic interpolation. (c) Voxelwise hemodynamic lag image. Orange/yellow indicates a lag behind the reference signal, cyan indicates a lead. Lesioned areas are shown in black. A small caudal infarct in left posterior cerebral artery (PCA) territory shows associated lag in the entire left PCA distribution. A full lag map for this individual is shown in row 5 of Figure 2.
(8 s toþ8 s). To determine the shift that maximizes the cross-correlation function at a temporal resolution finer than 1TR, the lag () corresponding to the max-imum ofCið Þ was identified.Cið Þ at this lag, as well as one step forward and backward, was fit with a para-bolic function and the peak value,CiðmÞ, and corres-ponding temporal shift (m) was computed.22 Positive and negative values ofmcorrespond, respectively, to a lag or lead relative to the mean gray matter signal. The lag measure,m, was computed for every voxel within the brain. Voxels within the lesion as well as voxels not positively correlated with the global signal on the inter-val, 8 5 5 þ8 (in units of seconds), were excluded from region of interest and FC analyses. For visualization, lag maps were smoothed with a 3 mm full width at half maximum kernel.
Lag laterality
Inspection of lag maps demonstrated that lags>2 s almost always were confined to the lesioned hemisphere. Thus, it was possible to compute lag laterality scores as a measure of average lag difference in the affected versus unaffected hemisphere. Lag laterality was computed for each patient by finding the average lag for each of the 169 ROIs (excluding those intersecting the lesion) and then computing the difference between all right hemisphere ROIs (78/169) and all left hemisphere ROIs (78/169). The reliability of measured lag maps as well as laterality scores theoretically depends on the quantity of available data.10These relationships were estimated using data sub-samples of duration 40 s to 800 s.
The lag laterality score was used to compare lag severity to clinical variables. Because lag laterality values were not normally distributed, lag laterality was compared with categorical variables using a Mann-Whitney U test, and to continuous variables using Spearman’s rank test.
Resting state BOLD power analysis
The BOLD signal power across the low frequency range typically used for resting state FC (0.009–0.09 Hz) was computed on all ROI timecourses in all acute sub-jects. ROIs were then subdivided into three categories: (1) ROIs partially or wholly within a lesion, (2) ROIs that show greater than 2 s of lag, and (3) all other ROIs. The average power spectrum was then computed for each category.
Correcting functional connectivity measures
for hemodynamic lag
Hemodynamic lags theoretically distort FC measures in a manner that is potentially correctible. To address this question, corrected FC measures were computed by shifting regional timeseries according to the previously
determined hemodynamic lags. In greater detail, for any pair of signals, one of the timeseries was shifted by the lag difference and this difference was rounded to the nearest TR to avoid timeseries interpolation. FC was then computed using the standard formula (Fisher z-transformed Pearson correlation zðrÞ). The correction procedure was used to create corrected FC maps for selected ROIs. In addition, indices of interhemispheric FC in the motor system were computed with and with-out correcting for hemodynamic lag. This index was computed as the average z(r) over multiple motor ROI pairs (10 in the left hemisphere, 12 in the right hemi-sphere), excluding any ROI compromised by lesion.
To determine if correcting lag improves FC, aberrancy of FC relative to controls was determined for all ROIs in all patients.23Functional connectivity aberrancy was first quantified for each connection (169-choose-2) by compar-ing to the mean and standard deviation for that connec-tion in controls. Z-normed FC aberrancy was computed as FCsubFCcontrol
=SD, where the over-bar indicates mean over controls and SD is standard deviation over controls. Finally, to determine aberrancy of a given ROI, the Z-score for all of its connections was averaged.
Results
To determine the topographic extent and biological correlates of hemodynamic lag following stroke, we performed a longitudinal study of a cohort of stroke patients (n-130) and age-matched controls (n-30). To assess whether the study sample was representative of a the larger stroke population, it was compared to a larger source population of 1209 patients. The study sample was well matched to the source population on stroke variables (etiology, tPA, mechanical thrombec-tomy, NIHSS in hospital), but showed some differences in demographics and clinical predisposing factors (age, race, coronary artery disease and atrial fibrillation) (Table S2). Further details of this comparison are reported in the supplement. Of the 130 patients studied, 107 had adequate R-fMRI and behavioral data. Of those, 87 had ischemic strokes and 15 had hemorrhagic strokes. Patients with ischemic stroke were further clas-sified based on TOAST criteria.24 Regarding ischemic subtypes, large-artery atherosclerosis was observed in 16 patients, cardioembolism in 12 patients; small-vessel occlusion in 8 patients, and undetermined eti-ology (two or more causes identified, stroke is crypto-genic, or evaluation is incomplete) in 45 patients.
Lag analysis reveals sizeable delays
in the hemodynamic response
Lag in the resting BOLD signal was measured across the brain relative to the global gray matter signal as
described in Figure 1. Figure 1(a) and (b) illustrates our approach for measuring lag cross-correlation in every voxel. Figure 1(c) shows the lag map for one subject. The subject’s lesion is shown in black and the voxel used in Figure 1(b) is circles. Lag severity was quanti-fied by comparing the lag laterality – a global measure of lag severity – to the distribution of 24 healthy con-trols. At 1–2 weeks post-stroke, 32 out of 107 sub-acute stroke patients (30%) exhibited lag measures>2 SD of the control mean (95% confidence interval) and 19 out of 107 (17.8%) were >3 SD (99.7% confidence interval).
Lag laterality also was measured in voxels restricted to white matter; this quantity was highly correlated (r¼0.7221, P¼1104
) with lag laterality measured in gray matter voxels, although the magnitude of gray
matter lag measures was larger (Figure S1,
Supplementary material). We also computed the aver-age lag difference over all homotopic ROI pairs. This quantity was significantly correlated with lag laterality as defined above (r¼0.55,P<109).
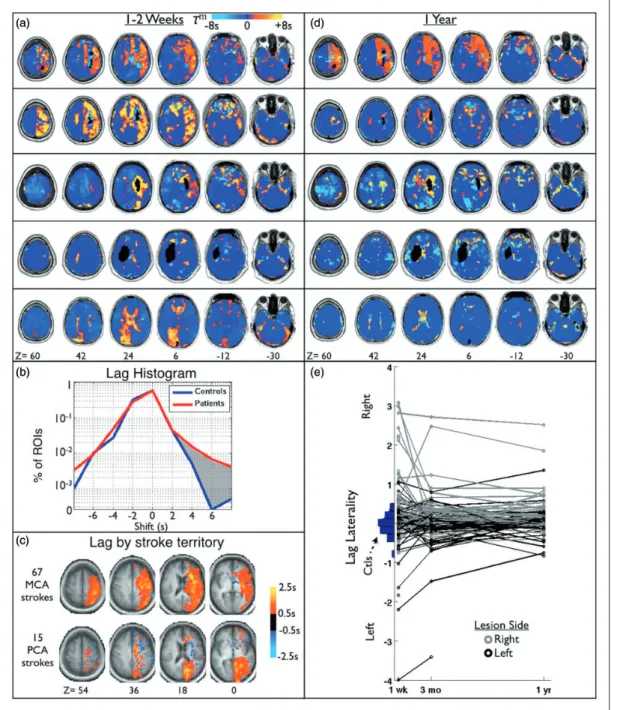
Figure 2 illustrates hemodynamic lag in our cohort. Figure 2(a) illustrates lag maps obtained in five repre-sentative patients at the sub-acute period. Figure 2(b) shows a histogram of lag value frequencies measured in the set of 169 ROIs in all patients and all controls. By convention, negative shift values indicate a lead ahead of the reference signal and positive values indicate a lag behind it. Both groups exhibited ROIs that lead the gray matter signal (m <0), but the patients exhibited more ROIs with significant positive lag (patients: 4.0%>2 s, 1.7%>4 s; controls: 1.9%>2 s, 0.2%>4 s).
Figure 2(c) shows subgroup average lag maps gen-erated by subtracting contralesional from ipsilesional hemisphere and then grouping subjects by stroke arterial territory (middle vs. posterior cerebral artery). Figure 2(c) suggests that distribution of hemodynamic lag tends to follow the arterial territory of the stroke. While severity of hemodynamic lag showed no significant relationships to either lesion size (Table 1) or location, the topographic distribu-tion of lesions that produced severe lag did not visu-ally differ from the distribution of lesions in the entire cohort.
To exclude the possibility that eyes open/closed dur-ing the R-fMRI scan biased our results, we measured the percent of time with eyes open for each R-fMRI session. In the first R-fMRI session, patients main-tained eyes open 66% of the time on average, and controls maintained eyes open 77% of the time. However, a two-way ANOVA found no significant effect of group (P¼0.846) or of timepoint (P¼0.677) on eyes open. Moreover, a Spearman’s correlation of eyes open with lag laterality measured at the sub-acute
timepoint did not identify a significant relationship (r¼0.02,P¼0.8).
Lag recovery
Figure 2(d) illustrates lag maps for the same five patients at 1year follow-up. A variety of outcomes is evident, ranging from no change (top) to complete reso-lution (bottom row). Figure 2(e) shows lag laterality scores over all available data, illustrating the trend of lag over time for all patients. A vertical histogram of lag laterality scores in 24 age-matched controls is
shown in blue on the left (mean¼ 0.046,
SD¼0.268). The patient lag laterality scores are shown to the right, shaded by lesion side (left-black, right-gray). Figure 2(e) demonstrates that lag tends to occur on the side of the lesion and most often recovers over time. Only seven out of 86 (8.0%) patients at three months post-stroke and five out of 74 (6.1%) patients at one year showed lag laterality >3 SD of controls (Table S1).
Lag predicts performance deficits
Lag laterality – difference in lag values between the left and right hemisphere – provided an objective measure of lag severity that was compared to several clinical and demographic measures (Table 1). We did not find a significant correlation between lag and neurologic his-tory (TIA, Migraine, other), psychiatric history (depression, substance abuse, other), cardiac history (hypertension, CAD, DM, other), and smoking history. None of the patients assessed received thrombectomy. And 12% (13) of patients received tissue plasminogen activator (tPA). Patients receiving tPA showed greater lag than those who had not (P¼0.028).
Next, associations between lesion type and charac-teristics and lag laterality were investigated. No signifi-cant different in lag was identified in hemorrhagic versus ischemic strokes (P¼0.28). Additionally, no dif-ference was found between stroke subtypes defined
based on TOAST criteria (ANOVA P¼0.13).
However, lag laterality was correlated with lesion size (r¼0.34,P¼5.5105
).
Finally, lag laterality was compared to behavioral deficit. Lag laterality was correlated with overall deficit measured by NIHSS (r¼0.26,P¼0.035) and deficit in numerous behavioral domains; spatial attention (r¼ 0.31, P¼0.0018), sustained attention deficit (r¼ 0.28, P¼0.0048), spatial memory deficit (r¼ 0.24, P¼0.015), and language (r¼ 0.21,
P¼0.016). Recovery of lag by one-year post-stroke was correlated with recovery of spatial attention (r¼ 0.30, P¼0.02). All P-values are not corrected for multiple comparisons.
Areas of lag show reduced blood flow
Figure 3 shows regional lag in stroke patients relative to regional cerebral blood flow (rCBF) and lag laterality relative to internal carotid artery occlusion. rCBF in
areas of hemodynamic lag less than 1 s was, on average, 92.46% than that of controls. Areas with lag greater than 2 s showed significantly lower rCBF and a monotonic decrease in perfusion with increasing lag Figure 2. Delay in the resting hemodynamic response (lag) is observed after stroke. (a) Lag maps for five sub-acute stroke patients overlaid on MP-RAGE. Lesion locations are shown in black. (b) Histogram of lag value frequencies measured in a set of 169 ROIs in both patients and controls. Both contain some regions that appear to lead the gray matter signal, but the patients show more regions that lag behind it than controls (shaded gray – 1.7% vs 0.2% of ROIs>þ4 s). (c) To generate a group average, subjects were grouped by stroke arterial territory and the contralesional hemisphere was subtracted from the ipsilesional hemisphere. Average lag maps for two largest groups, middle cerebral artery (MCA), and posterior cerebral artery (PCA), are shown. (d) Lag maps at the one-year follow-up from the same patients shown in (a). Lag appears to largely resolve by 1year post-stroke onset in many but not all cases. (e) Lag laterality scores for all patients included in the study at all timepoints. Patients with only one timepoint are shown as a single circle. Patients are divided by lesion side to show the frequent correspondence with lag side.
(Figure 3). An analysis of variance (ANOVA) showed an effect of carotid occlusion on lag (P¼8.32104), with the 80% occlusion group showing greater lag than the50% occlusion (t[58]¼ 3.76, P¼1.97
104) and 51–79% occlusion groups (t[11]¼ 2.25,
P¼0.023).
These results raise the question of whether hypo-perfusion in the acute post-stroke period recovers in parallel with lag. To address this question, we mea-sured change in lag (1 year minus 2 weeks) versus change in rCBF for all ROIs showing lag >0 sub-acutely. Although a significant relationship was pre-sent between recovery of lag, and recovery of rCBF (Pearson’s r¼ 0.12; P¼0.039), the variance explained by this relationship was small (r2¼0.015). This may be because overall, measures of perfusion did not change significantly between two weeks and one year post-stroke (two-week average¼85.7% of controls, one-year average¼86.4% of controls; paired t-test P¼0.3719). Thus, while a strong rela-tionship between lag and rCBF is present sub-acutely, areas in which lag recovers do not necessarily return to normal perfusion.
Lag and resting state functional
connectivity
A second goal of this study was to determine how lag affects measurement of resting state functional connect-ivity (FC). To this end, we explored how lag affects (1) properties of the BOLD signal, (2) measurement of functional connectivity using R-fMRI, and (3) FC-behavior relationships.
Altered BOLD signal power
R-fMRI BOLD signal characteristics were fundamen-tally altered in areas of lag (Figure 4). The 169 ROIs were divided in to three categories: no lag, lag, and lesion. Signal power was evaluated in the range of 0.009–0.09 Hz. The blue, red, and black lines show BOLD signal power in normal tissue, regions with
>2 s lag, and lesion, respectively. Areas of lag showed significantly decreased power relative to no-lag tissue in the range of 0.046–0.09 Hz. In the lower resting state frequency range, power in areas of lag was similar to that of areas of lesion.
Lag profoundly disrupts functional connectivity
but can be partially corrected
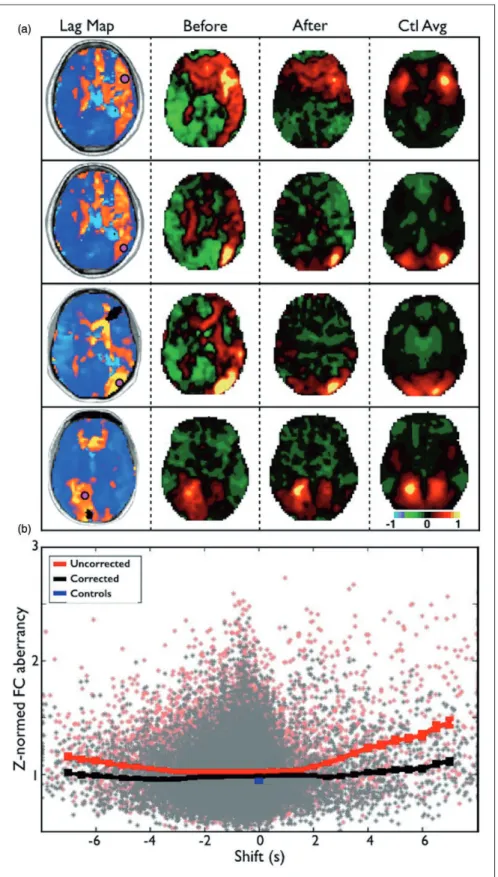
Analysis of functional connectivity (FC) revealed that hemodynamic lag considerably alters FC measures after stroke. Figure 5(a) shows seed-based correlation maps for four ROIs in different locations that showed
>2 s of lag. The leftmost column shows the four ROIs overlaid on the lag maps. The second column shows the correlation map for each ROI. The third column shows correlation maps after correction by shifting the timecourse by the measured lag. The rightmost column shows the group average correlation map for Table 1. Clinical and behavioral correlates of lag.
P-value
(uncorrected) Relationships Neurological History
Migraine (5) 0.48 Other neurological history (5) 0.11 Psychological History
Depression (5) 0.15 Substance abuse (13) 0.29 Cardiac History
Hypertension (74) 0.70 Coronary artery disease (9) 0.98 Diabetes Mellitus (33) 0.18 Atrial Fibrillation (5) 0.46 Other
Smoker within past year (53) 0.79
tPA (13) 0.028 tPA>none Age 0.75
Type (ischemic¼87, hemorrhagic¼14)
0.28
Lesion size 7E-04 0.34 Post-stroke Deficit
NIHSS 0.035 0.26 Motor 0.09
Attention (visual field) 0.0018 0.31 Attention (sustained) 0.0048 0.28 Spatial Memory 0.015 0.24 Verbal Memory 0.17
Language 0.016 0.21 Lag Recovery (1 yr-acute)
vs Deficit Recovery (1 yr-acute)
NIHSS (1 yr-acute) 0.053 Motor 0.92
Attention (visual field) 0.020 0.30 Attention (Nonspatial) 0.44
Spatial Memory 0.46 Verbal Memory 0.75 Language 0.30
Note: For categorical variables, relationships to lag laterality were assessed using a Mann-Whitney U test. The number of included patients in that category is given in parenthesis. For continuous variables, rela-tionship to lag laterality was assessed using Spearman’s rank test. For tests withp<0.05 (not corrected for multiple comparison), the relation-ships with lag laterality is given in the right column (direction of difference for categorical, Spearman’s Rho for continuous).
the same four ROIs in the controls. Correcting time-courses for lag normalized the correlation maps to a considerable extent.
Figure 5(b) shows the relationship between lag and FC aberrancy, before and after correcting for lag, across all 169 ROIs in 107 sub-acute patients. The red line demonstrates that the degree of FC aberrancy monotonically increases with lag above 2 s. Shifting ROI timecourses to correct for lag makes the FC in those regions considerably less aberrant (black line). However, increased abnormality is still evident for
lags>2 s even after correction. This result may reflect inherent changes in the frequency content of the BOLD signal in areas of lag (Figure 4).
Stroke FC–behavior relationships persist
with lag correction
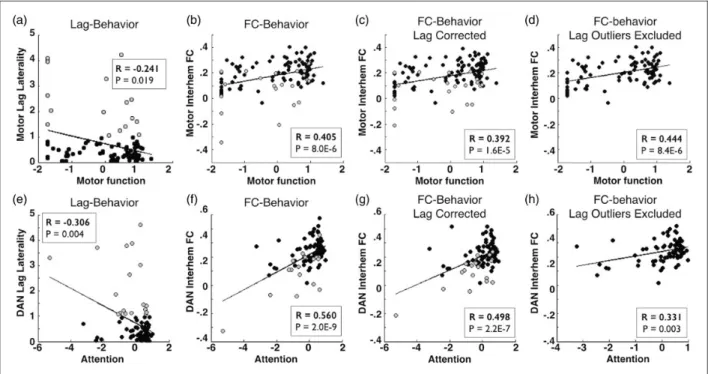
The observed relationship between lag and behavioral deficits raises important questions regarding previously observed FC–behavior relationships. To determine the effect of lag on previously established FC-behavior relationships, we measured FC–behavior correspond-ence in interhemispheric motor FC and motor function, and between interhemispheric dorsal attention network (DAN) FC and spatial neglect.
Figure 6(a) demonstrates that lag laterality mea-sured in motor ROIs correlates with motor deficits. Thus, there exists a relationship between hemo-dynamic lag and behavior. Patients with motor lag laterality >1 s are shaded gray. Figure 6(b) shows that, as previously reported, motor network interhe-mispheric FC and motor function are highly corre-lated.25 We repeated the FC analysis using the lag-corrected timeseries and found that the FC–behavior relationship persists after correction (Figure 6c). Finally, we excluded all subjects with motor lag lat-erality greater than1 s (21/117 subjects) and recom-puted the FC–behavior correlation. Figure 6(e) to (h) demonstrates the same results comparing lag and FC in the dorsal attention network with spatial neglect. In both motor and attention networks, removal of sub-jects with severe lag eliminated the observation of Figure 3. Areas of lag show reduced blood flow. (a) A sample patient showing left hemisphere lag and corresponding areas of hypoperfusion on ASL. (b) The average blood flow as a percent of healthy controls is measured for ROIs and plotted as a function of lag in all 107 sub-acute scans. Areas with greater than 2 s of lag show a significant decrement in rCBF (relative to zero lag) and hypoperfusion increases as lag magnitude increased. (c) Doppler imaging of the internal carotid artery (ICA) on the affected side is categorized as50%, 51–79%, or80% occlusion and compared lag in the affected hemisphere.
Figure 4. BOLD power spectra. ROIs with lag show signifi-cantly decreased power relative to ‘no lag’ ROIs in the upper part of the resting state range (0.046–0.09 Hz). Power in this range is closer to that of infarcted regions. Transparent boundaries depict SEM in average power.
Figure 5. Lag disrupts functional connectivity but can be partially corrected. (a) Seed-based correlation maps for four ROIs in different locations that showed>2 s of lag. The leftmost column show the four ROIs overlaid on the lag maps. The second column shows the correlation map for each ROI. The third column shows the correlation map for each ROI after the courses have been shifted to align optimally with the global signal. The rightmost column shows the average correlation map for the same four ROIs in the controls. Note improved similarity between patient correlation maps and controls following correction. (b) Relationship between lag and FC aberrancy (before and after correcting for lag) across all 169 ROIs and 107 subjects. The red line demonstrates the average aberrancy and SEM for ROIs at different shifts. Correcting timecourses for lag makes the functional connectivity in those regions less aberrant (black line).
interhemispheric anticorrelations. And in both cases, a robust FC-behavior relationship persisted (Figure 6(d) and (h)).
Discussion
Our work builds on previous observations of hemo-dynamic lag in task-based and resting state fMRI (R-fMRI) in stroke as well as other conditions asso-ciated with vascular abnormalities. We extend previ-ous observations by exploring the prevalence of lag in a representative stroke cohort, examining the relation-ship of lag to rCBF, post-stroke motor deficits, lag changes over the course of recovery, and effects of hemodynamic lag on FC. Areas of hemodynamic lag can be identified in 30% of patients two weeks after stroke, but this fraction drops to closer to one in 10 by one-year post-stroke. Hemodynamic lag preferentially occurs in the vascular distribution of the infarct, and positively correlates with the size of the lesion. We did not observe a relationship between severity of lag and etiology of the infarct (hemorrhagic, ischemic, or ischemic subtype). However, we did observe that lag severity predicts deficit in numerous behavioral
domains and that lag recovery predicts improvement in visual field attention deficit (hemispatial neglect). Finally, hemodynamic lag alters measures of FC. Lag-related distortions in FC correlation values can be partially, but not entirely, corrected by temporally shifting timecourses.
Our primary measure of lag was regional delays rela-tive to a gray matter reference signal. Prior studies of hemodynamic lag have used various reference signals including the whole brain signal,9,10 homotopic regions,26and superior sagittal sinus.27We additionally measured lags between homotopic regions and found that lag laterality measured with a global gray matter references was correlated to lag laterality measured with homotopic reference (r¼0.55, P<109). The gray matter tissue compartment defines a time series representing the hemodynamic response to neural activ-ity averaged over the whole brain. Previous work has shown that subregions within the gray matter compart-ment normally exhibit lags in the range of 1 s relative to other gray matter regions, which most likely reflect neural rather than hemodynamic phenomenology.22 Large lags not seen in healthy controls are reasonably attributed to hemodynamics.
Figure 6. Stroke FC–behavior relationships persist after lag correction. (a/e) Comparison of lag laterality measured within motor ROIs versus motor deficit or within dorsal attention network ROIs versus neglect reveal a significant relationship between lag and behavior. Patients with motor lag laterality>1 s are shaded gray. (b/f) Interhemispheric connectivity and function are highly correlated (Pearson’s correlation). (c/g) This relationship persists after lag has been corrected and (d/h) this relationship also persists when all subjects with within-network between-hemisphere lag>1 s (21/107 for motor, 21/101 for dorsal attention) are excluded.
Relationships in (a) and (e) were computed Spearman’s nonparametric rank test; all other relationships were measured with Pearson’s correlation.
Physiological implications
Observed lag following stroke could be caused by (1) cell-level microvascular damage that disrupts neurovas-cular coupling, (2) rerouting of collateral blood flow, (3) altered neural activity, or some combination of these. Prior evidence together with our findings suggests that cell-level microvascular damage is the most likely cause for hemodynamic lag. Impaired astrocyte and pericyte reactivity (neurovascular coupling) occurs in tissue that is reperfused following ischemic stroke.28,29 In fact, pericytes are more sensitive to ischemia than are neurons or astrocytes.30–32 Damage to pericytes32 or astrocytes33 can alter the HDR, suggesting that these cells likely play a role in perilesional hemodynamic changes. The higher rate of lag observed in patients that received tPA may occur because areas of transient ischemia that are reperfused as a results of the clinical intervention experience microvascular damage. Moreover, the observed decrease in BOLD signal power above 0.046 Hz (Figure 2c) may represent altered HDR kinetics. 0.046–0.09 Hz is the range of frequencies in the normal hemodynamic response to task-induced neural activity.34 Damage to pericytes or astrocytes could therefore reduce signal power in this range and could additionally lead to temporal delay by acting as a low-pass filter.
Blood flow after stroke may be rerouted through newly recruited collaterals35 with consequent changes in arterial transit time. Mean arterial transit time can be thought of as the static component of cerebral per-fusion while the HDR represents responses to neural activity. Therefore, a previously reported association between hemodynamic lag and mean arterial transit time10,27 could suggest that lag is attributable to static blood flow changes. However, static changes alone do not account for hemodynamic lag of the pres-ently observed large magnitudes (>2 s) because changes in transit time typically are on the order of less than 1 s.36
Altered neural activity theoretically could contribute to observed hemodynamic lags. However, in our data, lags were observed in white matter (Figures 1–3 and 5), which reflect predominantly the static component of per-fusion. Further evidence against a neuronal etiology has been obtained by prior studies of cerebrovascular disease patients with severely impaired BOLD fMRI responses to stimuli despite normal behavior37,38and normal neuronal responses (measured with MEG).39
Although hemodynamic lag is unlikely to reflect delayed neural responses, it is evident that neural func-tion is affected in areas of hemodynamic comprom-ise.40 We observed a strong association between lag laterality (lag difference between hemispheres) and visual field bias (Table 1). This result is consistent
with previous observations in cerebral microangiopa-thy patients linking delays in task evoked hemo-dynamic responses to performance deficits on a Stroop task.41Similarly, focal right hemisphere perfu-sion deficits have been documented in stroke patients with hemispatial neglect.42 Thus, the available evi-dence suggests that perfusion deficits can lead to abnormal brain function. However, many questions remain regarding how hemodynamic disruption affects neural and cognitive function, both acutely and chronically.
Prognostic implications
Although the pathophysiology of resting state hemo-dynamic lags is uncertain, our results suggest that lag indexes hemodynamic disruption and potentially reversible tissue compromise. Following stroke, lag occurs in the vascular distribution of the infarct, and correlates with measures of clinical deficits, mean tran-sit time9,10,27 and with hypoperfusion. Prior studies
have linked hemodynamic failure to infarct
extent43,44 and to risk of future ischemic stroke.45 Measuring lag by R-fMRI is non-invasive and may have important prognostic utility. But, fully under-standing the prognostic implications of resting state hemodynamic lag will require follow-up beyond our one-year endpoint.
We acquired 30 min of resting state data. In future studies, it should be noted that analyzing 400 s of high quality resting state data is sufficient to identify the existence of lag (Figure S2, Supplementary material). However, the reliability of lag maps continues to increase even after 20 min of resting state data acquisition.
Lag disrupts measurement of functional connectivity
Our results demonstrate that hemodynamic disrup-tion following stroke produces artifactual FC effects. In addition to delay relative to the global signal, areas of lag showed significantly decreased BOLD signal power relative to no-lag tissue at frequencies above 0.046Hz. This observation implies that simply shifting timecourses to re-align with the global signal will not adequately correct quantitative measures of FC.
Recent studies have used FC analysis of R-fMRI data to study brain network reorganization following stroke.14,23,25,46–58Importantly, our data show that pre-viously published post-stroke FC-behavior relation-ships persist even when subjects showing pathologic lag (delay of at least 1 second between affected and unaffected hemispheres) are removed from analyses. This observation confirms that post-stroke FC changes
are not trivially caused by altered hemodynamics, but rather represent pathological alterations in neuronal communication and network structure. Excluding subjects with pathologic lag eliminated the observation of interhemispheric anticorrelations (while correcting lag often only decreases the magnitude of anticorrela-tions), suggesting that homotopic anticorrelation may be a useful indicator pathologic lag in other stroke FC data sets.
We observed that shifting timecourses to re-align with the global signal reduced FC changes caused by lag. However, we do not recommend this maneuver as a means of accounting for lag-related disruptions in future stroke FC-behavior studies. The observed decrease in resting BOLD signal power suggests that the signal in areas of lag is fundamentally altered. Thus, simply shift-ing timecourses will not adequately correct quantitative measures of functional connectivity.
Limitations
From the present study it is impossible to determine the relationship of stroke to lag, only that they co-occur in individual brains and in a common spatial distribution. The following limitations are noted.
Computation of hemodynamic lag undoubtedly includes measurement error. In particular, Figure 2(b) shows regions that lead the global gray matter signal by
>2 s. This observation has been previously reported.9 However, we assign no particular pathological signifi-cance to this phenomenon. Conversely, lag is considerably more prevalent in the stroke group than controls, lawfully follows vascular distributions, and correlates with clinical deficits. All of these lines of evidence suggest that regional lags indicate hemodynamic compromise.
Lastly, it is possible that the correlation between hemodynamic lag and hypoperfusion is inflated by the pulsed arterial spin labeling method. In PASL, an exci-tation pulse labels arterial blood in the carotid artery and then tissue saturation is measured after a delay (bolus arrival time). We used a bolus arrival time of 1100 ms. If areas of lag show elongated arterial arrival time, then the perfusion measurement may be occurring prior to the signal peak in those areas and thus appear artificially lowered.36,59 This phenomenon has been reported in stroke patients60 and multi-delay ASL sequences have been developed to measure and correct it.61
Conclusion
Our results suggest that hemodynamic lag can be mea-sured non-invasively using R-fMRI, occurs frequently following stroke, and considerably disrupts measurement of functional connectivity. FC–behavior relationships
remain even when subjects showing lag have been removed from analyses. Resting state lag only provides a glimpse into the disruption that has occurred at a cel-lular and microvascular level. This work raises important questions regarding the mechanisms and physiological implications of hemodynamic lag that will require further work and better experimental models.
Funding
The author(s) disclosed receipt of the following financial support for the research, authorship, and/or publication of this article:This study was supported by the National Institute of Child Health and Human Development Health award (5R01HD061117 to MC), the National Institute of Neurologic Disorders and Stroke (P30 NS048056 to AZS), and the National Institute of Health Medical Scientist training award and the American Heart Association Predoctoral Fellowship Award (5T32GM007200-39 and 14PRE19610010 to JSS).
Acknowledgment
Additional thanks to Lawrence Snyder, Anish Mitra, Tomer Livne, Adam Bauer, Beau Ances and Colin Derdeyn for con-ceptual guidance, to Nick Metcalf and Antonello Baldassarre for data processing, and to Sarah Krall and Tomer Livne for manuscript revision.
Declaration of conflicting interests
The author(s) declared no potential conflicts of interest with respect to the research, authorship, and/or publication of this article.
Authors’ contributions
LR oversaw acquisition of imaging and neuropsychological data. LR, JS, and AS processed and analyzed data. JS created and debugged the algorithm. JS, AS, LR, GS and MC parti-cipated in conceiving the study design, interpreting results, and writing and revising the manuscript.
Supplementary material
Supplementary material for this paper can be found at http:// jcbfm.sagepub.com/content/by/supplemental-data
Hemodynamic lag analysis code
A Matlab-based software package for hemodynamic lag analyses, such as those used in this article, can be found at http://www.nil.wustl.edu/labs/corbetta/ resources/
References
1. Corbetta M. Functional connectivity and neurological recovery.Dev Psychobiol2012; 54: 239–253.
2. Grefkes C and Fink GR. Connectivity-based approaches in stroke and recovery of function.Lancet Neurol2014; 13: 206–216.
3. D’Esposito M, Deouell LY and Gazzaley A. Alterations in the BOLD fMRI signal with ageing and disease: a challenge for neuroimaging. Nat Rev Neurosci 2003; 4: 863–872.
4. Pineiro R, Pendlebury S, Johansen-Berg H, et al. Altered hemodynamic responses in patients after subcortical stroke measured by functional MRI. Stroke 2002; 33: 103–109.
5. Salinet ASM, Haunton VJ, Panerai RB, et al. A system-atic review of cerebral hemodynamic responses to neural activation following stroke. J Neurol 2013; 260: 2715–2721.
6. Carusone LM, Srinivasan J, Gitelman DR, et al. Hemodynamic response changes in cerebrovascular dis-ease: implications for functional MR imaging. Am J Neuroradiol2002; 23: 1222–1228.
7. Bonakdarpour B, Parrish TB and Thompson CK. Hemodynamic response function in patients with stroke-induced aphasia: Implications for fMRI data ana-lysis.NeuroImage2007; 36: 322–331.
8. Amemiya S, Kunimatsu A, Saito N, et al. Impaired hemodynamic response in the ischemic brain assessed with BOLD fMRI.NeuroImage2012; 61: 579–590. 9. Amemiya S, Kunimatsu A, Saito N, et al. Cerebral
hemo-dynamic impairment: Assessment with resting-state func-tional MR imaging.Radiology2013; 130982.
10. Lv Y, Margulies DS, Cameron Craddock R, et al. Identifying the perfusion deficit in acute stroke with rest-ing-state functional magnetic resonance imaging. Ann Neurol2013; 73: 136–140.
11. Longstreth WT, Manolio TA, Arnold A, et al. Clinical correlates of white matter findings on cranial magnetic resonance imaging of 3301 elderly people the cardiovas-cular health study.Stroke1996; 27: 1274–1282.
12. Corbetta M, Ramsey L, Callejas A, et al. Common behavioral clusters and subcortical anatomy in stroke. Neuron2015; 85: 927–941.
13. Wolf TJ, Baum C and Connor LT. Changing face of stroke: Implications for occupational therapy practice. Am J Occup Ther Off Publ Am Occup Ther Assoc2009; 63: 621–625.
14. Baldassarre A, Ramsey L, Hacker CL, et al. Large-scale changes in network interactions as a physiological signa-ture of spatial neglect.Brain 2014; awu297.
15. Rowland DJ, Garbow JR, Laforest R, et al. Registration of [18F]FDG microPET and small-animal MRI. Nucl Med Biol2005; 32: 567–572.
16. Arbela´ez AM, Su Y, Thomas JB, et al. Comparison of regional cerebral blood flow responses to hypoglycemia using pulsed arterial spin labeling and positron emission tomography.PLoS ONE2013; 8: e60085.
17. Grant EG, Benson CB, Moneta GL, et al. Carotid artery stenosis: Gray-scale and Doppler US diagnosis—Society of radiologists in ultrasound consensus conference. Radiology2003; 229: 340–346.
18. Brott T, Adams HP, Olinger CP, et al. Measurements of acute cerebral infarction: A clinical examination scale. Stroke1989; 20: 864–870.
19. Hacker CD, Laumann TO, Szrama NP, et al. Resting-state network estimation in individual subjects2013.
20. Fischl B. FreeSurfer.NeuroImage2012; 62: 774–781. 21. Power JD, Barnes KA, Snyder AZ, et al. Spurious but
systematic correlations in functional connectivity MRI networks arise from subject motion. NeuroImage 2012; 59: 2142–2154.
22. Mitra A, Snyder AZ, Hacker CD, et al. Lag structure in resting-state fMRI.J Neurophysiol2014.
23. Siegel JS, Snyder AZ, Metcalf NV, et al. The circuitry of abulia: Insights from functional connectivity MRI. NeuroImage Clin2014; 6: 320–326.
24. Adams HP, Bendixen BH, Kappelle LJ, et al. Classification of subtype of acute ischemic stroke. Definitions for use in a multicenter clinical trial. TOAST. Trial of Org 10172 in acute stroke treatment. Stroke1993; 24: 35–41.
25. Carter AR, Astafiev SV, Lang CE, et al. Resting inter-hemispheric functional magnetic resonance imaging con-nectivity predicts performance after stroke. Ann Neurol 2010; 67: 365–375.
26. Bauer AQ, Kraft AW, Wright PW, et al. Optical imaging of disrupted functional connectivity following ischemic stroke in mice. NeuroImage2014; DOI: 10.1016/ j.neuroimage.2014.05.051.
27. Christen T, Jahanian H, Ni WW, et al. Noncontrast map-ping of arterial delay and functional connectivity using resting-state functional MRI: A study in Moyamoya patients: Maps of Arterial Delay Using BOLD Signal. J Magn Reson Imaging2014; n/a–n/a.
28. Attwell D, Buchan AM, Charpak S, et al. Glial and neur-onal control of brain blood flow. Nature 2010; 468: 232–243.
29. Petzold GC and Murthy VN. Role of astrocytes in neu-rovascular coupling.Neuron2011; 71: 782–797.
30. Hall CN, Reynell C, Gesslein B, et al. Capillary pericytes regulate cerebral blood flow in health and disease.Nature 2014; 508: 55–60.
31. Hauck EF, Apostel S, Hoffmann JF, et al. Capillary flow and diameter changes during reperfusion after global cerebral ischemia studied by intravital video microscopy. J Cereb Blood Flow Metab2004; 24: 383–391.
32. Yemisci M, Gursoy-Ozdemir Y, Vural A, et al. Pericyte contraction induced by oxidative-nitrative stress impairs capillary reflow despite successful opening of an occluded cerebral artery.Nat Med2009; 15: 1031–1037.
33. Schummers J, Yu H and Sur M. Tuned responses of astrocytes and their influence on hemodynamic signals in the visual cortex.Science2008; 320: 1638–1643. 34. Hathout GM, Gopi RK, Bandettini P, et al. The lag of
cerebral hemodynamics with rapidly alternating periodic stimulation: modeling for functional MRI.Magn Reson Imag1999; 17: 9–20.
35. Shih AY, Friedman B, Drew PJ, et al. Active dilation of penetrating arterioles restores red blood cell flux to pen-umbral neocortex after focal stroke.J Cereb Blood Flow Metab2009; 29: 738–751.
36. MacIntosh BJ, Lindsay AC, Kylintireas I, et al. Multiple inflow pulsed arterial spin-labeling reveals delays in the arterial arrival time in minor stroke and transient ische-mic attack.Am J Neuroradiol2010; 31: 1892–1894.
37. Powers WJ, Fox PT and Raichle ME. The effect of car-otid artery disease on the cerebrovascular response to physiologic stimulation.Neurology1988; 38: 1475–1475. 38. de Haan B, Rorden C and Karnath H-O. Abnormal
peri-lesional BOLD signal is not correlated with stroke patients’ behavior.Front Hum Neurosci2013; 7: 669. 39. Rossini PM, Altamura C, Ferretti A, et al. Does
cerebro-vascular disease affect the coupling between neuronal activity and local haemodynamics? Brain 2004; 127: 99–110.
40. Rosner G, Graf R, Kataoka K, et al. Selective functional vulnerability of cortical neurons following transient MCA-occlusion in the cat.Stroke1986; 17: 76–82. 41. Schroeter ML, Cutini S, Wahl MM, et al. Neurovascular
coupling is impaired in cerebral microangiopathy—An event-related Stroop study.NeuroImage2007; 34: 26–34. 42. Hillis AE, Newhart M, Heidler J, et al. Anatomy of spa-tial attention: Insights from perfusion imaging and hemi-spatial neglect in acute stroke. J Neurosci 2005; 25: 3161–3167.
43. Lee J-M, Vo KD, An H, et al. Magnetic resonance cere-bral metabolic rate of oxygen utilization in hyperacute stroke patients.Ann Neurol2003; 53: 227–232.
44. Olivot J-M, Mlynash M, Thijs VN, et al. Optimal Tmax threshold for predicting penumbral tissue in acute.Stroke 2009; 40: 469–475.
45. Derdeyn CP. Mechanisms of ischemic stroke secondary to large artery atherosclerotic disease.Neuroimaging Clin N Am2007; 17: 303–311.
46. He BJ, Snyder AZ, Vincent JL, et al. Breakdown of func-tional connectivity in frontoparietal networks underlies behavioral deficits in spatial neglect. Neuron 2007; 53: 905–918.
47. Carter AR, Patel KR, Astafiev SV, et al. Upstream dys-function of somatomotor dys-functional connectivity after corticospinal damage in stroke. Neurorehabil Neural Repair2012; 26: 7–19.
48. Carter AR, Shulman GL and Corbetta M. Why use a connectivity-based approach to study stroke and recovery of function?NeuroImage2012; 62: 2271–2280.
49. van Meer MP, van der Marel K, Wang K, et al. Recovery of sensorimotor function after experimental stroke cor-relates with restoration of resting-state interhemispheric functional connectivity.J Neurosci2010; 30: 3964–3972. 50. van Meer MP, van der Marel K, Otte WM, et al.
Correspondence between altered functional and
structural connectivity in the contralesional sensorimotor cortex after unilateral stroke in rats: A combined resting-state functional MRI and manganese-enhanced MRI study.J Cereb Blood Flow Metab2010; 30: 1707–1711. 51. Wang L, Yu C, Chen H, et al. Dynamic functional
reorganization of the motor execution network after stroke.Brain2010; 133: 1224–1238.
52. Grefkes C and Fink GR. Reorganization of cerebral net-works after stroke: New insights from neuroimaging with connectivity approaches.Brain2011; 134: 1264–1276. 53. Park C, Chang WH, Ohn SH, et al. Longitudinal changes
of resting-state functional connectivity during motor recovery after.Stroke2011; 42: 1357–1362.
54. Jiang L, Xu H and Yu C. Brain connectivity plasticity in the motor network after ischemic stroke. Neural Plast2013; DOI: 10.1155/2013/924192.
55. Ovadia-Caro S, Villringer K, Fiebach J, et al. Longitudinal effects of lesions on functional networks after stroke. J Cereb Blood Flow Metab 2013; 33: 1279–1285.
56. Va´rkuti B, Guan C, Pan Y, et al. Resting state changes in functional connectivity correlate with movement recovery for BCI and robot-assisted upper-extremity training after stroke.Neurorehabil Neural Repair2013; 27: 53–62. 57. Ding X, Li C-Y, Wang Q-S, et al. Patterns in
default-mode network connectivity for determining outcomes in cognitive function in acute stroke patients. Neuroscience 2014; 277: 637–646.
58. Zhang J, Meng L, Qin W, et al. Structural damage and functional reorganization in ipsilesional M1 in well-recovered patients with subcortical. Stroke 2014; 45: 788–793.
59. Donahue MJ, Strother MK and Hendrikse J. Novel MRI approaches for assessing cerebral hemodynamics in ische-mic cerebrovascular disease.Stroke2012; 43: 903–915. 60. Kimura H, Kado H, Koshimoto Y, et al. Multislice
con-tinuous arterial spin-labeled perfusion MRI in patients with chronic occlusive cerebrovascular disease: A correla-tive study with CO2 PET validation.J Magn Reson Imag 2005; 22: 189–198.
61. Wang DJJ, Alger JR, Qiao JX, et al. Multi-delay multi-parametric arterial spin-labeled perfusion MRI in acute ischemic stroke – Comparison with dynamic susceptibil-ity contrast enhanced perfusion imaging. NeuroImage Clin2013; 3: 1–7.