arXiv:0712.1150v1 [astro-ph] 7 Dec 2007
The nature of the ghost cavity in the NGC 741 group
Nazirah N. Jetha
1,2⋆, Martin J. Hardcastle
3, Arif Babul
4, Ewan O’Sullivan
5,
Trevor J. Ponman
2, Somak Raychaudhury
2, Jan Vrtilek
51Laboratoire AIM, CEA/DSM - CNRS - Universit´e Paris Diderot, DAPNIA/Service d’Astrophysique, Bˆat. 709, CEA-Saclay, F-91191 Gif-sur-Yvette C´edex, France 2School of Physics and Astronomy, University of Birmingham, Edgbaston, Birmingham B15 2TT
3School of Physics, Astronomy and Mathematics, University of Hertfordshire, College Lane, Hatfield, Hertfordshire AL10 9AB 4Department of Physics and Astronomy, University of Victoria, Victoria, BC V8P 5C2, Canada
5Harvard-Smithsonian Center for Astrophysics, 60 Garden Street, Cambridge, MA 02138
ABSTRACT
We discuss the effects of energy injection into the intra-group medium of the group of galaxies associated with NGC 741. The X-ray emission reveals a large bubble, which in the absence of a currently bright central radio source, may have been inflated by a previous cycle of nuclear activity . If the bubble is filled with a light, relativistic fluid we calculate that in expanding, it has done more than sufficient work to counteract the energy lost from the intra-group medium via radiative cooling; the bubble can provide this energy as it expands and rises. Using upper limits on the flux density of the plasma filling the bubble at 330 MHz and 1.4 GHz, we derive constraints on its electron energy distribution and magnetic field strength. We show that the data require the high-energy cut-off of the electron spectrum to be very low compared to the cut-offs seen in more typical radio sources if the fluid filling the bubble is a conventional relativistic plasma. This suggests that the fluid filling the bubble may not have evolved by expansion or synchrotron losses consistent with a dead radio source, leaving a puzzle as to what the origin of the bubble may be.
Key words: X-rays:galaxies:clusters - intergalactic medium - galaxies:active - galax-ies:clusters:individual(NGC 741)
1 INTRODUCTION
It is well known that there is a lack of very cool gas in the cen-tres of galaxy groups and clusters (e.g. Peterson et al. 2001 and Sakelliou et al. 2002), even in systems where the cooling time is significantly shorter than the Hubble time. Why this should be so remains a mystery, and suggests that there must be some mecha-nism to prevent catastrophic cooling.
If a bubble inflated by an active galactic nucleus (AGN) is over-pressured with respect to the inter-galactic medium (IGM), then it will expand, doing work on the IGM (see for exam-ple Nusser et al. 2006). Depending on how significantly the bub-ble is overpressured, the expansion may be trans or super-sonic, driving shocks into the IGM (e.g. in Centaurus A Kraft et al. 2003), or the expansion may be more subtle, doing gentleP dV
work on the gas as the bubble expands (e.g. Begelman 2001 and Ruszkowski & Begelman 2002). Once the bubble has expanded and reached pressure equilibrium with the external medium, it will begin to rise buoyantly. As it rises, it may distort (e.g. Churazov et al. 2001). The bubble will also do further work on the IGM whilst it rises. Such bubbles could remain intact until long after the AGN has switched off, with the spectrum of the bubble
⋆ E-mail:[email protected]
plasma steepening so that the emission at higher radio frequencies drops to below detectable rates.
Observationally there is much evidence for this picture. A number of clusters show radio signatures of jets terminating in lobes that, in turn, are coincident, in projection with X-ray sur-face brightness depressions that, on occasion are bounded by weak shocks (c.f. (e.g. Bˆırzan et al. 2004) and references therein). The simplest explanation is that the inflating radio bubbles are displac-ing the X-ray emittdisplac-ing plasma.
There are, however, cavities with no detectable radio emis-sion (see for example Abell 1795, Ettori et al. 2002; Abell 2597, Clarke et al. 2005; HCG 62, Bˆırzan et al. 2004). These so-called ‘ghost cavities’ are typically assumed to be features created in the more distant past and whose radio emission has faded over time. This interpretation finds some support in the fact that in any given cluster, the ghost cavities are typically found further away from the cluster centre than the cavities with detectable radio emission (c.f. Bˆırzan et al. 2004).
Whether or not a cavity is associated with radio emission, of course depends critically on the nature of the fluid that fills the bub-bles. If the bubbles are inflated by AGN, then it would be likely that the fluid is a relativistic plasma. However, the lack of associated ra-dio emission in ghost cavity systems implies that the plasma must be in such a state that any emission is below detectable levels. The
lack of observed radio emission places strong constraints on the nature of the radiating particles and the field.
In this paper we investigate a centrally located ghost cavity in the galaxy group associated with NGC 741. This is an optically identified group (Zabludoff & Mulchaey 1998), consisting of ap-proximately 48 galaxies within 1 Mpc, with a mean redshift of 0.019 and a velocity dispersionσ= 458±66 km s−1. The BGG,
identified as NGC 741, and its companion galaxy NGC 742 are sep-arated by 45 arcsec (17 kpc), with NGC 742 lying almost exactly to the E of NGC 741, together with a much smaller third com-panion approximately 9 arcsec (3.4 kpc) to the NE of NGC 741 (Bonfanti et al. 1995). Mulchaey & Zabludoff (1998) first reported a significant extended X-ray halo in this group, extending to 19.2 arcmin from the centre of NGC 741 (approximately 440 kpc in our adopted cosmology), with a luminosity of5.3×1041erg s−1
(again in our adopted cosmology).
The organization of the rest of the paper is as follows. We present the X-ray data and our analysis in Section 2. In Section 3 we present the radio data and also comment on the dynamical state of the system. In Section 4 we discuss the energetics involved and in Section 5 we place limits on the nature of the fluid filling the cavity. Our conclusions are given in Section 6. Throughout this pa-per, we useH0 = 70 km s−1Mpc−1, with aΛCDM cosmology.
NGC 741 is at a redshift of 0.019, and 1 arcsec=0.38 kpc. All errors are quoted at the 1-σlevel.
2 X-RAY DATA
The Chandra data of NGC 741 (ObsID 2223) were obtained from the archive, and processed as part of the study of Jetha et al. (2007); the data were reprocessed using CIAO 3.4 andCALDB3.3.0 fol-lowing the CIAO threads online to apply new calibration products and a new event file was created. The data were cleaned using a 3σ
clipping algorithm to remove times of high background, leaving a 30.3 ks exposure.
In addition, we obtained and reduced the XMM-Newton data (sequence number 0153030701) for the source (originally pub-lished in Mahdavi et al. 2005), using SAS version 7.0.0. The orig-inal exposure times were 8.7 ks (MOS) and 7.0 ks (PN). The data were filtered for flares following the method described in Pratt et al. (2007), and vignetting corrections were applied to the data follow-ing the procedure described in Arnaud et al. (2001). After clean-ing, we were left with good time intervals of 5.8 ks (MOS1), 5.9 ks (MOS2) and 3.8 ks (PN).
2.1 Spatial analysis
We smoothed the exposure corrected and binned Chandra data in the 0.5–5.0 keV energy range using the taskCSMOOTHwith a min-imum smoothing signal to noise ratio of3σ(see Fig. 1 left panel). This process revealed an elliptical cavity to the west of the host galaxy (see also Vrtilek et al (in prep)). Increasing the minimum smoothing significance to 4σresulted in a somewhat smaller cav-ity. We use an elliptical region to approximate the boundaries of the cavity seen with 3σsmoothing; this region has semi-major axis,
ab ∼19 kpc and semi-minor axis,bb ∼14.5 kpc, (marked by the
elliptical region in Fig 1). We assume a prolate ellipsoid so that the third axiscb=bb.
To check that this cavity is real and not just an artefact of adap-tive smoothing we firstly created an exposure corrected image in the 0.5–5.0 keV energy range as above and smoothed it with a fixed
Gaussian kernel of FWHM 5 arcsec. We then used the Sherpa fit-ting program to fit a single 2-Dβ-model to the Chandra data to model the large-scale emission. This single-component fit is in-tended to model the large-scale group emission, allowing it to be subtracted from the image and revealing structures in the core. As a single-component model can only approximate the true surface brightness distribution, we do not use this model to derive physi-cal parameters. The model centre is slightly off-centre due to the structure in the centre of the group. We then created an image of the residuals of the fit, which is shown in Fig 1 (right panel). The cavity can be clearly seen, and we overlay the same ellipse as in the left panel to guide the eye. We further created a surface bright-ness profile in the 0.5–5.0 keV energy range which was centred on NGC 741, and covered, in azimuthal bins, the region occupied by the cavity, together with a comparison surface brightness profile in the same energy range for the entire system excluding the region we used to extract a profile of the cavity. The opening angles of the wedges used for the two profiles were 80 and 280 degrees respec-tively, and a local background was used for background subtrac-tion. The resulting profiles are shown in Fig. 2 (left panel) overlaid on each other. There is a clear 3σsurface brightness drop which begins at approximately 10 kpc from NGC 741 and continues to approximately 40 kpc, implying that that the cavity seen in the im-ages is real. At the centre of the cavity, the ratio,RSBof the surface
brightness of the cavity, to that of the undisturbed gas, is approxi-mately(0.4±0.1). Compared to other systems, where the surface brightness contrasts are of the order of 20–30% of the surrounding surface brightness (Bˆırzan et al. 2004 and Rafferty et al. 2006), the bubbles here are of a similar surface brightness contrast.
For completeness, we generated a surface brightness profile in the 0.3–2.0 keV energy range from the XMM-Newton data (shown in Fig 2 right panel). We use this profile to provide a model for the surface brightness for use in Section 2.3. We used the
Newton rather than the Chandra data for this since the XMM-Newton data extends out to larger radii, providing a better model
for the large scale emission. The profile was fitted by aβ-model withβ = 0.428±0.005and core radius, (rc = 2.1±0.2) kpc.
We also smoothed the XMM-Newton data with a Gaussian beam of FWHM 6 arcsec (shown in Fig. 3) to see if the cavity was detectable in the data. Whilst the cavity is not visible in the XMM-Newton data due to PSF blurring and the shorter exposure time from the deficit seen in the Chandra data, we would expect the surface brightness as viewed by XMM-Newton to drop from 0.35counts arcsec−2to
0.14counts arcsec−2. In the XMM-Newton data, we observe a
sur-face brightness of0.2±0.5 counts arcsec−2in the region defined
by the cavity, consistent at the 1-σlevel with the cavity seen in the
Chandra data.
2.2 Spectral analysis
From the XMM-Newton data, we extracted a global spectrum from a source region of 8.8 arcmin centred on the BGG. The source re-gion was chosen as we detect emission at 3-σsignificance out to this radius. The X-ray background is subtracted using the back-ground files of Read & Ponman (2003) and we use the double subtraction method of Arnaud et al. (2002) to take into account both the X-ray and the particle backgrounds correctly. The spec-trum was fitted with a simple absorbed MEKAL model, the de-tails of which are given in Table 1. We find a temperature of
1.7±0.1keV, with metal abundances fixed to0.3 Z⊙. The fit has
χ2 = 147for 115 degrees of freedom. We find a luminosity for
the group of6.6+0.4
−0.9 ×1041erg s
DECL INA TIO N (J2000 ) RIGHT ASCENSION (J2000) 01 56 30 25 20 15 10 05 40 39 38 37 36 35 34
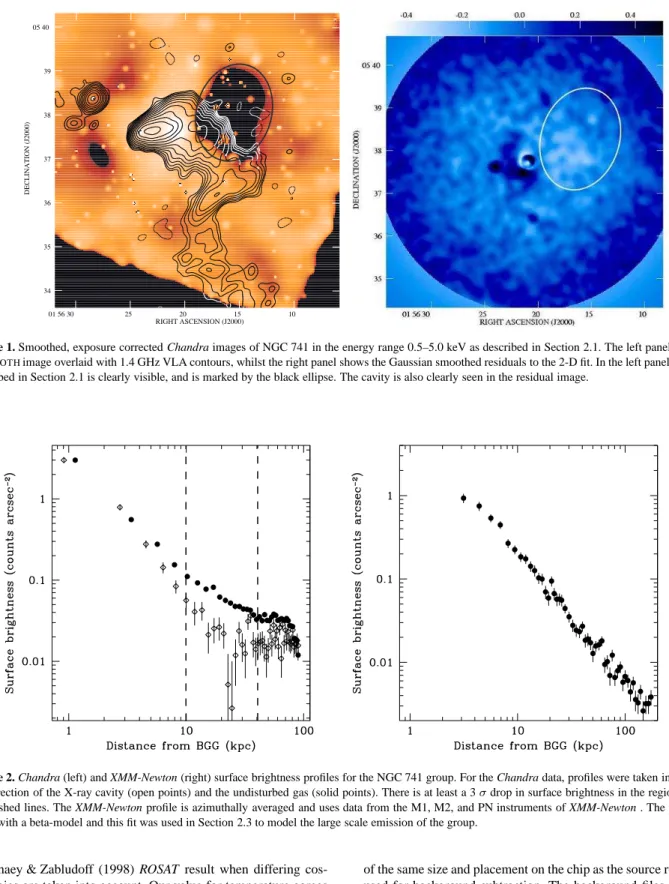
Figure 1. Smoothed, exposure corrected Chandra images of NGC 741 in the energy range 0.5–5.0 keV as described in Section 2.1. The left panel shows the
CSMOOTHimage overlaid with 1.4 GHz VLA contours, whilst the right panel shows the Gaussian smoothed residuals to the 2-D fit. In the left panel, the cavity described in Section 2.1 is clearly visible, and is marked by the black ellipse. The cavity is also clearly seen in the residual image.
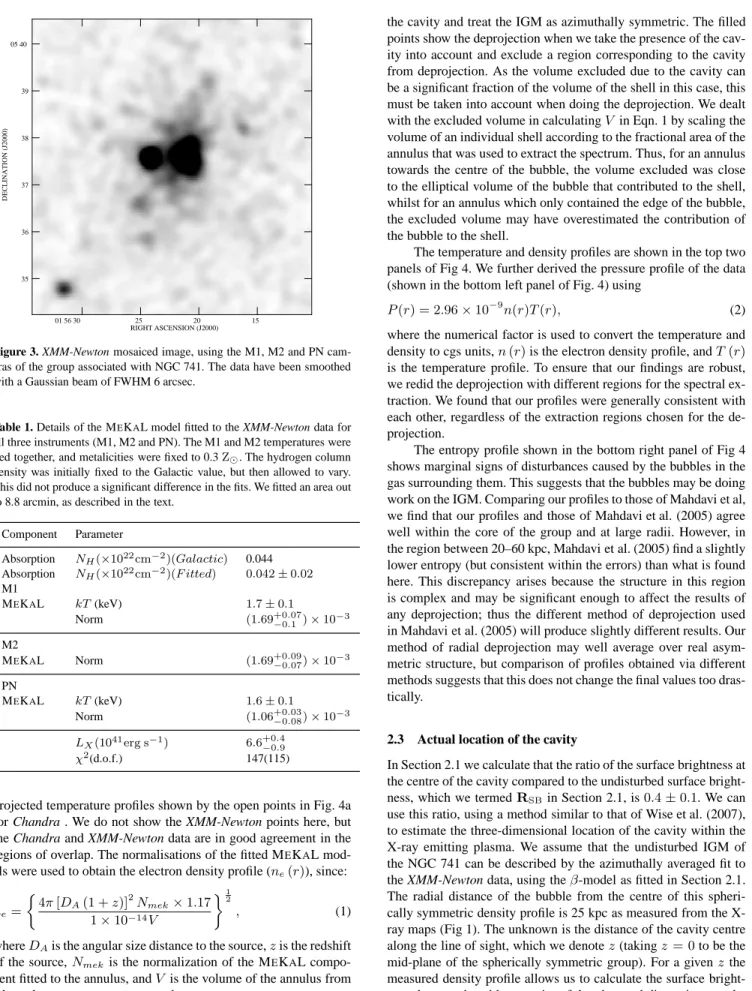
Figure 2. Chandra (left) and XMM-Newton (right) surface brightness profiles for the NGC 741 group. For the Chandra data, profiles were taken in wedges in
the direction of the X-ray cavity (open points) and the undisturbed gas (solid points). There is at least a 3σdrop in surface brightness in the region between the dashed lines. The XMM-Newton profile is azimuthally averaged and uses data from the M1, M2, and PN instruments of XMM-Newton . The profile was fitted with a beta-model and this fit was used in Section 2.3 to model the large scale emission of the group.
Mulchaey & Zabludoff (1998) ROSAT result when differing cos-mologies are taken into account. Our value for temperature agrees well with that of Mahdavi et al. (2005), who use the same
XMM-Newton data.
We next generated azimuthally averaged temperature profiles from both the Chandra and XMM-Newton data. The profiles were again centred on the BGG, and an ellipse defining the region con-taining the bubble was excluded from the Chandra data as shown in fig. 1. For the Chandra data, annular regions were defined out to 70 kpc (corresponding to 3.4 arcmin), and a blank sky background
of the same size and placement on the chip as the source region was used for background subtraction. The background files were pro-cessed in the same way as the data (following the instructions in the
CIAO threads) and normalized such that both background files and
the data had the same flux in the 8–10 keV energy band. Similarly, for the XMM-Newton data, annuli were defined out to 8.8 arcmin and background regions as described earlier were used. We then followed the method described in Jetha et al. (2005) for the
Chan-dra and XMM-Newton data separately, fitting an absorbed MEKAL
de-DECLINATION (J2000) RIGHT ASCENSION (J2000) 01 56 30 25 20 15 05 40 39 38 37 36 35
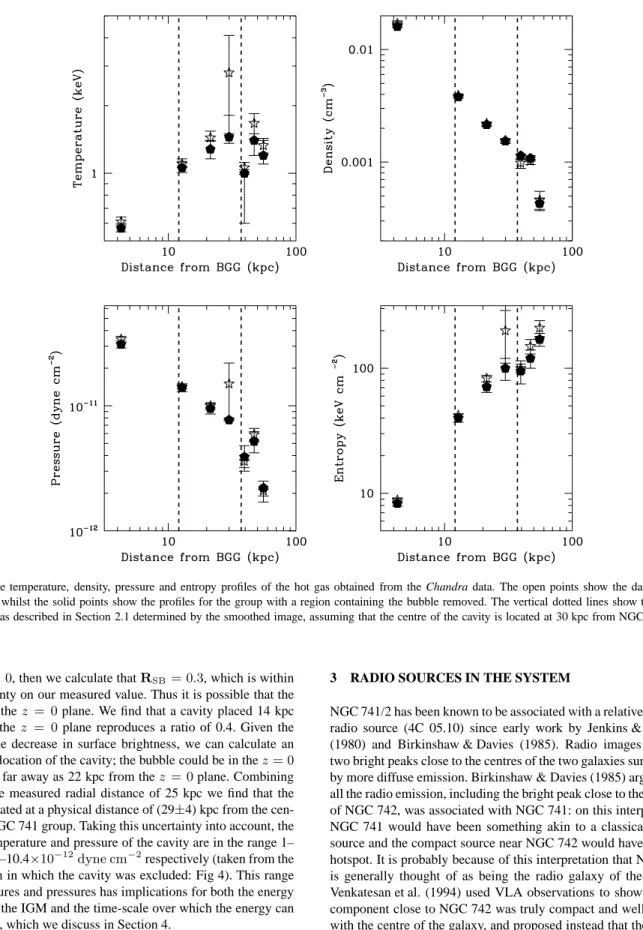
Figure 3. XMM-Newton mosaiced image, using the M1, M2 and PN
cam-eras of the group associated with NGC 741. The data have been smoothed with a Gaussian beam of FWHM 6 arcsec.
Table 1. Details of the MEKAL model fitted to the XMM-Newton data for all three instruments (M1, M2 and PN). The M1 and M2 temperatures were tied together, and metalicities were fixed to 0.3Z⊙. The hydrogen column
density was initially fixed to the Galactic value, but then allowed to vary. This did not produce a significant difference in the fits. We fitted an area out to 8.8 arcmin, as described in the text.
Component Parameter Absorption NH(×1022cm−2)(Galactic) 0.044 Absorption NH(×1022cm−2)(F itted) 0.042±0.02 M1 MEKAL kT(keV) 1.7±0.1 Norm (1.69+0−0..071 )×10−3 M2 MEKAL Norm (1.69+0−0..0907)×10−3 PN MEKAL kT(keV) 1.6±0.1 Norm (1.06+0−0..0308)×10−3 LX(1041erg s−1) 6.6+0−0..49 χ2(d.o.f.) 147(115)
projected temperature profiles shown by the open points in Fig. 4a for Chandra . We do not show the XMM-Newton points here, but the Chandra and XMM-Newton data are in good agreement in the regions of overlap. The normalisations of the fitted MEKAL mod-els were used to obtain the electron density profile (ne(r)), since:
ne= 4π[DA(1 +z)]2Nmek×1.17 1×10⁻¹⁴V 12 , (1)
whereDAis the angular size distance to the source,zis the redshift
of the source,Nmekis the normalization of the MEKAL
compo-nent fitted to the annulus, andV is the volume of the annulus from where the spectrum was extracted.
In Fig. 4, we overplot two different deprojections. The open points show the deprojection when we disregard the presence of
the cavity and treat the IGM as azimuthally symmetric. The filled points show the deprojection when we take the presence of the cav-ity into account and exclude a region corresponding to the cavcav-ity from deprojection. As the volume excluded due to the cavity can be a significant fraction of the volume of the shell in this case, this must be taken into account when doing the deprojection. We dealt with the excluded volume in calculatingV in Eqn. 1 by scaling the volume of an individual shell according to the fractional area of the annulus that was used to extract the spectrum. Thus, for an annulus towards the centre of the bubble, the volume excluded was close to the elliptical volume of the bubble that contributed to the shell, whilst for an annulus which only contained the edge of the bubble, the excluded volume may have overestimated the contribution of the bubble to the shell.
The temperature and density profiles are shown in the top two panels of Fig 4. We further derived the pressure profile of the data (shown in the bottom left panel of Fig. 4) using
P(r) = 2.96×10⁻⁹n(r)T(r), (2) where the numerical factor is used to convert the temperature and density to cgs units,n(r)is the electron density profile, andT(r)
is the temperature profile. To ensure that our findings are robust, we redid the deprojection with different regions for the spectral ex-traction. We found that our profiles were generally consistent with each other, regardless of the extraction regions chosen for the de-projection.
The entropy profile shown in the bottom right panel of Fig 4 shows marginal signs of disturbances caused by the bubbles in the gas surrounding them. This suggests that the bubbles may be doing work on the IGM. Comparing our profiles to those of Mahdavi et al, we find that our profiles and those of Mahdavi et al. (2005) agree well within the core of the group and at large radii. However, in the region between 20–60 kpc, Mahdavi et al. (2005) find a slightly lower entropy (but consistent within the errors) than what is found here. This discrepancy arises because the structure in this region is complex and may be significant enough to affect the results of any deprojection; thus the different method of deprojection used in Mahdavi et al. (2005) will produce slightly different results. Our method of radial deprojection may well average over real asym-metric structure, but comparison of profiles obtained via different methods suggests that this does not change the final values too dras-tically.
2.3 Actual location of the cavity
In Section 2.1 we calculate that the ratio of the surface brightness at the centre of the cavity compared to the undisturbed surface bright-ness, which we termedRSBin Section 2.1, is0.4±0.1. We can use this ratio, using a method similar to that of Wise et al. (2007), to estimate the three-dimensional location of the cavity within the X-ray emitting plasma. We assume that the undisturbed IGM of the NGC 741 can be described by the azimuthally averaged fit to the XMM-Newton data, using theβ-model as fitted in Section 2.1. The radial distance of the bubble from the centre of this spheri-cally symmetric density profile is 25 kpc as measured from the X-ray maps (Fig 1). The unknown is the distance of the cavity centre along the line of sight, which we denotez(takingz= 0to be the mid-plane of the spherically symmetric group). For a givenz the measured density profile allows us to calculate the surface bright-ness drop produced by a cavity of the observed dimensions, at the observed radial distance.
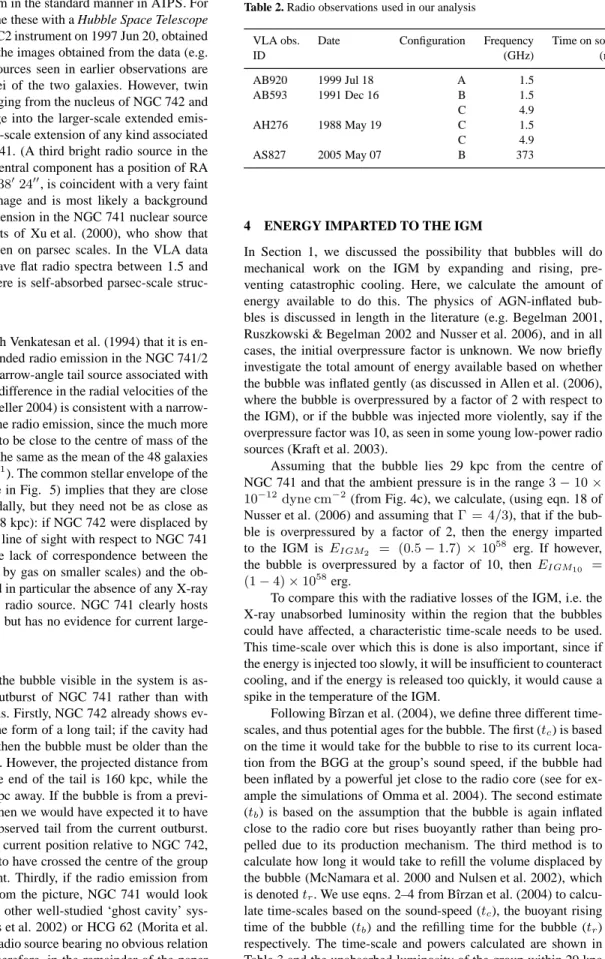
Figure 4. The temperature, density, pressure and entropy profiles of the hot gas obtained from the Chandra data. The open points show the data for the
entire group, whilst the solid points show the profiles for the group with a region containing the bubble removed. The vertical dotted lines show the extent of the cavity as described in Section 2.1 determined by the smoothed image, assuming that the centre of the cavity is located at 30 kpc from NGC 741 (see Section 2.3).
were atz = 0, then we calculate thatRSB= 0.3, which is within
the uncertainty on our measured value. Thus it is possible that the cavity is in thez = 0plane. We find that a cavity placed 14 kpc away from thez = 0plane reproduces a ratio of 0.4. Given the errors on the decrease in surface brightness, we can calculate an error in the location of the cavity; the bubble could be in thez= 0
plane, or as far away as 22 kpc from thez= 0plane. Combining this with the measured radial distance of 25 kpc we find that the cavity is located at a physical distance of (29±4) kpc from the cen-tre of the NGC 741 group. Taking this uncertainty into account, the ambient temperature and pressure of the cavity are in the range 1– 2 keV and 3–10.4×10⁻¹²dyne cm−2
respectively (taken from the deprojection in which the cavity was excluded: Fig 4). This range of temperatures and pressures has implications for both the energy imparted to the IGM and the time-scale over which the energy can be imparted, which we discuss in Section 4.
3 RADIO SOURCES IN THE SYSTEM
NGC 741/2 has been known to be associated with a relatively bright radio source (4C 05.10) since early work by Jenkins & Scheuer (1980) and Birkinshaw & Davies (1985). Radio images showed two bright peaks close to the centres of the two galaxies surrounded by more diffuse emission. Birkinshaw & Davies (1985) argued that all the radio emission, including the bright peak close to the nucleus of NGC 742, was associated with NGC 741: on this interpretation NGC 741 would have been something akin to a classical double source and the compact source near NGC 742 would have been its hotspot. It is probably because of this interpretation that NGC 741 is generally thought of as being the radio galaxy of the system. Venkatesan et al. (1994) used VLA observations to show that the component close to NGC 742 was truly compact and well aligned with the centre of the galaxy, and proposed instead that the diffuse radio emission was a head-tail or narrow-angle tail (NAT) source associated with NGC 742.
To allow us to make the most definite statements possible about the nature of the radio emission, we have acquired multi-frequency VLA observations (listed in Table 2) of the system from
the archive and reduced them in the standard manner in AIPS. For display purposes we combine these with a Hubble Space Telescope images taken with the WFPC2 instrument on 1997 Jun 20, obtained from the public archive. In the images obtained from the data (e.g. Fig. 5), the two compact sources seen in earlier observations are well aligned with the nuclei of the two galaxies. However, twin jets are clearly visible emerging from the nucleus of NGC 742 and bending westwards to merge into the larger-scale extended emis-sion, while there is no small-scale extension of any kind associated with the nucleus of NGC 741. (A third bright radio source in the field, a small triple whose central component has a position of RA 01h56m28.5sDec.+05◦
38′
24′′
, is coincident with a very faint point source in the HST image and is most likely a background quasar.) The lack of any extension in the NGC 741 nuclear source is consistent with the results of Xu et al. (2000), who show that the source is unresolved even on parsec scales. In the VLA data the compact components have flat radio spectra between 1.5 and 4.9 GHz, indicating that there is self-absorbed parsec-scale struc-ture in both.
We therefore agree with Venkatesan et al. (1994) that it is en-tirely plausible that the extended radio emission in the NGC 741/2 system comes only from a narrow-angle tail source associated with NGC 742. The 400 km s−1difference in the radial velocities of the
two galaxies (Mahdavi & Geller 2004) is consistent with a narrow-angle tail interpretation of the radio emission, since the much more massive NGC 741 is likely to be close to the centre of mass of the group (its radial velocity is the same as the mean of the 48 galaxies within 1 Mpc – 5570km s−1
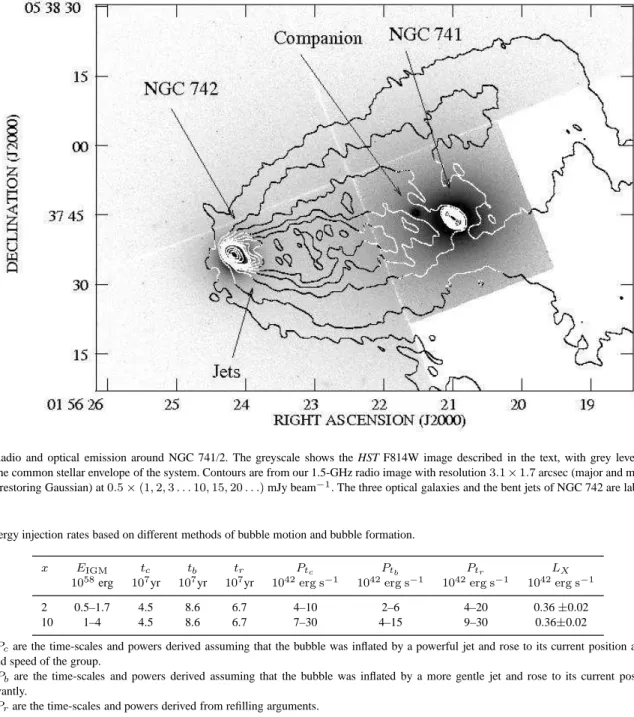
). The common stellar envelope of the two systems (clearly visible in Fig. 5) implies that they are close enough to be interacting tidally, but they need not be as close as they appear in projection (18 kpc): if NGC 742 were displaced by a few tens of kpc along the line of sight with respect to NGC 741 it would help to explain the lack of correspondence between the X-ray emission (dominated by gas on smaller scales) and the ob-servable radio emission, and in particular the absence of any X-ray cavities associated with the radio source. NGC 741 clearly hosts some form of active galaxy, but has no evidence for current large-scale jets.
We further argue that the bubble visible in the system is as-sociated with a previous outburst of NGC 741 rather than with NGC 742 for several reasons. Firstly, NGC 742 already shows ev-idence of old emission in the form of a long tail; if the cavity had been caused by NGC 742, then the bubble must be older than the current large scale emission. However, the projected distance from the core of NGC 742 to the end of the tail is 160 kpc, while the bubble is located only 45 kpc away. If the bubble is from a previ-ous outburst of NGC 742, then we would have expected it to have travelled further than the observed tail from the current outburst. Secondly, to have got to its current position relative to NGC 742, the bubble would have had to have crossed the centre of the group against the pressure gradient. Thirdly, if the radio emission from NGC 742 were removed from the picture, NGC 741 would look much more similar to some other well-studied ‘ghost cavity’ sys-tems like NGC 4636 (Jones et al. 2002) or HCG 62 (Morita et al. 2006), with a weak central radio source bearing no obvious relation to the observable cavity. Therefore, in the remainder of the paper we adopt the hypothesis that the bubble was caused by a previous outflow of NGC 741 and that the location of the large scale emis-sion of NGC 742 is entirely coincidental.
Table 2. Radio observations used in our analysis
VLA obs. Date Configuration Frequency Time on source
ID (GHz) (min) AB920 1999 Jul 18 A 1.5 50 AB593 1991 Dec 16 B 1.5 10 C 4.9 26 AH276 1988 May 19 C 1.5 30 C 4.9 76 AS827 2005 May 07 B 373
4 ENERGY IMPARTED TO THE IGM
In Section 1, we discussed the possibility that bubbles will do mechanical work on the IGM by expanding and rising, pre-venting catastrophic cooling. Here, we calculate the amount of energy available to do this. The physics of AGN-inflated bub-bles is discussed in length in the literature (e.g. Begelman 2001, Ruszkowski & Begelman 2002 and Nusser et al. 2006), and in all cases, the initial overpressure factor is unknown. We now briefly investigate the total amount of energy available based on whether the bubble was inflated gently (as discussed in Allen et al. (2006), where the bubble is overpressured by a factor of 2 with respect to the IGM), or if the bubble was injected more violently, say if the overpressure factor was 10, as seen in some young low-power radio sources (Kraft et al. 2003).
Assuming that the bubble lies 29 kpc from the centre of NGC 741 and that the ambient pressure is in the range3−10× 10−12dyne cm−2(from Fig. 4c), we calculate, (using eqn. 18 of
Nusser et al. (2006) and assuming thatΓ = 4/3), that if the bub-ble is overpressured by a factor of 2, then the energy imparted to the IGM isEIGM2 = (0.5−1.7)×10
58 erg. If however,
the bubble is overpressured by a factor of 10, thenEIGM10 =
(1−4)×1058erg.
To compare this with the radiative losses of the IGM, i.e. the X-ray unabsorbed luminosity within the region that the bubbles could have affected, a characteristic time-scale needs to be used. This time-scale over which this is done is also important, since if the energy is injected too slowly, it will be insufficient to counteract cooling, and if the energy is released too quickly, it would cause a spike in the temperature of the IGM.
Following Bˆırzan et al. (2004), we define three different time-scales, and thus potential ages for the bubble. The first (tc) is based
on the time it would take for the bubble to rise to its current loca-tion from the BGG at the group’s sound speed, if the bubble had been inflated by a powerful jet close to the radio core (see for ex-ample the simulations of Omma et al. 2004). The second estimate (tb) is based on the assumption that the bubble is again inflated
close to the radio core but rises buoyantly rather than being pro-pelled due to its production mechanism. The third method is to calculate how long it would take to refill the volume displaced by the bubble (McNamara et al. 2000 and Nulsen et al. 2002), which is denotedtr. We use eqns. 2–4 from Bˆırzan et al. (2004) to
calcu-late time-scales based on the sound-speed (tc), the buoyant rising
time of the bubble (tb) and the refilling time for the bubble (tr)
respectively. The time-scale and powers calculated are shown in Table 3 and the unabsorbed luminosity of the group within 29 kpc is 0.36±0.02×1042erg s−1. Thus, it is clear that over the lifetime
of the bubble, and for the foreseeable future, energy input from the bubble will dominate over radiative losses (by 1–2 orders of
magni-Figure 5. Radio and optical emission around NGC 741/2. The greyscale shows the HST F814W image described in the text, with grey levels chosen to
emphasise the common stellar envelope of the system. Contours are from our 1.5-GHz radio image with resolution3.1×1.7arcsec (major and minor FWHM of elliptical restoring Gaussian) at0.5×(1,2,3. . .10,15,20. . .)mJy beam−1. The three optical galaxies and the bent jets of NGC 742 are labeled.
Table 3. Energy injection rates based on different methods of bubble motion and bubble formation.
x EIGM tc tb tr Ptc Ptb Ptr LX
1058erg 107yr 107yr 107yr 1042erg s−1 1042erg s−1 1042erg s−1 1042erg s−1
2 0.5–1.7 4.5 8.6 6.7 4–10 2–6 4–20 0.36±0.02
10 1–4 4.5 8.6 6.7 7–30 4–15 9–30 0.36±0.02
tc,Pcare the time-scales and powers derived assuming that the bubble was inflated by a powerful jet and rose to its current position at the
sound speed of the group.
tb,Pbare the time-scales and powers derived assuming that the bubble was inflated by a more gentle jet and rose to its current position
buoyantly.
tr,Prare the time-scales and powers derived from refilling arguments.
tude), providing more than sufficient energy to counteract cooling losses, even if heating is not 100% efficient.
5 PHYSICAL CONDITIONS IN THE BUBBLE
If the observed cavities in the X-ray emission correspond to bub-bles injected by an AGN outburst, then we can use the X-ray and radio data available to constrain the nature of the plasma filling the bubbles. Our starting assumption is that the pressure in the bub-ble must be at least equal to the external thermal pressure, while it cannot be very much greater than that pressure to avoid driving a shock into the external medium. In addition, the bubble must be light compared to the external medium: it is hard to see how an over-dense ‘bubble’ could have reached its present distance from the nucleus of NGC 741.
5.1 Content of the bubbles
There are then two basic possibilities for the nature of the bubble material. The first is that it is very hot (i.e.Tb≫Text), low-density
material (for example Mathews et al. 2003and McCarthy et al. 2007). The second, and in our view more a priori likely, possibility for the nature of the bubble material is that it consists wholly or partly of a relativistic plasma, containing at least relativistic elec-trons and magnetic field, as found in the lobes of radio galaxies.
In the first case, the material would simply be a hot thermal plasma, and thus, a signature of this gas may be expected in the X-ray spectrum of the bubble. To investigate this, we used a method
similar to that of Sanders & Fabian (2006); we extracted a
spec-trum for the region defined as the cavity in Section 2.1. We fit the background subtracted (using a blank-sky background), grouped spectrum with an absorbed MEKAL model with a temperature fixed to that of the gas immediately around the cavity, with the
nor-malisation free to vary. This model provides a reasonable fit to the cavity spectrum, but cannot conclusively rule out the presence of very hot gas in the cavity. Thus, this component is frozen in the fit and a second MEKAL component is added to model the possi-ble hot phase with fixed abundance (set to 0.3Z⊙) and temperature,
leaving only the normalisation of this component free to vary. We varykTby hand between the temperature ranges of 5–40 keV, and for each value ofkTwe obtain a3−σupper limit on the normal-isation and convert this into the maximum pressure of the hot gas at a given temperature. If this pressure is significantly greater than the pressure of the external gas, it implies that the bubble would not be stable under this configuration (as there may also be an ad-ditional pressure component from non-thermal sources). However, if the pressure in the bubble from the putative hot component is less than the external pressure, this provides a lower limit on the temperature of any hot gas component. By varying the temperature of the second component until the maximum pressure in the hot component exceeds the external pressure, we can set a limit on the temperature of any hot component present in the gas. It should be emphasised that this is not a ’fit’ to the spectrum in the usual sense as there are insufficient counts to fit a two-component model. The method described merely provides a way of testing for the possible presence of a second component.
As the bubble is in direct mechanical contact with the IGM at a range of different radii (due to the fact that it is three dimensional), using a single temperature from the deprojected temperature profile would not be an accurate reflection of the temperature around the cavity. However, using a range of temperatures would not provide a satisfactory constraint on the pressure. We thus obtain the pro-jected temperature in an annulus at the radius of the centre of the cavity, to provide a more representative temperature and pressure constraint. Fitting the third annulus from the centre of the
Chan-dra data with a simple absorbed MEKAL model in the 0.5–5.0 keV
energy range and fixing the abundance to 0.3Z⊙, we obtain an
ex-ternal temperature of1.41±0.1keV. Assuming that the lower limit of the pressure of the gas is approximately5×10−12dyne cm−2,
an upper limit forTHcan be found. We obtain a limit of 10–20 keV
for the temperature of any putative hot component; above this tem-perature range, the gas is over-pressured with respect to the external pressure. Thus, we cannot rule out the presence of hot tenuous gas in the bubble.
In the second case, as discussed in Section 1, the combina-tion of electron energy spectrum and magnetic field must be such that the bubble produces no detectable radio or inverse-Compton X-ray emission. For simplicity we consider a uniform electron spec-trum and magnetic field strength throughout the bubble, and take the magnetic field to be ‘tangled’ so that it has an isotropic mag-netic stress tensor (Leahy 1991). Let the electron energy spectrum beN(E)such thatN(E)dE is the number density of electrons with energies betweenEandE+ dE, and let the energy density in non-radiating particles be some multipleκof the energy density in electrons, as is conventional: then the requirement of pressure balance gives us B2 2µ0 + (1 +κ) Z Emax Emin EN(E)dE= 3pext (3)
whereB is the magnetic field strength andEmin andEmax are
the limits on the electron energy densities to be considered. If we further assume some physically reasonable form for the electron energy density, such as a power law in energy (N(E) =N0E−p),
then, for a givenB,κ,EminandEmaxwe can solve equation 3 for
the normalizationN0of the electron spectrum, and so, effectively,
for the total number or energy density of the electron (particle) pop-ulation.
Pressure balance has been investigated using this basic for-malism for a variety of different types of filled cavities, with differ-ing results. In powerful FRII (Fanaroff & Riley 1974) radio galax-ies, it has been possible to measure the magnetic field strengths in the lobes of some systems by detection of inverse-Compton scattering of the cosmic microwave background (CMB): the field strengths turn out to be comparable to, though slightly below, the equipartition values for an electron/positron (κ = 0) plasma only (Croston et al. 2005), so thatB≈Beq, where
Beq2 2µ0 = (1 +κ) Z Emax Emin EN(E)dE (4)
and the corresponding plasma+magnetic field pressures are, in several cases, comparable to the measured external pressures (Hardcastle et al. 2002; Croston et al. 2004), suggesting thatκis indeed≈0in these systems. Even where no external pressure can be measured the fact that the measured magnetic field is close to the equipartition value forκ = 0has to be a systematic coinci-dence if(1 +κ) ≫ 1in these systems. On the other hand it has been known for many years (e.g., Morganti et al. 1988; Feretti et al. 1992; Hardcastle et al. 1998; Worrall & Birkinshaw 2000) that the minimum internal pressure (κ= 0,B≈Beq) in the lobes of
low-power FRI radio galaxies often falls orders of magnitude below the measured external pressure: Dunn et al. (2005) have recently com-mented on this effect in a sample of cluster-centre objects. In these systems it seems that either(1 +κ)≫1(as a change in the fill-ing factor of the plasma has a similar effect to an increase inκ, we do not consider this separately) or there is a strong departure from equipartition. In some cases the lack of detectable inverse-Compton emission has been used to argue that it is not possible thatB ≪Beq. In the following section we discuss the constraints
that the synchrotron and inverse-Compton limits on the NGC 741 cavity place on the nature of the cavity-filling plasma.
5.2 Constraints on the nature of the plasma
The key free parameters of eq. 3 areB,κ,Emin andEmax, and
p. We cannot constrain all of these from our observations. How-ever, it seems unlikely that the plasma is magnetically dominated, and so one constraint that we can impose is that the magnetic field should be less than or equal to the equipartition value,B <∼Beq.
The limits on observed synchrotron and inverse-Compton emissiv-ity place additional constraints on the parameters of the plasma: synchrotron emissivity at a given frequency constrains a com-bination of N0, B and Emax, while inverse-Compton
emissiv-ity constrainsN0 and to some extentEmax only. It is easiest to
calculate these constraints numerically, and we do this using the code of Hardcastle et al. (1998), assuming that the dominant pho-ton field for inverse-Comppho-ton scattering is the cosmic microwave background radiation (i.e. ignoring the negligible synchrotron self-Compton component). From the radio data in hand we set an up-per limit on the bubble flux density at 1.4 GHz of 7.4 mJy and at 330 MHz (Jetha et al. in prep) of 20 mJy. These limits were ob-tained from VLA observations of the source, with the 1.4 GHz data being the same as used in Section 3 and the 330 MHz from new observations (Jetha et al, in prep.). For each observation, since part of the radio source NGC 742 obscures the cavity, the non-detection limits of the cavity were taken to be three times the off-source rms noise multiplied by the square root of the number of beams in the
cavity at each frequency. From the X-ray observations, we impose an upper limit on the inverse-Compton flux density of 5.8 nJy at 1 keV.
We fix the power-law indexpat a relatively flat value (we choosep= 2.1based on the results of Young et al. 2005 for FRI radio sources) which reflects expectations from particle accelera-tion models: although there should almost certainly be a tail of par-ticles with a steeper value ofpdue to spectral ageing (as reflected in the steep spectral index of some observed radio lobe systems) it is very unlikely that it is correct to extrapolate this spectral index back to low energies, where the electron loss time-scales are very long, and the steep-spectrum tail makes a negligible contribution to the overall energy budget of the electrons. We conservatively take the minimum electron energy to beEmin =mec2, i.e.γmin = 1,
whereγis the Lorentz factor of the electron). For a given value of
κ, we can investigate the constraints onEmax(γmaxmec2) andB
given by the observations on the assumption of pressure balance as in equation 3.
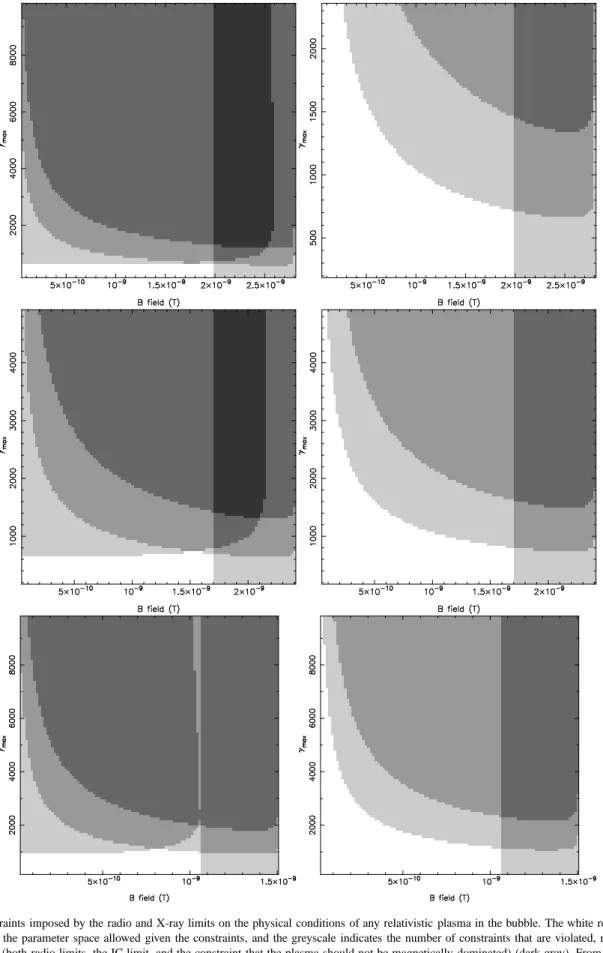
The results are plotted in Fig. 6 for two representative values ofκas defined above. We chose two values,κ= 0(i.e. relativistic electrons/positrons and field give the only contribution to the inter-nal pressure of the plasma, as in FRII sources) andκ = 10(i.e. there is a population of non-radiating particles, such as protons, with energy density exceeding that of the electrons by an order of magnitude). We carry out the calculations using the best estimate of the external pressure (7.7×10⁻¹²dyne cm−2) and the range
im-posed by the uncertainties in temperature, density and cavity posi-tion (3–10.4×10⁻¹²dyne cm−2). It can be seen that the radio and
X-ray data already impose quite severe constraints on the possible electron energy spectrum if the pressure is close to its best-fitting value. Forκ = 0the combination of inverse-Compton and syn-chrotron constraints requiresγmax<1000for any plausible value
ofB. Even forκ= 10the magnetic field strengths must be very low compared to their equipartition values forγmax to be greater
than a few×103: this compares toγ
max>∼2×10⁴for the lobes of
typical radio sources with detections at GHz frequencies (assuming fields close to equipartition). For the values ofκinvestigated (0 and 10), the bubble can be filled with a plasma withγmax>∼2×10³only
for the lowest external pressures and the lowest internal magnetic fields. It is clearly possible to choose a value ofκsuch that we have no constraint on the properties of the electron population – this cor-responds to a situation in which the energetics of the bubble plasma are entirely dominated by an ‘invisible’ component. However, it is interesting to consider the constraints on the electron population for a situation in which(1 +κ)≈1. For these low values ofκ, how can we obtain the required low values ofγmax?
Radiative losses alone (to synchrotron and inverse-Compton emission) would require a long time to reduce an initially high
γmaxto values∼1000. The maximum energy in an electron
popu-lation that initially extended to high energies after a timetis given by Pacholczyk (1970) γmax= 3 4 mec σTU t (5) wheremeis the mass of the electron,σT is the Thomson
cross-section andU is the total energy density in magnetic field and mi-crowave background photons (i.e. the total energy density impli-cated in loss processes). For equipartition magnetic field strengths synchrotron losses dominate, U = 3pext/2 and the age of the
bubble is > 2× 10⁸ years (though note that this calculation takes no account of the fact that the magnetic field may have been higher at earlier times). For magnetic field strengths much
less than equipartition inverse-Compton losses dominate, U = 8π5(kT
CMB)4/15(hc)3, and the limit on the age of the bubble is
closer to> 2×10⁹ years, wheretis the time since any high-energy particle acceleration took place in the source. These time-scales are considerably longer than the time-time-scales for the bubble to rise buoyantly to its current position (8.6×10⁷years, Section 4).
γmax may also be reduced by adiabatic expansion. which gives
γmax ∝ V−(Γ−1), where Γis the adiabatic index, 4/3. To take
a simple example, we could suppose that the original bubble had
γmax= 2×10⁴as quoted above and has expanded adiabatically.
Then the volume must have changed by a factor 8000 during the expansion; i.e. the initial radius of the bubble was around 1 kpc. But this would require the initial bubble to have been over pres-sured by a factor1.6×105if it is in pressure balance now, which
seems unlikely. As shown by Alexander (1987), more modest ex-pansion factors coupled with radiative losses do not greatly change the inferred ages.
We can therefore conclude that it seems hard for the bubble to have evolved from a ‘normal’ region of radio-emitting plasma – like the plumes of NGC 742 whose radio emission we see in the system at present – if the lobe external pressure is close to the best-fitting value. The present X-ray data do not allow us to constrain the pressure around the cavity well enough to rule this possibility out completely, though, and a deeper X-ray observation is required to allow us to draw firm conclusions: if the pressure is at the low end of the range we estimate, and the internal pressure of the cavity is dominated by non-radiating relativistic protons with a very low magnetic field, then the available constraints are much weaker. In a future paper we will apply the technique used above to constrain the nature of the cavity-filling plasma in other ‘ghost cavity’ systems.
6 CONCLUSIONS
We have examined the energetics of the galaxy group associated with NGC 741. We find that if the cavity seen in the X-ray data was originally inflated by a radio-loud AGN associated with the bright-est galaxy, NGC 741, then there is sufficient energy to counteract cooling. This interpretation is consistent with the fact that NGC 741 clearly has an active nucleus at the present time, and this could have been more active in the past.
We have investigated the nature of the cavity-filling plasma. We cannot rule out the possibility that the cavity is filled with a very hot thermal plasma (kT > 10keV) or with a relativistic plasma that is energetically completely dominated by non-radiating parti-cles. However, it is not at all clear that current models for AGN inflation of cavities can produce cavities of this kind, particularly when we take into account the relatively small distance (30 kpc) between the cavity and the centre of the host group. If on the other hand there is a substantial contribution to the energy density in the cavity from a plasma that contains relativistic electrons and mag-netic field, as in the active lobes of radio galaxies (such as NGC 742 in the same group) then we find that the limits placed by the non-detection of radio synchrotron and X-ray inverse-Compton radia-tion severely constrain the maximum electron Lorentz factor. In this scenario, we find that it is very hard for the cavity to have evolved to its current state from a ‘dead’ radio lobe by a combination of the standard processes expected to be operating (synchrotron, inverse-Compton, and adiabatic expansion losses); for radiative losses only the lobe would have to be older (>∼2×10⁸years) than any
plausi-ble bubplausi-ble inflation time (between5×107and9×107years). The
Figure 6. Constraints imposed by the radio and X-ray limits on the physical conditions of any relativistic plasma in the bubble. The white regions indicate
those regions of the parameter space allowed given the constraints, and the greyscale indicates the number of constraints that are violated, ranging from 1 (light grey) to 4 (both radio limits, the IC limit, and the constraint that the plasma should not be magnetically dominated) (dark grey). From top to bottom, the panels show the constraints for external pressures of10.4×10−12,7.7×10−12, and3.0×10−12dyne cm−2. The left-hand panels show theκ= 0
‘ghost cavities’ whose physical parameters have been investigated (e.g. Dunn et al 2005) and the fact that cavities are found at a wide range of radii (Birzan et al 2004) may indicate that inflation by the lobes of a standard radio-loud AGN is not a viable explanation for all ghost cavities. In the case of NGC 741, we are left with one clearly outstanding question: if the cavity in NGC 741 is due to an AGN-inflated bubble, in what form was the energy injected into the IGM, and in what form is it now?
ACKNOWLEDGEMENTS
NNJ thanks CNES (the French Space Agency) for funding. MJH thanks the Royal Society for a research fellowship. AB is sup-ported by NSERC (Canada) Discovery Grant program. He is grate-ful to the Leverhulme Trust for awarding him a Leverhulme Vis-iting Professorship, and thanks University of Oxford, Institute for Computational Cosmology (Durham) and University of Birming-ham for their hospitality during his frequent visits. EO’S acknowl-edges support from NASA grant NNX06AE90G-R. The authors would like to thank Monique Arnaud for her help with the
XMM-Newton data reduction and for useful conversations regarding the
data, and Gabriel Pratt and Etienne Pointecouteau for their help with the XMM-Newton data reduction software used in this paper. The authors also thank the anonymous referee for their useful com-ments in improving the text.
REFERENCES
Allen S. W., Dunn R. J. H., Fabian A. C., Taylor G. B., Reynolds C. S., 2006, MNRAS, 372, 21
Arnaud M., Majerowicz S., Lumb D., Neumann D. M., Aghanim N., Blanchard A., Boer M., Burke D. J., Collins C. A., Giard M., Nevalainen J., Nichol R. C., Romer A. K., Sadat R., 2002, A&A, 390, 27
Arnaud M., Neumann D. M., Aghanim N., Gastaud R., Majerow-icz S., Hughes J. P., 2001, A&A, 365, L80
Begelman M. C., 2001, in Hibbard J. E., Rupen M., van Gorkom J. H., eds, ASP Conf. Ser. 240: Gas and Galaxy Evolution Impact of Active Galactic Nuclei on the Surrounding Medium. pp 363–+ Birkinshaw M., Davies R. L., 1985, ApJ, 291, 32
Bˆırzan L., Rafferty D. A., McNamara B. R., Wise M. W., Nulsen P. E. J., 2004, ApJ, 607, 800
Bonfanti P., Rampazzo R., Combes F., Prugniel P., Sulentic J. W., 1995, A&A, 297, 28
Churazov E., Br¨uggen M., Kaiser C. R., B¨ohringer H., Forman W., 2001, ApJ, 554, 261
Clarke T. E., Sarazin C. L., Blanton E. L., Neumann D. M., Kas-sim N. E., 2005, ApJ, 625, 748
Croston J. H., Birkinshaw M., Hardcastle M. J., Worrall D. M., 2004, MNRAS, 353, 879
Croston J. H., Hardcastle M. J., Harris D. E., Belsole E., Birkin-shaw M., Worrall D. M., 2005, ApJ, 626, 733
Dunn R. J. H., Fabian A. C., Taylor G. B., 2005, MNRAS, 364, 1343
Ettori S., Fabian A. C., Allen S. W., Johnstone R. M., 2002, MN-RAS, 331, 635
Fanaroff B. L., Riley J. M., 1974, MNRAS, 167, 31 Feretti L., Perola G. C., Fanti R., 1992, A&A, 265, 9
Hardcastle M. J., Birkinshaw M., Cameron R. A., Harris D. E., Looney L. W., Worrall D. M., 2002, ApJ, 581, 948
Hardcastle M. J., Birkinshaw M., Worrall D. M., 1998, MNRAS, 294, 615
Hardcastle M. J., Worrall D. M., Birkinshaw M., 1998, MNRAS, 296, 1098
Jenkins C. R., Scheuer P. A. G., 1980, MNRAS, 192, 595 Jetha N. N., Ponman T. J., Hardcastle M. J., Croston J. H., 2007,
MNRAS, 376, 193
Jetha N. N., Sakelliou I., Hardcastle M. J., Ponman T. J., Stevens I. R., 2005, MNRAS, 358, 1394
Jones C., Forman W., Vikhlinin A., Markevitch M., David L., Warmflash A., Murray S., Nulsen P. E. J., 2002, ApJL, 567, L115 Kraft R. P., V´azquez S. E., Forman W. R., Jones C., Murray S. S., Hardcastle M. J., Worrall D. M., Churazov E., 2003, ApJ, 592, 129
Leahy J. P., 1991, Interpretation of large scale extragalactic jets. Beams and Jets in Astrophysics, pp 100–+
Mahdavi A., Finoguenov A., B¨ohringer H., Geller M. J., Henry J. P., 2005, ApJ, 622, 187
Mahdavi A., Geller M. J., 2004, ApJ, 607, 202
Mathews W. G., Brighenti F., Buote D. A., Lewis A. D., 2003, ApJ, 596, 159
McCarthy I. G., Babul A., Bower R. G., Balogh M. L., 2007, ArXiv e-prints, 706
McNamara B. R., Wise M., Nulsen P. E. J., David L. P., Sarazin C. L., Bautz M., Markevitch M., Vikhlinin A., Forman W. R., Jones C., Harris D. E., 2000, ApJL, 534, L135
Morganti R., Fanti R., Gioia I. M., Harris D. E., Parma P., de Ruiter H., 1988, A&A, 189, 11
Morita U., Ishisaki Y., Yamasaki N. Y., Ota N., Kawano N., Fukazawa Y., Ohashi T., 2006, PASJ, 58, 719
Mulchaey J. S., Zabludoff A. I., 1998, ApJ, 496, 73
Nulsen P. E. J., David L. P., McNamara B. R., Jones C., Forman W. R., Wise M., 2002, ApJ, 568, 163
Nusser A., Silk J., Babul A., 2006, ArXiv Astrophysics e-prints Omma H., Binney J., Bryan G., Slyz A., 2004, MNRAS, 348,
1105
Pacholczyk A. G., 1970, Radio astrophysics. Nonthermal pro-cesses in galactic and extragalactic sources. Series of Books in Astronomy and Astrophysics, San Francisco: Freeman, 1970 Peterson J. R., Paerels F. B. S., Kaastra J. S., Arnaud M., Reiprich
T. H., Fabian A. C., Mushotzky R. F., Jernigan J. G., Sakelliou I., 2001, A&A, 365, L104
Pratt G. W., B¨ohringer H., Croston J. H., Arnaud M., Borgani S., Finoguenov A., Temple R. F., 2007, A&A, 461, 71
Rafferty D. A., McNamara B. R., Nulsen P. E. J., Wise M. W., 2006, ApJ, 652, 216
Read A. M., Ponman T. J., 2003, A&A, 409, 395
Ruszkowski M., Begelman M. C., 2002, Bulletin of the American Astronomical Society, 201, 304
Sakelliou I., Peterson J. R., Tamura T., Paerels F. B. S., Kaastra J. S., Belsole E., B¨ohringer H., Branduardi-Raymont G., Fer-rigno C., den Herder J. W., Kennea J., Mushotzky R. F., Vestrand W. T., Worrall D. M., 2002, A&A, 391, 903
Sanders J. S., Fabian A. C., 2006, ArXiv Astrophysics e-prints Venkatesan T. C. A., Batuski D. J., Hanisch R. J., Burns J. O.,
1994, ApJ, 436, 67
Wise M. W., McNamara B. R., Nulsen P. E. J., Houck J. C., David L. P., 2007, ApJ, 659, 1153
Worrall D. M., Birkinshaw M., 2000, ApJ, 530, 719
Xu C., Baum S. A., O’Dea C. P., Wrobel J. M., Condon J. J., 2000, AJ, 120, 2950
Young A., Rudnick L., Katz D., DeLaney T., Kassim N. E., Mak-ishima K., 2005, ApJ, 626, 748