Custody in Wales:
A Factfile
Dr Robert Jones
Acknowledgements
ACKNOWLEDGEMENTS
The author would especially like to thank Lucy Morgan for all of her help in producing this report. I would also like to thank staff working at the Ministry of Justice who have responded to the many requests for information made during the course of this research. Finally, I am extremely grateful to Alan Cogbill, Emyr Lewis, Ed Poole, Huw Pritchard and Richard Wyn Jones for their insightful comments on an earlier draft of this report.
ABOUT US
The Wales Governance Centre is a research centre that forms part of Cardiff University’s School of Law and Politics undertaking innovative research into all aspects of the law, politics, government and political economy of Wales, as well the wider UK and European contexts of territorial governance. A key objective of the Centre is to facilitate and encourage informed public debate of key developments in Welsh governance not only through its research, but also through events and postgraduate teaching.
In July 2018, the Wales Governance Centre launched a new project into Justice and Jurisdiction in Wales. The research will be an interdisciplinary project bringing together political scientists, constitutional law experts and criminologists in order to investigate: the operation of the justice system in Wales; the relationship between non-devolved and devolved policies; and the impact of a single ‘England and Wales’ legal system.
CONTACT DETAILS
Wales Governance Centre at Cardiff University, 21 Park Place, Cardiff, CF10 3DQ. Web: http://sites.cardiff.ac.uk/wgc/
ABOUT THE AUTHOR
Robert Jones is a Research Associate at the Wales Governance Centre at Cardiff University. His research focuses upon devolution and criminal justice in Wales.
CONTENTS
EXECUTIVE SUMMARY 4
NOTES ON TEXT 6
1. INTRODUCTION 9
2. IMPRISONMENT IN WALES 11
3. MAGISTRATES’ AND CROWN COURTS 16
4. SEX AND IMMEDIATE CUSTODY 20
5. CHILDREN AND IMMEDIATE CUSTODY 29
6. YOUNG ADULTS AND IMMEDIATE CUSTODY 37
7. ADULTS AND IMMEDIATE CUSTODY 45
8. ETHNICITY AND IMMEDIATE CUSTODY 53
9. OFFENCE TYPE AND IMMEDIATE CUSTODY 67
10. CUSTODIAL SENTENCE LENGTH 99
11. CONCLUSION 123
Executive Summary
EXECUTIVE SUMMARY
This report offers the very first disaggregated analysis of sentencing and immediate custody in Wales and England. The research comes after a report by the Ministry of Justice’s (2017a:8)
Justice in Wales Working Group acknowledged the need to take account of any potential
“differences in sentencing” between Wales and England. The report draws upon data published by the Ministry of Justice as well as information obtained via the Freedom of Information Act 2000. Some of the key findings are outlined below.
• Wales has the highest imprisonment rate in Western Europe.
• Wales has recorded a higher ‘home address’ imprisonment rate than England every year
since 2013, the first year comparative data is available.
• The total number of immediate custodial sentences handed out in England fell by 16%
between 2010 and 2017. In Wales, the number marginally increased (0.3%) during the same period.
• Wales recorded a higher average custody rate than England at the Magistrates’ Court and
Crown Court between 2010 and 2017.
• The average custody rate for males was higher at the Magistrates’ Court and Crown Court
in Wales between 2010 and 2017.
• The average custody rate for females sentenced at the Magistrates’ Court was higher in
England but higher at the Crown Court in Wales.
• Children were more likely to be handed an immediate custodial sentence at the Youth
Court in England between 2010 and 2017. The custody rate at the Crown Court was higher in Wales during this period.
• The custody rate for young adults was higher at the Magistrates’ Court and Crown Court
in Wales between 2010 and 2017.
• Adult offenders sentenced at the Magistrates’ Court in England were more likely to
receive an immediate custody sentence between 2010 and 2017. The custody rate for adults was higher at the Crown Court in Wales than in England during this period.
• Welsh and English prisoners from a White ethnic group were under-represented in prison
in 2017.
• The level of racial disproportionality was higher amongst the Welsh prison population
• There were 72 Black people in prison from Wales for every 10,000 of the population in 2017. This rate compared to just 15 White people per 10,000 of the population. There were 25 Asian people in prison per 10,000 and 37 people from a Mixed background per 10,000 in prison.
• 1 in 670 Welsh people who self-identified as White were in prison in 2017. This compared
to a rate of 1 in 140 for Black, 1 in 274 for Mixed and 1 in 395 for Asian.
• The custody rate was higher at the Magistrates’ Court in Wales in 9 out of 12 offence
groups between 2010 and 2017.
• The custody rate was higher at the Crown Court in Wales than in England in 11 out of 12
offence groups between 2010 and 2017.
• A greater number of short-term custodial sentences were handed out in Wales than in
England between 2010 and 2017. 68.1% of all custodial sentences in Wales were for less than 12 months compared to 63.9% in England.
• A higher number of sentences of 4 years or more were handed out in England (8.9%) than
in Wales (6.2%) between 2010 and 2017.
• In 2017, the average custodial sentence length for all offences in England was 17.2
months. This compared to an average custodial sentence length of 13.4 months in Wales.
• Women are more likely to receive short-term custodial sentences than men. More than
three quarters (78.6%) of all females sentenced to immediate custody in Wales between 2010 and 2017 were handed sentences of less than 12 months. This compared to 67% of male offenders sentenced in Wales.
• One in four (24.8%) women handed an immediate custodial sentence in Wales were
sentenced to one month or less in prison between 2010 and 2017.
• White offenders (13.2 months) sentenced to immediate custody in Wales had the lowest
average custodial sentence length in 2017. Black offenders recorded the highest average sentence length (21.5 months), followed by Asian (19 months) and Mixed (17.7 months) offenders.
• The average custodial sentence length was higher in England within nine out of twelve
offence groups in 2017.
• The number of Welsh people in prison serving sentences of 4 year or more increased by
Notes on Text
NOTES ON TEXT
Unless otherwise stated, all data used in this report were gathered from the Ministry of Justice’s
Court Outcomes by Police Force Area data tool (Pivot Table): December 2017.1
According to the notes accompanying the data tool, all statistics on sentencing included in the pivot table are either derived from the LIBRA case management system, which holds the magistrates’ courts records, or the Crown Court’s CREST system which holds the trial and
sentencing data. The data includes offences where there has been no police involvement, such as those prosecutions instigated by government departments, private organisations and individuals. The figures given in the pivot table relate to defendants for whom these offences were the principal offences for which they were dealt with. When a defendant has been found guilty of two or more offences it is the offence for which the heaviest penalty is imposed. Where the same disposal is imposed for two or more offences, the offence selected is the offence for which the statutory maximum penalty is the most severe.
The more detailed offence groups included in the data (e.g. violence against the person, sexual offences, robbery) broadly align with the offence groups presented by the Home Office counting rules. The Home Office notes that these categorisations may not match completely in terms of group names or the codes included. These differences result from a range of factors, including differences in the offences included (e.g. data only include recorded crime) and the focus of each classification.
Due to data recording issues figures for females prosecuted for ‘Sexual activity with a child’ offences are not included in the Court Proceedings Database prior to 2015. For the years since 2015, females comprise less than 5% of prosecutions and convictions for these offences.
Ambiguity in the status of small business owners can occasionally lead to defendants recorded as companies receiving sentences only available to people, such as custodial sentence lengths. According to the Ministry of Justice, if there is an apparent anomaly in a defendant’s age, records may automatically be assigned a default age of 25 for an adult or 17 for a ‘juvenile’ meaning that these ages are overcounted. Additionally, prior to 2017 if a defendant’s date of birth was unknown they would be assigned one of these default ages. To improve the accuracy of the ‘age range’ variable, for 2017 defendants with an unknown date of birth were grouped within ‘unknown age – adult’ or ‘unknown age – juvenile’. The Ministry of Justice warn that caution should be taken when comparing ages between years, because prior to 2017 the age ranges 16-17 and 25+ include a substantial number of defendants with unknown date of birth (Chapter Five, Six and Seven).
1 https://www.gov.uk/government/statistics/criminal-justice-system-statistics-quarterly-december-2017
Prison population data broken down by ethnicity were obtained by the Ministry of Justice from self-reports of prisoners. Sentencing outcomes by ethnicity are categorised by the Ministry of Justice using the 5+1 self-identified classification based on the 16+1 classification used in the 2001 Census. Due to an inconsistency in the recording of ‘Chinese and other’ by the Ministry of Justice and the 2011 Census, the ‘Asian’ category included in the tables on prison population do not include those identified as ‘Chinese’. Because of this issue, ‘Chinese and other’ were not included in the analysis of sentencing outcomes by ethnicity (Chapter Eight).
The Ministry of Justice acknowledge that the recording of ethnicity data for defendants at
Magistrates’ Courts has been insufficient,2 with high proportions of unknown ethnicity. The
recording of ethnicity data for indictable offences has been more complete than summary offences because in charged cases the defendant will have been seen by the police and asked about their ethnicity. In cases where the defendant received a summons, they will not have been seen by the prosecutor, and may not have appeared in court. High levels of missing data limit what conclusions can be drawn from immediate custody data by ethnic group at Magistrates’ Courts in England and Wales (Chapter Eight and Ten).
Sentencing data broken down by police force area is used in this report to compare sentencing outcomes at courts in Wales and England. Although it is understood that not all people
sentenced at Welsh courts will be domiciled in Wales, there is an expectation that many people sentenced at courts in Wales will be domiciled in Wales (the same rule applies to England). Section 30 of the Courts Act 2003 provides directions to ensure that where a person is required to appear before a magistrates’ court they are required to appear in a place ‘in the local justice area’. This includes a location in the local justice area in which the offence is alleged to have been committed, a place in which the person charged resides, a place in which witnesses (or the majority of witnesses) reside, or a place where other cases raising similar issues are being dealt with. There are 10 local justice areas in Wales following the introduction of the Local Justice
Areas Order 2016.3 At the Crown Court, Criminal Procedure Rule 9.3 states that in deciding
the Crown Court centre at which trial will take place, one of the considerations should be the
convenience of the courts location for parties and witnesses involved in the case.4
All data relating to the ‘home address’ of prisoners is based on a prisoner’s origin address (home address on reception into custody). The Ministry of Justice state that around 97% of prisoners have an origin location; i.e. addresses that are recorded on its central IT system. If no address is given, an offender’s committal court address is used as a proxy for the area in which they are resident. Those with no recorded origin are typically foreign nationals or those recently received into custody. No address has been recorded and no court information is available for around 3% of all offenders; these figures are excluded from the tables included in this report (Chapter Two).
2 https://assets.publishing.service.gov.uk/government/uploads/system/uploads/attachment_data/file/733998/criminal-justice-statistics-guide-december-2017-update.pdf
3 North West Wales; North Central Wales; North East Wales; Montgomershire; Cardiff; Mid Wales; Gwent; Carmarthenshire; Ceredigion; West Glamorgan. https://www.legislation.gov.uk/uksi/2016/941/pdfs/uksiem_20160941_en.pdf
4 Other considerations include how soon a suitable courtroom will become available; and the directions on the allocation of Crown Court business. https://www.justice.gov.uk/courts/procedure-rules/criminal/docs/crim-proc-rules-2014-part-09.pdf
Notes on Text
Welsh and English adult prison population data were obtained from the Ministry of Justice using the Freedom of Information Act 2000. The Freedom of Information Act provides a “powerful tool” for social researchers carrying out research in areas where data are not made publicly available (Savage and Hyde, 2014: 315). The Ministry of Justice do not publish Welsh-only or English-only prison population data.
The calculation of average custody rates reveal the proportion of sentences resulting in immediate custody in England and Wales. There are eight possible sentencing outcomes included in the pivot table: absolute discharge, conditional discharge, fine, community sentence, suspended sentence, immediate custody, otherwise dealt with, and compensation (Chapter Three, Four, Five, Six, Seven, Eight and Nine).
Due to small sample sizes for particular groups, year to year changes in the use of immediate custody or in the custody rate are likely to result in large fluctuations in the population change. The measure of custodial sentence length is used to show how likely offenders are to receive short, medium or long-term custodial sentences. This includes a breakdown by court, sex, age, ethnicity and offence type in England and Wales. There are a total of 18 sentence length options included in the pivot table, these range from up to and including one month in custody to life imprisonment. Imprisonment for Public Protection sentences are not included in the analysis of sentence length. The Legal Aid, Sentencing and Punishment of Offenders Act 2012 (LASPO) abolished the sentence of Imprisonment for Public Protection and Extended Sentences for Public Protection (Chapter Ten).
The calculation of average custody rates and average custodial sentence lengths are used in this report to compare trends between Wales and England. These measurements are
frequently calculated and included within the Ministry of Justice’s quarterly Criminal Justice
Statistics bulletins. However, while such “headline statistics” are described by the Sentencing
Council (2018b: 2) as “broad brush” measures that do not take account of the full range of legal factors that determine sentencing outcomes, the unavailability of detailed Welsh-only sentencing data limits what analysis can be undertaken on a disaggregated level. In preparing this report an email requesting access to Welsh-only data from the Crown Court Sentencing Survey was sent to the Sentencing Council. In its response, the Sentencing Council confirmed that disaggregated data exists but that they are “not able to provide Crown Court Sentencing Survey data broken down by country”.
1. INTRODUCTION
The prison population in England and Wales has exponentially increased since the 1990s. This rise in prisoner numbers has led to a continual expansion of the prison estate (Scott, 2018) and repeated government claims that prison numbers in England and Wales will continue to rise
in future (Ministry of Justice, 2018a).5 While efforts have been made to understand the many
factors that have contributed to England and Wales now boasting one of the highest rates of imprisonment in the western world (e.g. Roberts and Ashworth, 2016), scant research or attention has been paid to the role that Wales has played in this remarkable upward trend. Even as Wales becomes a more distinct and recognisable part of the single jurisdiction
(Rawlings, 2018), very little is known about the state of criminal justice in Wales. Both academic and government analyses of sentencing, imprisonment and the use of immediate custody, for example, continue to be undertaken at an England and Wales level (e.g. Hopkins, 2015; Hopkins et al, 2016; Millie et al, 2003). This disregard to the territorial dimension has continued despite repeated concerns over the treatment and welfare of Welsh prisoners (House of Commons Welsh Affairs Committee; 2007; 2015), as well as major changes to the prison estate in Wales including the opening of the second largest prison in Western Europe at Wrexham in 2017.
Indeed, differences in criminal justice practices that exist within national borders may often be
“as great, or even greater” than those that exist between jurisdictions (Edwards et al, 2013:
378). Research has shown that variation within the same jurisdictional settings can be found
within policing practices (e.g. Crawford and Lister, 2007; House of Commons Home Affairs Committee, 2015); community orders (e.g. Patel and Stanley, 2008) and the use of imprisonment (e.g. Muller and Wildeman, 2016). Importantly, studies on sentencing have identified that court outcomes are likely to vary across areas in the same jurisdiction (e.g. Mason et al, 2007; Goodall and Durrant, 2013).
In 2017, the Ministry of Justice’s (2017a:8) Justice in Wales Working Group acknowledged the
need to “take into account” any potential “differences in sentencing” between Wales and
England. Its final report included a call to consider whether the impact of the Sentencing Council’s guidelines in Wales “may be different to that in England” (Ministry of Justice, 2017a: 8). Despite the Working Group’s findings, the body responsible for issuing and regulating sentencing
guidelines in England and Wales appear reluctant to take Wales seriously as unit of analysis. In its written evidence to the Commission on Justice in Wales, the Sentencing Council (2018a:1) downplayed the view that differences might exist in Wales, maintaining that the current guidelines ensure a consistency in approach “regardless of location” within the single jurisdiction. Any
5 The Ministry of Justice announced in August 2018 that it expects the prison population in England and Wales to increase by 3,200 places by March 2023.
https://assets.publishing.service.gov.uk/government/uploads/system/uploads/attachment_data/file/735428/prison-population-projections-2018-2023.PDF
Introduction
variations between areas, the Council (2018: 1) explained, are likely to be nothing more than “localised differences” including the fact that offending may be in a rural or urban setting. The Sentencing Council’s (2018b: 1) disregard of any potential “distinction” between Wales and England is key to shaping the aims of this research. This report consists of nine chapters on imprisonment in Wales; the use of immediate custody at the Magistrates’ and Crown Court; sex and immediate custody; children and immediate custody; young adults and immediate custody; adults and immediate custody; ethnicity and immediate custody; immediate custody by offence type and custodial sentence length. First, it offers a direct response to the Ministry of Justice’s claim that further attention should be paid to potential differences in sentencing in Wales and England. Second, the report seeks to address the existing lacuna in criminal justice research by taking stock of imprisonment levels and the use of immediate custody in Wales. By contributing to ongoing and future debates on criminal justice in Wales, this reports adds much further weight to the claim that Wales should be treated seriously as a unit of criminological analysis by academics, policy makers, politicians and practitioners alike.
2. IMPRISONMENT IN WALES
2.1 National rates of imprisonment are the most accessible and commonly used measure for comparing international penal practices.
2.2 Despite concerns that imprisonment rates can often provide a rather narrow
conceptualisation of punishment across international jurisdictions (Young and Brown, 1993), imprisonment rates are regularly used to explore international as well as intra-national differences between states, regions and local districts.
2.3 In June 2018, Wagner and Sawyer (2018) used state wide imprisonment data to produce a comparison of imprisonment rates across the United States. Their research found that the state of Oklahoma recorded the highest worldwide rate of imprisonment (1,079 per 100,000), followed by Louisiana (1,052 per 100,000) and Mississippi (1,039 per 100,000). 2.4 A recently-published study by Scott (2018) used imprisonment levels by local authority
to compare the rates of imprisonment between the most and least deprived areas in England. The research found that the rates of imprisonment in the most deprived areas were up to six times higher than the levels recorded in the least deprived local authorities in England.
2.5 In November 2018, The Institute for Criminal Policy Research published the twelfth edition
of the World Prison Population List.6 First produced by the Home Office in 1999, the latest
report provides a breakdown of imprisonment rates for 223 prison systems worldwide using a calculation based on the number of people held in prison in national borders.
2.6 England and Wales has recorded the highest rate of imprisonment in Western Europe in
half of the twelve World Prison Population Lists published since 1999.7
2.7 Taking all twelve published World Prison Population Lists, England and Wales has recorded the highest prison population rate in Western Europe since 1999.
6 The first five editions of the World Prison Population List were published by the Research and Statistics Directorate of the United Kingdom Home Office; the next five were published by the International Centre for Prison Studies (ICPS). Following the merger in November 2014 of ICPS with the Institute for Criminal Policy Research (ICPR), the eleventh edition was the first to be published by ICPR.
Imprisonment in Wales
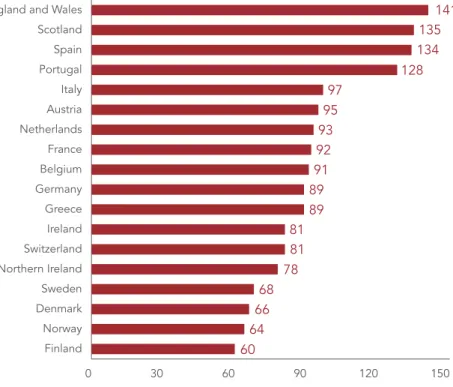
Figure 2.1 – The average prison population rate per 100,000 in Western Europe, 1999 to 2018
Source: Institute for Criminal Policy Research (World Prison Population List)8
2.8 There were an average of 84,866 people in prison in England and Wales in 2017.9
2.9 With a combined population of 58,744,595, the prison rate for England and Wales was
144 prisoners per 100,000 population in 2017.10
2.10 There were 80,904 people held in 114 English prisons in 2017. Based on the ‘in country’
method used in the World Prison Population List, England’s rate of imprisonment was 145
per 100,000 in 2017.11
2.11 3,963 people were held in Welsh prisons in 2017.12 Based upon the number of prisoners
held in Welsh prisons, Wales had an imprisonment rate of 127 prisoners per 100,000 in
2017.13
8 http://www.prisonstudies.org/research-publications
9 Ministry of Justice – Prison Population Figures: 2017 – https://www.gov.uk/government/statistics/prison-population-figures-2017. The average population for 2017 was calculated using prison population levels from March, June, September and December 2017. This does not include those held in Immigration Removal Centres.
10 Population data for England and Wales were obtained from Office for National Statistics – mid-2017 population estimates. https://www.ons.gov.uk/peoplepopulationandcommunity/populationandmigration/populationestimates/datasets/ populationestimatesforukenglandandwalesscotlandandnorthernireland
11 The figure would be 81,632 if Immigration Removal Centres were included. The rate for this population would be 147 per 100,000.
12 The prison estate in Wales is comprised of five different establishments: HMP Berwyn, HMP Cardiff, HMP and YOI Parc, HMP Swansea and HMP Usk and HMP Prescoed. HMP Usk and HMP Prescoed are two separate prisons located on separate sites but managed as a single prison. 13 Calculated based on a population of 3,125,200. The figures were obtained from Office for National Statistics – mid-2017 population
estimates. https://www.ons.gov.uk/peoplepopulationandcommunity/populationandmigration/populationestimates/datasets/ populationestimatesforukenglandandwalesscotlandandnorthernireland 0 30 60 90 120 150 Finland Norway Denmark Sweden Northern Ireland Switzerland Ireland Greece Germany Belgium France Netherlands Austria Italy Portugal Spain Scotland
England and Wales 141
135 134 128 97 95 93 92 91 89 89 81 81 78 68 66 64 60
2.12 The ‘in country’ rate of imprisonment in Wales is expected to increase significantly once
HMP Berwyn becomes fully operational.14 In November 2018, the ‘in country’ rate of
imprisonment in Wales had increased to 148 per 100,000 compared to a rate of 141 per
100,000 in England.15
2.13 Disaggregated data using the ‘home address’ of prisoners prior to entering custody allows for an alternative calculation of prison rates in England and Wales. According to the Ministry of Justice, there were a total of 83,411 people in prison with a home address
in either England or Wales in 2017.16
2.14 Using ‘home address’ data that were obtained from the Ministry of Justice, Wales has recorded a higher rate of imprisonment than England each year since 2013.
2.15 This is despite the fact that police recorded crime in Wales was lower than England in every year between 2013 and 2017. The average rate of offences in Wales was 62.5
compared to 68.6 offences in England during this period.17
14 HMP Berwyn is expected to have an operational capacity of 2,106 places. In October 2018 the prison held 1,221 prisoners. https://www.gov.uk/government/statistics/prison-population-figures-2018
15 There were 4,618 prisoners held in Wales and 78,234 people held in English prisons in October 2018. The figure in England would be 78,528 and 141 per 100,000 if Immigration Removal Centres were included.
16 Those excluded from the total number include individuals with a recorded home addresses outside of England and Wales or with no recorded home address. According to the Ministry of Justice, there were 1,796 prisoners neither qualifying as ‘Welsh’ nor ‘English’ in 2017. 17 Office for National Statistics - Crime in England and Wales: Police Force Area Data Tables.
Imprisonment in Wales
Figure 2.2 – Prison population rates per 100,000 in England and Wales using home address, 2013 to 201718
Population Prisoners Rate
2017 England 55,619,430 78,601 141 Wales 3,125,165 4,810 154 2016 England 55,268,067 78,456 142 Wales 3,113,150 4,758 153 2015 England 54,786,327 78,477 143 Wales 3,099,086 4,843 156 2014 England 54,316,618 77,962 144 Wales 3,092,036 4,700 152 2013 England 53,865,817 76,698 142 Wales 3,082,412 4,702 153
Source: Office for National Statistics and Ministry of Justice
2.16 In 2017, there were 154 Welsh prisoners per 100,000 of the Welsh population. This
compared to a rate of 141 English prisoners per 100,000 of the population of England.19
2.17 The English prisoner total recorded in 2017 would need to rise by 7,100 (9%) to achieve an imprisonment rate equal to Wales. Alternatively, the Welsh population would need to increase by 270,000 to bring the Welsh imprisonment rate in line with England’s in 2017. 2.18 In 2017, 1 in every 650 Welsh people were in prison. This figure compares to 1 in every
708 people in England.
18 Population data were obtained from the Office for National Statistics – mid-2017 population estimates.
See https://www.ons.gov.uk/peoplepopulationandcommunity/populationandmigration/populationestimates/datasets/ populationestimatesforukenglandandwalesscotlandandnorthernireland
Prison population data were obtained from the Ministry of Justice via the Freedom of Information Act 2000.
19 Even if the 1,976 prisoners excluded from the data were added to the English total, England’s rate of imprisonment would still be lower than Wales’ in 2017.
2.19 At the end of September 2018, there were 4,771 Welsh people in prison and 76,570 prisoners with a home address in England. Using ONS population estimates from mid-2017, Wales had an imprisonment rate of 153 per 100,000 in September 2018. This
compared to a rate of 138 per 100,000 prisoners from England.20
2.20 Despite the fact that Wales has consistently recorded a higher rate of imprisonment since 2013, neither government research nor academic analyses of penal policy in England and Wales have identified this trend, nor offered explanation for potential differences in criminal justice practices in Wales and England.
2.21 In 2017, a report by the Ministry of Justice’s Justice in Wales Working Group
acknowledged the need to explore any potential “differences in sentencing” between Wales and England. This included considering whether the impact of the Sentencing Council for England and Wales’ guidelines in Wales “may be different to that in England” (Ministry of Justice, 2017a: 8).
2.22 In May 2018, the Sentencing Council downplayed the need to consider possible
differences between sentencing practices in England and Wales. In its written evidence to the Thomas Commission, the Sentencing Council (2018b: 1) stated that “when assessing
current sentencing practice… the Council does not make any distinction between the
sentences passed in England and Wales (except insofar as the legislative framework is different)”.
2.23 While research has identified a range of contributing factors to the rise in prisoner
numbers in England and Wales since the 1990s (Roberts and Ashworth, 2016; Millie et al,
2003; Sentencing Council, 2018a),21 the increasing use of immediate custodial sentences
is understood to have played a very significant role.
2.24 The Ministry of Justice (2016a: 7) explained that “virtually all of the increase in the prison population” since 1993 was due to the rise in the number of offenders sentenced to immediate custody in England and Wales.
2.25 To examine why Wales has a higher imprisonment rate than England, the remaining
chapters of this factfile will explore the use of immediate custody in Wales and England.22
20 Population data were obtained from the Office for National Statistics – mid-2017 population estamites.
See https://www.ons.gov.uk/peoplepopulationandcommunity/populationandmigration/populationestimates/datasets/ populationestimatesforukenglandandwalesscotlandandnorthernireland
Prison population data were obtained from the Ministry of Justice via the Freedom of Information Act 2000.
21 These contributing factors include the introduction of extended determinate sentences and statutory maximum sentences and minimum terms, a lack of confidence in custodial alternatives, the use of longer sentences, the establishment of new offences, and an increase in the number of serious offences coming before the courts.
22 Although it is understood that not all people sentenced at Welsh courts will be domiciled in Wales, there is an expectation that many people sentenced at courts in Wales will be domicided in Wales (the same rule applies in England). See ‘Notes’ section of this on page seven.
Magistrates’ and Crown Courts
3. MAGISTRATES’ AND CROWN COURTS
23Category Higher Average Custody Rate England % Wales %
Magistrates Wales 3.91 4.02
Crown Wales 55 58.5
Source: Ministry of Justice
3.1 The number of offenders convicted at all courts in England and Wales decreased by 12%
from 1.36 million in 2010 to 1.2 million in 2017 (Ministry of Justice, 2018b).24
3.2 The Ministry of Justice’s most recent Criminal Justice Statistics Bulletin reported that the number of offenders convicted at all courts in England and Wales continued to decline. In June 2018, this conviction figure had fallen to 1.19 million (Ministry of Justice, 2018c). 3.3 The total number of immediate custodial sentences handed out at all courts in England
and Wales fell by 15% between 2010 and 2017.25
3.4 The custody rate across all courts in England and Wales also fell during this period. The rate decreased by 3% from 7.43% in 2010 to 7.21% in 2017.
3.5 At Magistrates Courts in England and Wales, the number of immediate custodial
sentences fell by 14.1% between 2010 and 2017.26
3.6 The proportion of cases resulting in an immediate custodial sentence at Magistrates’
Courts also fell (3.1%) during this period.27
3.7 However, as the total number of immediate custodial sentences handed out in England fell by 16% between 2010 and 2017, the number in Wales marginally increased (0.3%)
during the same period.28
3.8 The average custody rate at the Magistrates’ Court was higher in Wales (4.02%) than England (3.91%) between 2010 and 2017.
3.9 The number of immediate custodial sentences handed out at Magistrates’ Court in Wales
increased by 12% between 2010 and 2017.29
23 There are six Crown courts and fourteen Magistrates’ courts in Wales. Since 2010, twenty-four Crown and Magistrates’ courts have closed in Wales as part of the Ministry of Justice’s attempts to ‘transform’ the court and tribunal estate in England and Wales. For a full list of closures in England and Wales (as of April 2018). https://www.parliament.uk/business/publications/written-questions-answers-statements/written-question/Commons/2018-04-18/136450
24 From 1,365,347 in 2010 to 1,201,879 in 2017. This includes the 43 forces and special/miscellaneous and unknown police forces. 25 From 101,508 in 2010 to 86,255 in 2017.
26 From 48,904 in 2010 to 41,992 in 2017. 27 From 3.87% in 2010 to 3.75% in 2017.
28 England: From 95,244 in 2010 to 79,970 in 2017. Wales: From 6,264 in 2010 to 6,285 in 2017. 29 From 3,078 in 2010 to 3,449 in 2017.
Figure 3.1 – The use of immediate custody at Magistrates’ and Crown Courts in Wales, 2010 to 2017
Source: Ministry of Justice
3.10 The custody rate at Magistrates’ Courts in Wales increased by 10.2% during this period, from a rate of 4.02% in 2010 to 4.43% in 2017.
Figure 3.2 – The custody rate at Magistrates’ Courts in England and Wales, 2010 to 2017
Source: Ministry of Justice
3.11 In contrast to Wales, the number of custodial sentences handed out at Magistrates’
Courts in England fell by 15.9% between 2010 and 2017.30
30 From 45,826 in 2010 to 38,543 in 2017. 0 500 1000 1500 2000 2500 3000 3500 2017 2016 2015 2014 2013 2012 2011 2010 Crown Magistrates 0.0 0.5 1.0 1.5 2.0 2.5 3.0 3.5 4.0 4.5 5.0 2017 2016 2015 2014 2013 2012 2011 2010 Wales England
Magistrates’ and Crown Courts
3.12 The custody rate at English Magistrates’ Courts also decreased by 4.1% during this period, from 3.86% in 2010 to 3.70% in 2017.
Figure 3.3 – The use of immediate custody at Magistrates’ and Crown Courts in England, 2010 to 2017
Source: Ministry of Justice
3.13 In England and Wales, the number of immediate custodial sentences handed out at
Crown Courts fell by 15.9% between 2010 and 2017.31
3.14 During the same period, the custody rate at Crown Courts in England and Wales increased by 12.6%, from 51.6% in 2010 to 58.1% in 2017.
3.15 The trend of falling immediate custodial sentences and rising custody rates has emerged
in England and Wales throughout the last decade. The most recent Criminal Justice
Statistics Quarterly bulletin reported that the custody rate for indictable offences had
increased from 24% in June 2010 to 32% in June 2018 (Ministry of Justice, 2018c). 3.16 The average custody rate at the Crown Court was higher in Wales (58.5%) than England
(55%) between 2010 and 2017.
3.17 There was not a single year between 2010 and 2017 where the custody rate at the Crown Court in Wales was lower than England.
3.18 There was an 11% fall in the number of immediate custodial sentences handed out at
Crown Courts in Wales between 2010 and 2017.32
31 From 52,604 in 2010 to 44,263 in 2017. 32 From 3,186 in 2010 to 2,836 in 2017. 0 10000 20000 30000 40000 50000 60000 2017 2016 2015 2014 2013 2012 2011 2010 Crown Magistrates
3.19 The proportion of cases resulting in an immediate custodial sentence at Crown Courts in
Wales was 14.1% higher in 2017 than in 2010.33
Figure 3.4 – The custody rate at Crown Courts in England and Wales, 2010 to 2017
Source: Ministry of Justice
3.20 The number of immediate custodial sentences handed out at English Crown Courts fell
by 16.2% between 2010 and 2017.34
3.21 Although the number of custodial sentences in absolute terms was lower in 2017, the
custody rate was 12.5% higher at Crown Court in England in 2017 than it was in 2010.35
33 From 55.3% in 2010 to 63.1% in 2017. 34 From 49,418 in 2010 to 41,427 in 2017. 35 From 51.4% in 2010 to 57.8% in 2017. Wales England 0 10 20 30 40 50 60 70 2017 2016 2015 2014 2013 2012 2011 2010
Sex and Immediate Custody
4. SEX AND IMMEDIATE CUSTODY
Category Higher Average Custody Rate England % Wales %
Female (Magistrates) England 1.59 1.55
Male (Magistrates) Wales 5.02 5.45
Female (Crown) Wales 33 35.1
Male (Crown) Wales 57.7 61.7
Source: Ministry of Justice
4.1 The number of women in prison in England and Wales has more than doubled since 1993 (Prison Reform Trust, 2018).
4.2 However, since 2010 the number of female prisoners in England and Wales has fallen. The number of women in prison decreased by 10.1%, from 4,230 in August 2010 to 3,803
at the end of June 2018.36
4.3 In its Female Offender Strategy, published in June 2018, the Ministry of Justice outlined the need for “an entirely different approach” to the treatment of women in the criminal justice system (Ministry of Justice, 2018d: 5). Drawing upon the findings from Baroness Corston’s review in 2007, the Ministry of Justice identified the use of custodial sentences, especially short-term, as a major problem for women.
4.4 Due to the fact that there are no women’s prisons in Wales, all Welsh female prisoners are held in prisons in England. This has led to a recognition of the “distinct set of issues” facing female prisoners from Wales including distances from home, family contact and links with community-based services (Rees et al, 2017; House of Commons Welsh Affairs
Committee, 2007:19).37
4.5 The average custody rate for female offenders sentenced at the Magistrates’ Court was higher in England (1.59%) than Wales (1.55%) between 2010 and 2017.
4.6 Between 2010 and 2017, 62.8% of all immediate custodial sentences handed to female
offenders in Wales were at the Magistrates’ Court.38
36 The figure for August 2010 was sourced from the Prison Reform Trust (2010).
The data from June 2018 was accessed via Offender Management Statistics Quarterly: April to June 2018 – https://www.gov.uk/ government/statistics/offender-management-statistics-quarterly-april-to-june-2018
37 Although the number of immediate custodial sentences handed to females across England and Wales has fallen in recent years, the number of Welsh women in prison reached its highest point in September 2018 since the Wales Governance Centre began collecting disaggregated data from March 2013.
Figure 4.1 – The use of immediate custody for females sentenced at Magistrates’ and Crown Courts in Wales, 2010 to 2017
Source: Ministry of Justice
4.7 The number of immediate custodial sentences handed to female offenders at Magistrates’
Courts in Wales increased by more than a third (35.9%) between 2010 and 2017.39
4.8 The rate at which female offenders were sentenced to immediate custody at Magistrates’ Courts in Wales increased by 18%, from 1.61% in 2010 to 1.9% in 2017.
39 From 315 in 2010 to 428 in 2017. 0 50 100 150 200 250 300 350 400 450 2017 2016 2015 2014 2013 2012 2011 2010 Crown Magistrates
Sex and Immediate Custody
Figure 4.2 – The custody rate for females sentenced at Magistrates’ Courts in England and Wales, 2010 to 2017
Source: Ministry of Justice
4.9 In England, 60.5% of all immediate custodial sentences given to females were handed out at the Magistrates’ Court between 2010 and 2017.40
4.10 The number of immediate custodial sentences given to females at Magistrates’ Courts in England declined by 6.4% between 2010 and 2017.41
4.11 The custody rate for female offenders sentenced at Magistrates’ Courts in England fell by
1.8% during the same period.42
40 Magistrates’ Court: 34,112. Crown Court: 22,245. 41 From 4,493 in 2010 to 4,206 in 2017. 42 From 1.64% in 2010 to 1.61% in 2017. 0.0 0.2 0.4 0.6 0.8 1.0 1.2 1.4 1.6 1.8 2.0 2017 2016 2015 2014 2013 2012 2011 2010 Wales England
Figure 4.3 – The use of immediate custody for females at Magistrates’ and Crown Courts in England, 2010 to 2017
Source: Ministry of Justice
4.12 The average custody rate for women sentenced at the Crown Court was higher in Wales (35.1%) than England (33%) between 2010 and 2017.
4.13 37.2% of all immediate custodial sentences handed to female offenders in Wales between 2010 and 2017 were at the Crown Court.
4.14 There were 2.6% fewer immediate custodial sentences handed to female offenders at
Crown Courts in Wales in 2017 than in 2010.43
4.15 Despite this fall, the custody rate for females sentenced at Crown Courts in Wales actually
increased by 24.4%.44 43 From 196 in 2010 to 191 in 2017. 44 From 31.2% in 2010 to 38.8% in 2017. 0 500 1000 1500 2000 2500 3000 3500 4000 4500 5000 2017 2016 2015 2014 2013 2012 2011 2010 Crown Magistrates
Sex and Immediate Custody
Figure 4.4 – The custody rate for females sentenced at Crown Courts in England and Wales, 2010 to 2017
Source: Ministry of Justice
4.16 In England, 39.5% of all immediate custodial sentences were handed to female offenders at the Crown Court between 2010 and 2017.
4.17 The number of females sentenced to immediate custody at English Crown Courts fell by almost a quarter (24.5%) during this period.
4.18 The custody rate for females sentenced at Crown Courts in England was 18.8% higher in
2017 than it was in 2010.45 45 From 30.9% in 2010 to 36.7% in 2017. 0 5 10 15 20 25 30 35 40 45 2017 2016 2015 2014 2013 2012 2011 2010 Wales England
Figure 4.5 – The use of immediate custody for males sentenced at Magistrates’ and Crown Courts in Wales, 2010 to 2017
Source: Ministry of Justice
4.19 91.9% of all immediate custodial sentences handed out across all courts in England and
Wales between 2010 and 2017 were given to male offenders.46
4.20 The total number of immediate custodial sentences given to male offenders fell by 15.5%
in England and Wales over this period.47
4.21 At all courts in Wales, the number of male offenders sentenced to immediate custody was
1.7% lower in 2017 than in 2010.48
4.22 On average, a higher proportion of male offenders were sentenced to immediate custody at Magistrates’ Court in Wales (5.45%) than in England (5.02%) between 2010 and 2017. 4.23 Approximately half (50.3%) of all immediate custodial sentences given to male offenders
in Wales were handed out at Magistrates’ Courts in Wales during this period. 4.24 The number of immediate custodial sentences handed out to male offenders at
Magistrates’ Courts in Wales increased between 2010 and 2017 by 9.1%.49
4.25 The custody rate for males sentenced at Magistrates’ Courts in Wales increased by 19% between 2010 and 2017. The level rose from 5.11% in 2010 to 6.08% in 2017.
46 The male and female total between 2010 and 2017 was 752,815. The male total during this period was 691,957. 47 From 93,016 in 2010 to 78,553 in 2017. 48 From 5,736 in 2010 to 5,641 in 2017. 49 From 2,746 in 2010 to 2,996 in 2017. 2400 2500 2600 2700 2800 2900 3000 3100 3200 2017 2016 2015 2014 2013 2012 2011 2010 Crown Magistrates
Sex and Immediate Custody
Figure 4.6 – The custody rate for males sentenced at Magistrates’ Courts in England and Wales, 2010 to 2017
Source: Ministry of Justice
4.26 In stark contrast to Wales, the number of immediate custodial sentences given to male
offenders at Magistrates’ Courts in England decreased by 17.4% between 2010 and 2017.50
4.27 46.3% of all immediate custodial sentences handed to male offenders in England were at the Magistrates’ Court between 2010 and 2017.
4.28 The proportion of cases resulting in an immediate custodial sentence increased by 4.9% from 4.72% in 2010 to 4.95% in 2017. 50 From 41,054 in 2010 to 33,894 in 2017. 0 1 2 3 4 5 6 7 2017 2016 2015 2014 2013 2012 2011 2010 Wales England
Figure 4.7 – The use of immediate custody for males sentenced at Magistrates’ and Crown Courts in England, 2010 to 2017
Source: Ministry of Justice
4.29 Between 2010 and 2017, the average custody rate for male offenders sentenced at the Crown Court was higher in Wales (61.7%) than England (57.7%).
4.30 There was not a single year between 2010 and 2017 in which the custody rate in England exceeded the rate recorded in Wales.
4.31 Since 2010, 49.7% of all immediate custodial sentences for male offenders were handed out at the Crown Court in Wales.
4.32 Between 2010 and 2017, the number of immediate custodial sentences handed to male
offenders at Crown Courts in Wales decreased by 11.5%.51
4.33 The custody rate for male offenders at Crown Courts in Wales was 13.5% higher in 2017
than it was in 2010.52
4.34 In England, the number of immediate custodial sentences handed out at Crown Courts
fell by 15.6% between 2010 and 2017.53
4.35 Over half (53.7%) of all immediate custodial sentences for male offenders in England were handed out at the Crown Court during this period.
51 From 2,990 in 2010 to 2,645 in 2017. 52 From 58.4% in 2010 to 66.3% in 2017. 53 From 46,226 in 2010 to 39,018 in 2017. 0 10000 20000 30000 40000 50000 60000 2017 2016 2015 2014 2013 2012 2011 2010 Crown Magistrates
Sex and Immediate Custody
Figure 4.8 – The custody rate for males sentenced at Crown Courts in England and Wales, 2010 to 2017
Source: Ministry of Justice
4.36 The custody rate for male offenders sentenced at Crown Courts in England increased by
11.5% between 2010 and 2017.54 54 From 54% in 2010 to 60.2% in 2017. 0 10 20 30 40 50 60 70 2017 2016 2015 2014 2013 2012 2011 2010 Wales England
5. CHILDREN AND IMMEDIATE CUSTODY
55Category Higher Average Custody Rate England % Wales %
Youth Court England 4.54 4.29
Boys (Youth Court) England 4.96 4.72
Girls (Youth Court) England 1.91 1.6
Crown Court Wales 50.5 54.7
Boys (Crown) Wales 51.9 55
Girls (Crown) Wales 29.5 50
Source: Ministry of Justice
5.1 Children charged with criminal offences are tried in either the Youth Court or Crown Court in England and Wales.
5.2 The Sentencing Council for England and Wales state that, subject to a number of exceptions, cases that involve children should be heard in the Youth Court.
5.3 Operating as a type of Magistrates’ Court, the Youth Court is regarded as the site “best designed” to meet the “specific needs” of children and young people ordered to appear in court (Sentencing Council, 2017:7).
5.4 Cases involving children and young people will be heard in the Crown Court if the
offence charged is likely to result in a possible sentence outcome of more than two years detention. The Sentencing Council (2017: 7) assert that a case will be sent to the Crown Court if the offence charged is a specific offence that, if found guilty, the child or young person will be considered a “significant risk” to the public under the “dangerous offender provisions” set out in Schedule 15 of the Criminal Justice Act 2003.
5.5 Between 2010 and 2017, the total number of immediate custodial sentences that were
handed to children in England and Wales fell by 62.3%.56
5.6 While the number of custodial sentences handed to children at Crown Courts in England
and Wales decreased by 57.2%, the number at Youth Courts fell by 64.3%.57
55 Children are defined here as those aged under 18. 56 From 4,219 in 2010 to 1,589 in 2017.
Children and Immediate Custody
Figure 5.1 – The use of immediate custody for children in England and Wales, 2010 to 2017
Source: Ministry of Justice
5.7 The reduction in immediate custodial sentences has had a significant impact on the
number of children in custody. 58 Between January 2010 and December 2017, the number
of children in custody in England and Wales declined by 70.4%.
5.8 The number of Welsh children in custody fell by 71.8% from 117 in January 2010 to 33 in
December 2017.59
5.9 At the end of October 2018, there were 27 Welsh children in custody in England and
Wales.60
58 Youth Custody Data – https://www.gov.uk/government/statistics/youth-custody-data From 2,916 in January 2010 to 862 in January 2017.
Research has shown that other factors have made a significant contribution to the reduction in the number of children in custody in England and Wales. These factors include changes in police practice (Sutherland et al, 2017), the use of diversion (Haines, 2008) and falling youth crime in England and Wales (National Audit Office, 2010).
59 Youth Custody Data – https://www.gov.uk/government/statistics/youth-custody-data From 117 in January 2010 to 33 in December 2017.
60 Youth Custody Data – https://www.gov.uk/government/statistics/youth-custody-data 0 500 1000 1500 2000 2500 3000 3500 4000 4500 4,219 4,205 3,085 2,348 1,858 1,786 1,598 1,589 2017 2016 2015 2014 2013 2012 2011 2010
Figure 5.2 – The annual average number of Welsh children in custody, 2010 to 2017
Source: Ministry of Justice
5.10 On average, a higher proportion of children were sentenced to immediate custody at the Youth Court in England (4.54%) than Wales (4.29%) between 2010 and 2017.
5.11 The total number of immediate custodial sentences given to children in Wales fell by
70.5% between 2010 and 2017.61
5.12 Between 2010 and 2017, 70.6% of all immediate custodial sentences given to children
were handed out at the Youth Court in Wales.62
5.13 The number of children sentenced to immediate custody at Youth Courts in Wales fell by 71.1% from 173 in 2010 to 50 in 2017.
5.14 The rate at which children were sentenced to immediate custody at Welsh Youth Courts
was 3.1% higher in 2017 than in 2010.63
5.15 In England, 69.8% of all immediate custodial sentences were handed to children at the Youth Court between 2010 and 2017.
5.16 The number of immediate custodial sentences given to children at the Youth Court in
England fell by 63.9% during this period.64
5.17 The custody rate for children sentenced at Youth Courts in England was 11.8% higher in
2017 than it was in 2010.65
61 From 254 in 2010 to 75 in 2017.
62 This figure includes children who were sentenced to ‘Imprisonment for public protection’ between 2010 and 2017. 63 From 4.23% in 2010 to 4.36% in 2017. 64 From 2,865 in 2010 to 1,034 in 2017. 65 From 4.23% in 2010 to 4.73% in 2017. 0 20 40 60 80 100 120 140 2017 2016 2015 2014 2013 2012 2011 2010
Children and Immediate Custody
Figure 5.3 – The custody rate for children sentenced at Youth Courts in England and Wales, 2010 to 2017
Source: Ministry of Justice
5.18 The average custody rate for boys sentenced at the Youth Court was higher in England (4.96%) than Wales (4.72%) between 2010 and 2017.
5.19 The number of immediate custodial sentences handed to boys at Youth Courts in Wales
fell by three quarters (75.5%) during this period.66
5.20 The decline in immediate custodial sentences was accompanied by a fall in the custody rate for boys sentenced at Youth Courts in Wales. The rate fell by 14.3% from 4.76% in 2010 to 4.08% in 2017.
5.21 In England, the number of boys sentenced to immediate custody at the Youth Court fell
by 63.8% between 2010 and 2017.67
5.22 Despite this decrease, the custody rate for boys sentenced at English Youth Courts was
9.4% higher in 2010 than it was 2017.68
66 From 163 in 2010 to 40 in 2017. 67 From 2,641 in 2010 to 957 in 2017. 68 From 4.66% in 2010 to 5.10% in 2017. 0 1 2 3 4 5 6 2017 2016 2015 2014 2013 2012 2011 2010 Wales England
Figure 5.4 – The average custody rate for children sentenced at Youth Courts in England and Wales by sex, 2010 to 2017
Source: Ministry of Justice
5.23 On average, the custody rate for girls sentenced at Youth Courts was higher in England (1.91%) than Wales (1.6%) between 2010 and 2017.
5.24 The number of immediate custodial sentences handed to girls at the Youth Court in Wales fell from nine to six between 2010 and 2017.
5.25 Despite this decline, the custody rate for girls in Wales was 178% higher in 2017 than it
was in 2010.69
5.26 In England, both the custody rate and the number of immediate custodial sentences handed to girls at Youth Courts fell between 2010 and 2017.
5.27 The number of custodial sentences given to girls at Youth Courts in England declined by 83.4% from 199 in 2010 to 33 in 2017.
5.28 The custody rate for girls was 35.1% lower in 2017 than the level recorded in 2010.70
69 Due to the small sample size year to year changes will result in large fluctuations in the population changes. From 1.39% in 2010 to 3.87% in 2017. 70 From 1.91% in 2010 to 1.24% in 2017. 0 1 2 3 4 5 6 4.96 1.91 4.54 4.72 1.6 4.29 Total Girls Boys Wales England %
Children and Immediate Custody
Figure 5.5 – The custody rate for children sentenced at Crown Courts in England and Wales, 2010 to 2017
Source: Ministry of Justice
5.29 The average custody rate for children sentenced at the Crown Court was higher in Wales (54.7%) than England (50.5%) between 2010 and 2017.
5.30 29.4% of all immediate custodial sentences given to children were handed out at Crown Courts in Wales between 2010 and 2017.
5.31 The number of immediate custodial sentences handed to children at Welsh Crown Courts
was 69.1% lower in 2017 than the level recorded in 2010.71
5.32 The custody rate for children sentenced at Welsh Crown Courts decreased by 23.8%
during this period.72
5.33 In England, 30.2% of all immediate custodial sentences were handed to children at the Crown Court between 2010 and 2017.
5.34 There were 56.4% fewer immediate custodial sentences handed to children at Crown
Courts in England in 2017 than in 2010.73
5.35 The custody rate for children sentenced at English Crown Courts was 7.6% lower in 2017 than 2010. The rate fell from 52.8% in 2010 to 48.8% in 2017.
5.36 The average custody rate for boys sentenced at Crown Courts was higher in Wales (55%) than in England (51.9%) between 2010 and 2017.
71 From 81 in 2010 to 25 in 2017. 72 From 66.9% in 2010 to 51% in 2017. 73 From 1,100 in 2010 to 480 in 2017. 0 10 20 30 40 50 60 70 80 2017 2016 2015 2014 2013 2012 2011 2010 Wales England
5.37 The number of boys sentenced to immediate custody at Crown Courts in Wales also fell
(70.3%) during this period.74
5.38 The proportion of cases resulting in an immediate custodial sentence for boys sentenced
at the Crown Court in Wales fell by 22.1% between 2010 and 2017.75
5.39 In England, the number of boys sentenced to immediate custody at the Crown Court was
halved (55.4%) between 2010 and 2017.76
5.40 During this period, the custody rate for boys sentenced at English Crown Courts fell by
7.7%.77
Figure 5.6 – The average custody rate for children sentenced at Crown Courts in England and Wales by sex, 2010 to 2017
Source: Ministry of Justice
5.41 The average custody rate for girls sentenced at Crown Courts was lower in England
(29.5%) than Wales (50%) between 2010 and 2017.78
5.42 The number of girls sentenced to immediate custody at Crown Courts in Wales fell from seven in 2010 to three in 2017 (57.1%).
74 From 74 in 2010 to 22 in 2017. 75 From 67.3% in 2010 to 52.4% in 2017. 76 From 1,057 in 2010 to 471 in 2017 77 From 54.6% in 2010 to 50.4% in 2017.
78 There were 20 immediate custodial sentences handed to girls sentenced at the Crown Court in Wales between 2010 and 2017. 0 10 20 30 40 50 60 51.9 29.5 50.5 55 50 54.7 Total Girls Boys Wales England %
Children and Immediate Custody
5.43 The custody rate for girls sentenced at Crown Courts in Wales decreased during this
period by 32.5%.79
5.44 At Crown Courts in England, the number of immediate custodial sentences handed to
girls fell by 79.1% between 2010 and 2017.80
5.45 The custody rate for girls at Crown Courts in England also decreased by more than a third (35.9%) from 28.7% in 2010 to 18.4% in 2017.
79 From 63.6% in 2010 to 42.9% in 2017. 80 From 43 in 2010 to 9 in 2017.
6. YOUNG ADULTS AND IMMEDIATE CUSTODY
81Category Higher Average Custody Rate England % Wales %
Magistrates Wales 4 5.2
Male (Magistrates) Wales 4.9 6.46
Female (Magistrates) Wales 1.44 1.86
Crown Wales 54.7 58.3
Male (Crown) Wales 56.6 60.7
Female (Crown) Wales 30.8 32.2
Source: Ministry of Justice
6.1 The issue of youth-to-adult transitions has attracted significant academic research and policy interest over the course of the last decade. This body of work has consistently pointed to the developmental and emotional difficulties facing young adults (18-24) in the criminal justice system and has also highlighted the need for alternative responses (e.g. Barrow Cadbury Trust, 2005; Criminal Justice Joint Inspection, 2012; Prior et al, 2011). 6.2 Following its inquiry into the treatment of young adults in the criminal justice system, the
House of Commons Justice Committee (2016: 61) concluded that there exists a “strong case” for an alternative approach to the way in which young adults are treated in the criminal justice system in England and Wales.
6.3 The Justice Committee’s (2016: 3) report criticised the Ministry of Justice and NOMS (i.e. HMPPS) for not giving “sufficient weight” to the possible implications of brain maturation
for young adults in prison. In response, the Ministry of Justice’s Prison Safety and Reform
White Paper outlined the need to recognise the “different problems” facing young adults and committed itself to reflect upon the Committee report’s findings (Ministry of Justice, 2016b: 8).
6.4 Concerns have also been raised about the treatment of young adults at the sentencing stage of the criminal justice process. Despite the Sentencing Council’s decision to
introduce ‘lack of maturity’ as a mitigating factor in formal sentencing guidelines in early 2011, the Justice Committee (2016: 33) concluded that neither the Crown Prosecution Service nor the Sentencing Council “have a sufficiently sophisticated understanding of maturity to weigh up how it might affect young adults’ culpability”.
Young Adults and Immediate Custody
6.5 The Sentencing Council’s most recently published guidelines on children provides some “powerful guidance” on the role of maturation (Transition to Adulthood Alliance, 2017: 8). This includes the advice to sentencers to consider “the developmental and emotional age” of children and young people as of “at least equal importance” to their chronological age. The guidelines also signal the need to determine if children or young people have the “necessary maturity” to fully understand the consequences of their behaviour (Sentencing Council, 2017: 17).
6.6 Despite these developments, a follow-up report published by the House of Commons Justice Committee (2018: 25) called for the Ministry of Justice to develop a more “data-driven” approach to improving the guidance that is given to prosecutors and sentencers in England and Wales.
6.7 Since 2010, the number of immediate custodial sentences handed to young adults at all
courts in England and Wales has fallen by 44%.82
6.8 In Wales, young adults in custody have been identified as a specific priority area. The
objectives set out in the Wales Reducing Reoffending Strategy included the need to
develop a better understanding of the needs of young adult offenders and to develop “protocols and procedures” to help support young people as they transition to adult services (Integrated Offender Management Cymru, 2014: 24).
6.9 Between 2010 and 2017, a quarter (25.7%) of all immediate custodial sentences in Wales were given to young adults.
6.10 In 2010, a third (33.9%) of all immediate custodial sentences handed out at courts in Wales were given to young adults. In 2017, this figure had fallen to a fifth (20.9%) of all immediate custodial sentences.
6.11 The total number of immediate custodial sentences handed to young adults in Wales fell
by 38.2% between 2010 and 2017.83
6.12 In 2017, 18-24 year olds made up 16.2% of the total Welsh prison population.84
82 From 31,398 in 2010 to 17,581 in 2017. 83 From 2,124 in 2010 to 1,312 in 2017.
Figure 6.1 – The use of immediate custody for young adults in England and Wales, 2010 to 2017
Source: Ministry of Justice
6.13 The average custody rate for young adults sentenced at Magistrates’ Courts was higher in Wales (5.2%) than England (4%) between 2010 and 2017.
6.14 There was not a single year between 2010 and 2017 where the custody rate for young adults sentenced in England was higher than the level recorded in Wales.
6.15 43.7% of all immediate custodial sentences given to young adults were handed out at Magistrates’ Courts in Wales between 2010 and 2017.
6.16 The number of young adults sentenced to immediate custody at Magistrates’ Courts in
Wales fell by 33.4% during this period.85
6.17 Despite this fall, the custody rate for young adults sentenced at Welsh Magistrates’
Courts was higher in 2017 (5.65%) than the level recorded in 2010 (5.42%).86
6.18 In England, the use of immediate custody for young adults fell at a higher rate than in Wales between 2010 and 2017.
6.19 In England, 37.9% of all immediate custodial sentences were given to young adults at the Magistrates’ Court.
6.20 Between 2010 and 2017, the number of immediate custodial sentences handed to young
adults at Magistrates’ Courts in England fell by 51.3%.87
85 From 908 in 2010 to 605 in 2017. 86 This represents an increase of 4.2%. 87 From 11,892 in 2010 to 5,789 in 2017. 0 5000 10000 15000 20000 25000 30000 35000 31,398 30,872 27,099 23,194 22,114 20,541 19,185 17,851 2017 2016 2015 2014 2013 2012 2011 2010
Young Adults and Immediate Custody
6.21 The custody rate for young adults sentenced at the Magistrates’ Court in England was
20% lower in 2017 than in 2010.88
Figure 6.2 – The average custody rate for young adults sentenced at Magistrates’ Courts in England and Wales, 2010 to 2017
Source: Ministry of Justice
6.22 A significant amount of the research on youth to adult transitions has focussed upon the disparate problems facing young adult males. The Ministry of Justice’s (2015: 5) own evidence to the Justice Committee highlighted the need to “respond differently” to young adult males based on its own evidence around psychological maturity.
6.23 Between 2010 and 2017, the average custody rate for young adult males sentenced at Magistrates’ Courts was higher in Wales (6.46%) than in England (4.9%).
6.24 The number of young adult males sentenced to immediate custody at Magistrates’
Courts in Wales fell by a third (33.8%) between 2010 and 2017.89
6.25 Despite this decline, the custody rate for young adult males sentenced at Welsh
Magistrates’ Courts was 13.4% higher in 2017 than in 2010.90
88 From 4.36% in 2010 to 3.49% in 2017. 89 From 828 in 2010 to 548 in 2017. 90 From 6.44% in 2010 to 7.3% in 2017. 0 1 2 3 4 5 6 7 2017 2016 2015 2014 2013 2012 2011 2010 Wales England
6.26 The number of immediate custodial sentences handed to young adult males sentenced
at the Magistrates’ Court decreased by 50.7% between 2010 and 2017.91
6.27 This decline was accompanied by a fall in the custody rate for young adult males at Magistrates’ Courts in England. This figure fell from 5.1% in 2010 to 4.44% in 2017.
Figure 6.3 – The average custody rate for young adults sentenced at Magistrates’ Courts in England and Wales by sex, 2010 to 2017
Source: Ministry of Justice
6.28 With so much emphasis placed upon the experiences of young adult males, the welfare and treatment of young adult females in the criminal justice system has been subject to little research (House of Commons Justice Committee, 2016).
6.29 Despite this lacuna, evidence submitted to the House of Commons Justice Committee’s (2016) inquiry into the treatment of young adults in the criminal justice system identified that young adult females adapt and respond differently to the difficulties they face in custody.
6.30 Between 2010 and 2017, the average custody rate for young adult females was higher in Wales (1.86%) than England (1.44%).
6.31 The number of young adult females sentenced to immediate custody at Magistrates’
Courts in Wales decreased by more than a quarter (28.9%) between 2010 and 2017.92
91 From 10,784 in 2010 to 5,321 in 2017. 92 From 76 in 2010 to 54 in 2017. 0 1 2 3 4 5 6 7 Total Female Male Wales England % 4.9 1.44 4 6.46 1.86 5.2
Young Adults and Immediate Custody
6.32 The custody rate for young adult females was 1.4% lower in 2017 than the level recorded
in 2010.93
6.33 At Magistrates’ Courts in England, the number of immediate custodial sentences handed
to young adult females decreased by 60.4% between 2010 and 2017.94
6.34 During this period the custody rate for young adult females also fell. The rate in 2017 was
39.2% lower than in 2010.95
Figure 6.4 – The custody rate for young adults sentenced at Crown Courts in England and Wales, 2010 to 2017
Source: Ministry of Justice
6.35 The average custody rate for young adults sentenced at Crown Courts was higher in Wales (58.3%) than in England (54.7%) between 2010 and 2017.
6.36 56.3% of all immediate custodial sentences given to young adults were handed out at Crown Courts in Wales between 2010 and 2017.
6.37 The number of immediate custodial sentences handed to young adults at Welsh Crown Courts fell by 41.9%, from 1,216 in 2010 to 707 in 2017.
6.38 Despite this decline, the custody rate for young adults sentenced at Crown Courts in Wales was higher in 2017 (62.4%) than in 2010 (57.3%).
93 From 2.09% in 2010 to 2.06% in 2017. 94 From 1,031 in 2010 to 408 in 2017. 95 From 1.89% in 2010 to 1.15% in 2017. 0 10 20 30 40 50 60 70 2017 2016 2015 2014 2013 2012 2011 2010 Wales England
6.39 In England, 62.1% of all immediate custodial sentences were handed to young adults at the Crown Court between 2010 and 2017.
6.40 The number of immediate custodial sentences given to young adults at Crown Courts in England was 39.7% lower in 2017 than in 2010.
6.41 The custody rate for young adults sentenced at English Crown Courts increased between 2010 and 2017. The rate rose from 51.8% in 2010 to 56.1% in 2017.
Figure 6.5 – The average custody rate for young adults sentenced at Crown Courts in England and Wales by sex, 2010 to 2017
Source: Ministry of Justice
6.42 The average custody rate for young adult males sentenced at the Crown Court was higher in Wales (60.7%) than in England (56.6%) between 2010 and 2017.
6.43 Between 2010 and 2017, the number of immediate custodial sentences handed to young
adult males decreased by 41.4% at Crown Courts in Wales.96
6.44 However, the custody rate for young adult males sentenced at Welsh Crown Courts increased by 8.2% from 59.8% in 2010 to 64.7% in 2017.
6.45 The number of immediate custodial sentences given to young adult males sentenced at
Crown Courts in England also fell by 38.9% between 2010 and 2017.97
96 From 1,155 in 2010 to 677 in 2017. 97 From 16,566 in 2010 to 10,117 in 2017. 0 10 20 30 40 50 60 70 60.7 32.2 58.3 56.6 30.8 54.7 Total Female Male Wales England %
Young Adults and Immediate Custody
6.46 Despite this reduction, the custody rate for young adult males increased at Crown Courts
in England by 7.4% between 2010 and 2017.98
6.47 The average custody rate for young adult females sentenced at the Crown Court was higher in Wales (32.2%) than in England (30.8%) between 2010 and 2017.
6.48 The number of immediate custodial sentences handed to young adult females at Crown
Courts in Wales was half the figure (50.8%) in 2017 than it was in 2010.99
6.49 Despite this decline, the custody rate for young adult females sentenced at the Crown
Court in Wales was 9.9% higher in 2017.100
6.50 In England, the number of immediate custodial sentences handed to young adult females
at the Crown Court was 55.5% lower in 2017 than in 2010.101
6.51 The custody rate for young adult females increased by 2.3% between 2010 and 2017.102
98 From 53.7% in 2010 to 57.7% in 2017. 99 From 61 in 2010 to 30 in 2017. 100 From 31.4% in 2010 to 34.5% in 2017. 101 From 816 in 2010 to 363 in 2017. 102 From 30.2% in 2010 to 30.9% in 2017.