1
Analysis of the civil society context of four selected
countries for the Task Team on Civil Society
Irene van Staveren
Director Indices of Social Development database (staveren@iss.nl)
Institute of Social Studies 23 February 2015
2
Introduction
This report shows the results of a descriptive quantitative analysis of the civil society context of the four selected countries of the Task Team. The analysis uses data for the year 2010 for five indicators. For each indicator, the value or rank of each of the four countries is compared with the average score for all developing countries for which data is available for a particular index. Also for
comparison, the values will be shown for 12 neighboring developing countries. The reference group of developing countries consists of all low and medium income countries (126 countries). The five indices are part of the database Indices of Social Development (www.indsocdev.org). The scale is a 100-point scale, from 0 (low score) to 100 (high score).
The objective of this comparative analysis is to give a picture of how the four selected countries score relative to other developing countries. For this, the analysis has two levels. The first level concerns predispositions of countries towards civil society agency. This may be regarded as inherent cultural and social values and attitudes in civil society. This includes the following three indices: - Interpersonal Safety and Trust (IST)
- Inclusion of Minorities (IM) - Intergroup Cohesion (IC)
The second level of the analysis concerns actual civil society behaviour, that is, the actual agency expressed in civil society. This second level includes the following two indices:
- Civic Activism (CA)
- Clubs and Associations (C&A)
Each indicator analysis is presented both in table format, with values, and a bar chart, for a visual comparison.
In addition, each index will show the trend development for each country for 5 data points in time: 1990, 1995, 2000, 2005, 2010.
The annex will show bar diagrams with the distribution of all countries for each developing country, and the top-ten list of countries.
Predisposition of civil society agency
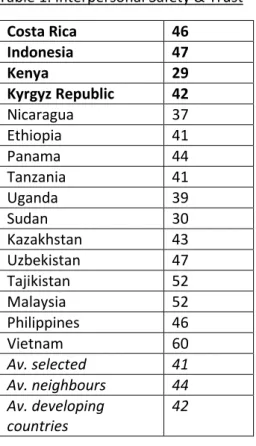
Table 1 and diagram 1 present the results for Interpersonal safety and Trust (IST). They indicate that Kenya scores relatively low (29), but the four-country average (41) is very close to that of all
developing countries (42). This implies that the four selected countries do not stand out in the extent of experienced interpersonal safety and trust in their societies. However, the average score for the neighbors is higher: 44. So, the selected countries score a bit lower on interpersonal safety & trust than their neighbors and all developing countries.
3 Table 1. Interpersonal Safety & Trust
Costa Rica 46 Indonesia 47 Kenya 29 Kyrgyz Republic 42 Nicaragua 37 Ethiopia 41 Panama 44 Tanzania 41 Uganda 39 Sudan 30 Kazakhstan 43 Uzbekistan 47 Tajikistan 52 Malaysia 52 Philippines 46 Vietnam 60 Av. selected 41 Av. neighbours 44 Av. developing countries 42
Diagram 1a. Interpersonal Safety & Trust
0 10 20 30 40 50 60 Co sta R ic a In d o n es ia Ke n ya Kyrg yz R ep u b lic N ic arag u a Eth io p ia Pa n ama Ta n za n ia Ug an d a Su d an Kaz ak h stan Uzbe ki stan Ta jiki stan Mal ays ia Phi lip p in e s V ie tn am A v. se le cte d A v. n ei gh b o u rs A v. d eve lo p in g c o u n tr ie s
Interpersonal Safety & Trust
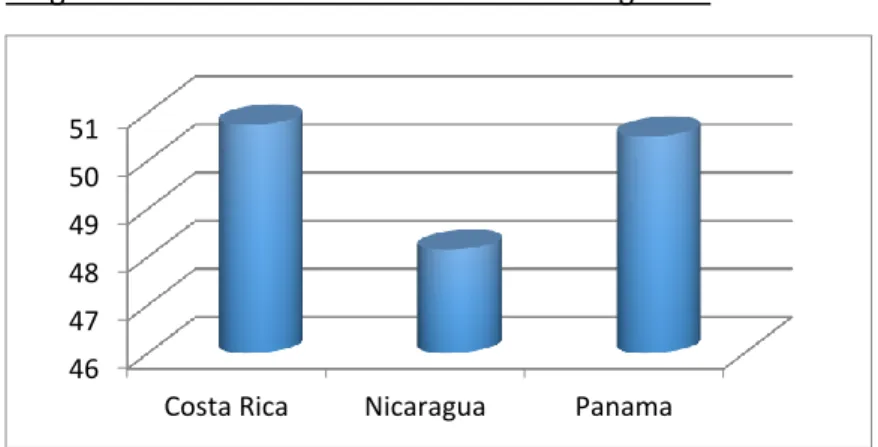
4 Diagram 1b. Interpersonal Safety & Trust: Costa Rica and neighbors
Diagram 1c. Interpersonal Safety & Trust: Kyrgyz Republic and neighbors
Diagram 1d. Interpersonal Safety & Trust: Kenya and neighbors
Diagram 1e. Interpersonal Safety & Trust: Indonesia and neighbors 0 10 20 30 40 50
Costa Rica Nicaragua Panama
0 20 40 60 Kyrgyz Republic
Kazakhstan Uzbekistan Tajikistan
0 20 40 60
Kenya Ethiopia Tanzania Uganda Sudan
0 20 40 60 80
Indonesia Malaysia Philippines Vietnam
Interpersonal Safety & Trust
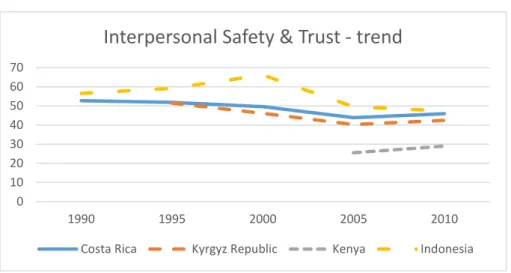
5 Diagram 1f. Interpersonal Safety & Trust: trend
Table 2 and diagram 2 present the results for Inclusion of Minorities (IM). They indicate that all four selected countries score very closely to each other and to the four-country average (44). This
average is very close to that of all developing countries (43) and to the average of the neighbors (43). This implies that the four selected countries differ only a little bit from the rest of the developing world in the extent of inclusion of minorities in their societies. They score a bit higher.
Table 2 Inclusion of Minorities
Costa Rica 49 Indonesia 40 Kenya 43 Kyrgyz Republic 45 Nicaragua 45 Ethiopia 49 Panama 42 Tanzania 44 Uganda 39 Sudan 28 Kazakhstan 45 Uzbekistan Tajikistan Malaysia 44 Philippines 44 Vietnam 54 Av. selected 44 Av. neighbours 43 Av. developing countries 43 0 10 20 30 40 50 60 70 1990 1995 2000 2005 2010
Interpersonal Safety & Trust - trend
6 Diagram 2a Inclusion of Minorities
Diagram 2b. Inclusion of Minorities: Costa Rica and neighbors
Diagram 2c. Inclusion of Minorities: Kyrgyz Republic and neighbors 0 10 20 30 40 50 60 Co sta R ic a In d o n es ia Ke n ya Kyrg yz R ep u b lic N ic arag u a Eth io p ia Pa n ama Ta n za n ia Ug an d a Su d an Kaz ak h stan Uzbe ki stan Ta jiki stan Mal ays ia Phi lip p in e s V ie tn am A v. se le cte d A v. n ei gh b o u rs A v. d eve lo p in g…
Inclusion Minorities
selected neighbours averages
35 40 45 50
Costa Rica Nicaragua Panama
45 45 45 45 45 45 45 Kyrgyz Republic
7 Diagram 2d. Inclusion of Minorities: Kenya and neighbors
Diagram 2e. Inclusion of Minorities: Indonesia and neighbors
Diagram 2f. Inclusion of Minorities: trend 0 10 20 30 40 50
Kenya Ethiopia Tanzania Uganda Sudan
0 10 20 30 40 50 60
Indonesia Malaysia Philippines Vietnam
Inclusion Minorities
0 10 20 30 40 50 60 1990 1995 2000 2005 2010Inclusion Minorities - trend
8 Table 3 and diagram 3 present the results for Intergroup Cohesion (IC). They indicate that Costa Rica scores quite a bit higher than the other three countries (75). But the four-country average (65) is very close to the average of all developing countries (64) and neighbors (64). As a consequence, the selected countries score a bit higher.
Table 3 Intergroup Cohesion
Costa Rica 75 Indonesia 64 Kenya 60 Kyrgyz Republic 60 Nicaragua 72 Ethiopia 57 Panama 73 Tanzania 70 Uganda 56 Sudan 41 Kazakhstan 76 Uzbekistan 62 Tajikistan 66 Malaysia 73 Philippines 54 Vietnam 75 Av. selected 65 Av. neighbours 64 Av. developing countries 64
Diagram 3a Intergroup Cohesion
0 10 20 30 40 50 60 70 80 Co sta R ic a In d o n es ia Ke n ya Kyrg yz R ep u b lic N ic arag u a Eth io p ia Pa n ama Ta n za n ia Ug an d a Su d an Kaz ak h stan Uzbe ki stan Ta jiki stan Mal ays ia Phi lip p in e s V ie tn am A v. se le cte d A v. n ei gh b o u rs A v. d eve lo p in g c o u n tr ie s
Intergroup Cohesion
9 Diagram 3b. Intergroup Cohesion: Costa Rica and neighbors
Diagram 3c. Intergroup Cohesion: Kyrgyz Republic and neighbors
Diagram 3d. Intergroup Cohesion: Kenya and neighbors 70 71 72 73 74 75 76
Costa Rica Nicaragua Panama
0 20 40 60 80 Kyrgyz Republic
Kazakhstan Uzbekistan Tajikistan
0 10 20 30 40 50 60 70 80
10 Diagram 3e. Intergroup Cohesion: Indonesia and neighbors
Diagram 3f. Intergroup Cohesion: Trend
Actual civil society agency
Table 4 and diagram 4 present the results for Civic Activism (CA). They indicate that Kyrgyz Republic scores relatively low (45), but the four-country average (49) is very close to that of all developing countries (48) and the neighbors (48). This implies that the four selected countries score a bit higher than their neighbours and all developing countries.
0 10 20 30 40 50 60 70 80
Indonesia Malaysia Philippines Vietnam
Intergroup Cohesion
0 10 20 30 40 50 60 70 80 1990 1995 2000 2005 2010Intergroup Cohesion - trend
11 Table 4 Civic Activism
Costa Rica 51 Indonesia 51 Kenya 49 Kyrgyz Republic 45 Nicaragua 48 Ethiopia 43 Panama 50 Tanzania 50 Uganda 49 Sudan 45 Kazakhstan Uzbekistan 42 Tajikistan Malaysia 53 Philippines 51 Vietnam 49 Av. selected 49 Av. neighbours 48 Av. developing countries 48
Diagram 4a Civic Activism
0 10 20 30 40 50 60 Co sta R ic a In d o n es ia Ke n ya Kyrg yz R ep u b lic N ic arag u a Eth io p ia Pa n ama Ta n za n ia Ug an d a Su d an Kaz ak h stan Uzbe ki stan Ta jiki stan Mal ays ia Phi lip p in e s V ie tn am A v. se le cte d A v. n ei gh b o u rs A v. d eve lo p in g c o u n tr ie s
Civic Activism
12 Diagram 4b. Civic Activism: Costa Rica and neighbors
Diagram 4c. Civic Activism: Kyrgyz Republic and neighbors
Diagram 4d. Civic Activism: Kenya and neighbors 46 47 48 49 50 51
Costa Rica Nicaragua Panama
40 41 42 43 44 45 Kyrgyz Republic
Kazakhstan Uzbekistan Tajikistan
38 40 42 44 46 48 50
13 Diagram 4e. Civic Activism: Indonesia and neighbors
Diagram 4f. Civic Activism: trend
Table 5 and diagram 5 present the results for the membership of Clubs and Associations (C&A). We see a much lower score for the Kyrgyz Republic (36) than for the other three countries, while Indonesia and Kenya score relatively high (71 and 73 respectively). The average score for the four selected countries (58) is clearly higher than the average of all developing countries (50). This makes the C&A index the only of the five indices for which the selected countries score significantly higher than the developing country average. But, this is only due to the high scores for Indonesia and Kenya. To compare, the average score for the neighbors is a little bit higher (59).
47 48 49 50 51 52 53
Indonesia Malaysia Philippines Vietnam
Civic Activism
0 10 20 30 40 50 60 1990 1995 2000 2005 2010Civic Activism - trend
14 Table 5 Clubs & Associations
Costa Rica 52 Indonesia 71 Kenya 73 Kyrgyz Republic 36 Nicaragua 60 Ethiopia 59 Panama 45 Tanzania 66 Uganda 59 Sudan Kazakhstan Uzbekistan Tajikistan Malaysia Philippines 62 Vietnam 60 Av. selected 58 Av. neighbours 59 Av. developing countries 50
Diagram 5a Clubs & Associations
0 10 20 30 40 50 60 70 80
Clubs & Associations
15 Diagram 5b. Clubs & Associations: Costa Rica and neighbors
Diagram 5c. Clubs & Associations: Kyrgyz Republic and neighbors
Diagram 5d. Clubs & Associations: Kenya and neighbors 0 10 20 30 40 50 60
Costa Rica Nicaragua Panama
0 10 20 30 40 Kyrgyz Republic
Kazakhstan Uzbekistan Tajikistan
0 20 40 60 80
16 Diagram 5e. Clubs & Associations: Indonesia and neighbors
Diagram 5f. Clubs & Associations: trend
Conclusion
The analysis has shown that the four selected countries are quite average developing countries for their civil society scores on the five indices, also compared to their neighbours. This is the case both for the predisposition civil society scores as well as for the actual behaviour scores. What does this say?
It indicates that the selected countries are not extraordinary in terms of their civil society
characteristics. Their civil societies are only slightly stronger, more inclusive, and more active than that of other developing countries (apart from a bit more membership of clubs and associations).
54 56 58 60 62 64 66 68 70 72
Indonesia Malaysia Philippines Vietnam
Clubs & Associations
0 10 20 30 40 50 60 70 80 90 1990 1995 2000 2005 2010
Clubs & Associations - trend
17 This implies that any interventions in the civil societies of these countries are not likely to be much more or less effective than in other countries.
The advantage of this finding is that any success or failure of policies in these four countries cannot be attributed to special features of these countries' civil societies. The disadvantage is that these countries are not particularly more likely to respond to interventions. They are not special. Hence, any interventions in terms of pilot cases are not likely to be more successful, or less successful, as compared to a different country selection close to the average of the total developing country group.
An alternative to this analysis with the selected four countries is a country ranking based on the five ISD indices. The Annex shows, next to the distribution of all developing countries per index, also five tables with the top-ten developing countries per civil society index. A number of countries feature in more than one list. Vietnam is in four of the five lists. Hungary and Taiwan are in three of the five lists. This suggests that these three countries have relatively resilient civil societies.
18
ANNEX: Top-ten countries per civil society index
Interpersonal safety & Trust
IS&T Vietnam 60 China 58 Morocco 57 Libya 57 Bhutan 57 Armenia 57
Iran, Islamic Rep. 57
Belarus 54
Jordan 54
India 53
Syrian Arab Republic 53
Inclusion of Minorities IM Taiwan, China 57 Vietnam 54 Argentina 54 Ukraine 52 Hungary 51 El Salvador 50 Belarus 50 Romania 50 Armenia 49 Ethiopia 49 Costa Rica 49 Intergoup Cohesion IC Botswana 76 Taiwan, China 76 Hungary 76 Kazakhstan 76 Costa Rica 75 Vietnam 75 Gambia, The 75 Libya 74 Dominican Republic 74 Romania 74 Cuba 74 Ukraine 74
19 Civic Activism CA Seychelles 75 Taiwan, China 56 Samoa 55 Macedonia, FYR 55 Turkey 54
St. Vincent and the Grenadines 54 Mauritius 53 Argentina 53 Hungary 53 Fiji 53 Malaysia 53 Azerbaijan 53
Clubs & Associations
C&A Cambodia 85 Malawi 78 Kenya 73 Indonesia 71 Bangladesh 69 Honduras 68 Tanzania 66 Nigeria 65 Dominican Republic 63 Philippines 62 Guatemala 60 Vietnam 60 Nicaragua 60